Major Article
Corresponding author: Dr. Davyson de Lima Moreira.
e-mail: [email protected]; [email protected] Received 6 April 2017
Accepted 10 August 2017
A newly validated high-performance liquid chromatography
method with diode array ultraviolet detection for analysis
of the antimalarial drug primaquine in the blood plasma
Ana Paula Barbosa do Carmo
[1], Manoella Borborema
[1], Stephan Ribeiro
[1],
Ana Cecilia Xavier De-Oliveira
[1], Francisco Jose Roma Paumgartten
[1]and Davyson de Lima Moreira
[1],[2][1]. Laboratório de Toxicologia Ambiental, Departamento de Ciências Biológicas, Escola Nacional de Saúde Pública, Fundação Oswaldo Cruz, Rio de Janeiro, RJ, Brasil. [2]. Departamento de Produtos Naturais, Instituto de Tecnologia em Fármacos – Farmanguinhos,
Fundação Oswaldo Cruz, Rio de Janeiro, RJ, Brasil.
Abstract
Introduction: Primaquine (PQ) diphosphate is an 8-aminoquinoline antimalarial drug with unique therapeutic properties. It
is the only drug that prevents relapses of Plasmodium vivax or Plasmodium ovale infections. In this study, a fast, sensitive,
cost-effective, and robust method for the extraction and high-performance liquid chromatography with diode array ultraviolet detection (HPLC-DAD-UV ) analysis of PQ in the blood plasma was developed and validated. Methods: After plasma protein
precipitation, PQ was obtained by liquid-liquid extraction and analyzed by HPLC-DAD-UV with a modiied-silica cyanopropyl column (250mm × 4.6mm i.d. × 5μm) as the stationary phase and a mixture of acetonitrile and 10mM ammonium acetate buffer (pH = 3.80) (45:55) as the mobile phase. The low rate was 1.0mL·min-1, the oven temperature was 50OC, and absorbance was measured at 264nm. The method was validated for linearity, intra-day and inter-day precision, accuracy, recovery, and robustness. The detection (LOD) and quantiication (LOQ) limits were 1.0 and 3.5ng·mL-1, respectively. The method was used to analyze the plasma of female DBA-2 mice treated with 20mg.kg-1 (oral) PQ diphosphate. Results: By combining a simple, low-cost extraction procedure with a sensitive, precise, accurate, and robust method, it was possible to analyze PQ in small volumes of plasma. The new method presents lower LOD and LOQ limits and requires a shorter analysis time and smaller plasma volumes than those of previously reported HPLC methods with DAD-UV detection. Conclusions: The new validated method is suitable
for kinetic studies of PQ in small rodents, including mouse models for the study of malaria.
Keywords: Malaria. Primaquine. HPLC-DAD. Validation. DBA-2 mice.
INTRODUCTION
Primaquine (PQ) diphosphate is a prototypical drug in the 8-aminoquinoline group of antimalarial agents. It has unique therapeutic properties and is the only drug in use that prevents relapses of infections arising from the reactivation of dormant forms of the malaria parasites Plasmodium vivax or Plasmodium
ovale (also called hypnozoites) in the liver. Moreover, PQ is
active against all developing malaria parasites in the liver and mature gametocytes of P. falciparum in the blood1,2. Despite
weak activity against asexual blood stages of P. falciparum and
other malaria parasites, PQ is the only drug capable – when used in combination with a schizonticide agent – of radically curing P. ovale and P. vivax infections. Notwithstanding its
unique place in the physician’s armamentarium to treat malaria, the use of PQ in clinical practice is limited because it (like pamaquine, tafenoquine, and some other drugs) may trigger severe hemolytic anemia in individuals bearing glucose-6-phosphate dehydrogenase deficiency. PQ may also cause methemoglobinemia but this toxic effect seldom causes overt symptoms and, in most cases, tends to be self-limiting1-6.
Moreover, the therapeutic response to PQ varies depending on the dose and the drug-metabolizing enzyme phenotype. In the last 10 years, studies have consistently shown that PQ is a pro-drug converted by CYP2D6 enzymes into oxidized metabolites responsible for activity against dormant forms of P.
ovale and P. vivax in the liver. The CYP2D6 enzyme is highly
TABLE 1
Summary of HPLC methods for PQ analysis in biological matrices described in the literature.
Matrices Detector Mobile phase/conditions/LOQ, LOD ng·mL-1 Column Ref
Plasma Urine
DAD-UV MeOH: H2O (50:50, v:v), with 1% triethylamine/isocratic; low rate 3mL.min-1/
LOQ = 500; detection limit not described. Rad-Pack modiied-silica-phenyl column 12
Plasma DAD-UV Mobile phase composed of (A) methanol and a (B) buffer of orthophosphoric acid (0.57%), sodium hydroxide (0.087M), and triethylamine (0.13mM); pH 2.70 (orthophosphoric acid)/ gradient: initial with 30% (A), increasing to 62.8% in 8 min, then 80% (A) between 10 min and 12 min, then decreasing to 30% (A) between 12 min and 14.5 min, and inally remaining constant at 30% until 24 min.; low rate 1mL·min-1/PV = 500mL/LOQ = 45.5nM; LOD = 0.89nM.
Hypersil-C18 (250mm × 4.6mm × 5μm)
13
Plasma DAD-UV (A) 50mM Ammonium acetate buffer (pH 6.0); (B) Acetonitrile + DMOA/ gradient elution: initially 55% A and then 90% in 15 min (hold for 2 min); then decrease to 55% in 2 min; low rate 1mL.min-1/PV = 500mL/LOQ = 20; LOD
= 10.
Spheri-5-Ciano (220mm × 4.6mm × 5μm)
14
Plasma Blood cells
DAD-UV Acetonitrile: MeOH: perchloric acid: H2O (30:9:1:95, v:v)/ isocratic; low rate
1.5mL.min-1/PV = 500mL/LOQ and LOD not described.
Bondapak-C18 (300mm × 3.9mm × 5μm)
15
Serum DAD-UV Acetonitrile: potassium hydrogen phosphate buffer (pH 6.0): THF (60:39:1, v:v), with 0.5mL.L-1 of DMOA/isocratic; low rate 0.7mL.min-1/PV = 500mL/
LOQ = 10; LOD = not described.
C18
(100mm × 4.6mm × 5μm) 16
Plasma MS/MS MeOH: H2O (80: 20, v:v) with 0.1% of formic acid/ isocratic; low rate 0.25 mL·min-1/ PV = 500mL/LOQ = 2; LOD = 1.
Luna C18 (100mm × 4.6mm × 3μm)
17
Plasma ECD 70mM Potassium hydrogen phosphate buffer (pH 5.8): 10mg.mL-1 Na 2EDTA:
acetonitrile (74.5:25.5:5; v:v)/ isocratic; low rate 1.0mL.min-1/ PV = 500mL/
LOQ and LOD not described.
Shodex ODSpak-C18 (250mm × 4.6mm × 5μm)
18
Plasma MS/MS 20mM Acetonitrile: ammonium acetate (pH 6.0) (50:50; v:v)/ isocratic; low rate
1.0mL.min-1/PV = 100mL/ LOQ = 3.91; LOD = 2. LC-LC - Shiperi – Ciano, two connected columns
(30mm × 4.6mm × 5μm) 19
HPLC: high performance liquid chromatography; LOQ: limit of quantiication; LOD: limit of detection; DAD-UV: diode array detector--ultraviolet; PV: plasma
volume; DMOA:N`N`-dimethyloctylamine; Condition: isocratic or gradient and low rate; MeOH: methanol; H2O: water; MS/MS: tandem mass spectrometry; ECD: electron capture detector; Na2EDTA: disodium ethylenediaminetetraacetate dihydrate; LC-LC: two-dimensional liquid chromatography.
essential to monitor drug levels in patients under treatment and to study the kinetics of this antimalarial agent in animal models.
Table 1 summarizes the main characteristics of
high-performance liquid chromatography (HPLC) methods for the analysis of PQ in biological matrices (such as whole blood, serum, plasma, liver tissues, and blood cells) published to date. Most methods for PQ analysis in plasma involve a liquid-liquid extraction procedure followed by protein precipitation (PP), and some use solid phase extraction (SPE) or a combination of liquid-liquid extraction and SPE procedures. PQ recovery rates are generally higher when PP and SPE techniques are used. As shown in Table 1, the mobile phases differ among
existing methods. A combination of organic solvents (methanol or acetonitrile) with water (acid/basic or neutral) or a buffer solution is generally used and organic modiiers are often added. Isocratic elution is the most common mode, but some methods
employ the more time-consuming gradient mode of elution. With respect to the stationary phase, most methods use reversed phase C18 columns with different lengths, internal diameters, and particle sizes, while a few methods employ other silica-modiied stationary phases, such as phenyl and cyanopropyl. All methods require large sample volumes (≈500µL of plasma), thereby limiting their use in studies of small rodents, such as mice and hamsters (Table 1)12-19. The long retention
times of PQ imply relatively long analysis times (≥8 min) for these chromatographic methods. Moreover, the detection and quantiication limits using a DAD-UV detector are high.
Owing to the limitations of existing methods (Table 1), we
METHODS
Reagents
All chemicals were of analytical reagent grade or a higher purity. HPLC-grade methanol and acetonitrile were purchased from Tedia (Rio de Janeiro, Brazil) and Lichrosolv ultrapure acetonitrile was used to evaluate robustness (CAS 75-05-8; Merck Millipore, Darmstadt, Germany). Ammonium acetate (CAS 631-61-8, CH3COONH4), zinc sulfate heptahydrate (ZnSO4·7H2O), and acetic acid (CAS 64-19-7, CH3COOH) were obtained from Merck Millipore. PQ diphosphate standard was supplied by Genix
Indústria Farmacêutica Ltda (PP3016PQRJ, 98-102%; Anápolis,
Brazil). Sodium heparin (5,000IU/mL-1) was purchased from Hipolabor (Belo Horizonte, Brazil). Ultrapure water was provided daily by a Milli-Q purifying water system (Merck-Millipore).
Solutions
Aqueous solutions of PQ diphosphate, equivalent to 200μg.mL-1 PQ base, were prepared by dissolving 17.6mg of the salt in ultrapure water to a inal volume of 50mL. Stock solutions were kept in amber lasks stored at -20°C. Under these storage conditions, PQ is stable for at least 7 days (as determined by the signal area of a standard solution in an HPLC-DAD-UV analysis). The working solutions were prepared daily by serial dilution of the stock solution. Ammonium acetate buffer (10mM) was prepared by dissolving 0.77g of ammonium acetate in 1L of ultrapure water. The solution pH was adjusted to 3.8 using a 10% w/v acetic acid solution.
Animals
Quantitative analyses of PQ using the new method were performed with blood plasma samples obtained from female DBA-2 mice. Animals were supplied by the Oswaldo Cruz Foundation Central Animal House (CECAL-FIOCRUZ, Rio de Janeiro, Brazil) and were 7 weeks of age when they arrived at the laboratory. All mice were housed in standard mouse plastic cages with stainless steel lids and white Pinus wood shavings
as bedding (5 mice per cage). Animal cages were kept under controlled environmental conditions (22 ± 2°C, approximately 70% relative humidity, and a 12-h light/dark cycle with lights on at 8 a.m.) and were provided ad libitum access to iltered tap
water and a commercially available pelleted food for rats and mice (Nuvital; Nuvilab, Curitiba, PR, Brazil).
Ethical considerations
The experimental protocol was approved by the Ethics Committee on Animal Use of FIOCRUZ (2012, P-84/10-7).
Treatment
Mice (n = 6) were treated with freshly prepared PQ solutions in ultrapure water (2mg of PQ base·mL-1 equivalent to 3.551mg of PQ diphosphate·mL-1). PQ concentrations are expressed in terms of PQ base per mL-1. Aqueous solutions of PQ were kept under refrigeration (4°C) and protected from light until use within 24h of preparation. PQ diphosphate dissolved in water was administered by was administered by oral gavage at doses equivalent to 20mg PQ·kg-1. Heparinized mouse blood samples
were collected by cardiac puncture 15, 30, 60 and 90min after PQ administration.
Plasma samples
Plasma was separated from the heparinized whole blood by centrifugation at 12,000 rcf for 15 min. After separation, plasma samples were immediately transferred to Eppendorf tubes and stored at -20°C until analyses, which were carried out within 7 days of PQ administration.
PQ extraction procedure
Owing to its simplicity and low cost, PP followed by drug extraction from the plasma was used. PP conditions were empirically optimized and standardized as follows. Samples of 50µL of plasma were transferred to 1.5-mL Eppendorf® vials into which 50 µL of acetonitrile acidiied with 2% acetic acid (w/v) was added. The tubes containing plasma plus acetonitrile were carefully vortexed, avoiding any contact of the mixture with the tube tip, for 30 sec. Then, 25µL of an aqueous 12.5% zinc sulfate solution (w/v) was added to each tube, followed by vortexing for 30 sec. The suspension was then allowed to stand for 30 min for full precipitation of the plasma protein. The tubes were then centrifuged at 12,000 rcf for 15 min and the supernatant was analyzed by HPLC-DAD-UV.
Equipment and chromatographic conditions
Analyses were performed by HPLC-DAD-UV using the Shimadzu Class-VP (liquid chromatographer coupled to a Shimadzu UV detector with the diode array SPD M10A VP equipped with a SCL 10A VP controller, DGU14A degasser, 10ADVP LC binary pump, CTO 10ASVP oven, and SIL10AF auto injector). The chromatograms were evaluated using Shimadzu Class VP® software, version 6.1. Various combinations of acetonitrile, methanol, and ammonium acetate buffer were used as mobile phases. All buffer solutions were iltered through a 0.45-μm pore PVDF ilter (Merck-Millipore) before use. HPLC columns were silica-based C18 (250mm × 4.6mm i.d. × 5μm, ODS Hypersil, Thermo, Waltham, MA, USA) and modiied-silica cyanopropyl (250mm × 4.6mm i.d. × 5μm, Supelcosil LC-CN; Supelco, St. Louis, MO, USA). The injection volume was 20μL for all analyses.
Validation
using standard solutions of PQ in ultrapure water. Linearity was evaluated by three calibration curves obtained on three distinct days. Selectivity was determined in an analysis with blank mouse plasma and with mouse plasma spiked with a PQ solution of 250ng.mL-1. Differences between experimental and estimated values obtained by itting a linear model to calibration data were used to determine homoscedasticity. Intra-day precision was evaluated for ive different PQ concentrations (13, 100, 250, 500, and 2,000ng.mL-1) assayed in triplicate three times during a single day. Inter-day precision was evaluated at these ive concentrations determined in triplicate once a day on three distinct days. Accuracy was assessed using calibration curves (13, 100, 250, 500, and 2,000ng.mL-1) according to the following formula: accuracy = (EAVR/TC) × 100, where EAVR is the experimental average and TC is the theoretical concentration. Recovery was determined for spikes of high, intermediate, and low concentrations of PQ (250, 500, and 1,000ng.mL-1, (Table 2) respectively). Robustness was determined using
Youden’s test with seven chromatographic variables: buffer concentration, acetonitrile percentage in the mobile phase, low rate, mobile phase pH, oven temperature, precipitation time, and brand of commercially available acetonitrile (Table 3).
These seven factors were combined in eight random chromatographic experiments (nominal condition + seven variants) performed with a PQ concentration of 500ng.mL-1 (corresponding to an intermediate point along the standard analytical curve)27-29. The limits of detection (LOD) and quantiication (LOQ) were obtained from three calibration curves using the following equations: LOQ = DPa (standard deviation of intercept Y) × 10/IC (curve slope) and LOD = DPa × 3/IC20,21.
Statistical analysis
Data are presented as means ± standard deviation. Differences between two means were analyzed by one-way ANOVA followed by Bonferroni post-hoc tests. Differences
were considered statistically signiicant when p < 0.05. Statistical
analyses were performed using GRAPHPAD PRISM6®.
RESULTS
A new method was developed based on analytical methods in use in the laboratory as well as previously reported HPLC methods for antimalarial drug analysis. We tested the performance of various mixtures of acetonitrile or methanol with acetate buffer as the mobile phase and RP-C18 silica or modified-silica cyanopropyl columns as the stationary phases24-26. Optimal HPLC conditions for the quantiication of PQ in the blood plasma were obtained using a modiied-silica cyanopropyl column (250mm × 4.6mm i.d. × 5μm, Supelcosil LC-CN) and a mixture of acetonitrile and 10mM ammonium acetate buffer (pH = 3.80) (45:55) as the mobile phase. The use of organic modiiers of the mobile phase proved to be unnecessary. The low rate was 1.0mL.min-1, the temperature was 50 °C, and absorbance (UV) was monitored at 264 nm. The new method for the quantiication of PQ in the blood plasma was characterized by a short analysis time (tR = 5.80 ± 0.20 min and
a total analysis time of 7 min), a good signal symmetry (1.14), a
high retention factor (k = 2.15), low detection and quantiication
limits. The selectivity and speciicity of the method were determined by analyses of blank plasma samples and plasma samples spiked with PQ. Figure 1A, Figure 1B and Figure 1C
show (A) the PQ signal from the plasma extract at 5.94 min, (B) blank plasma, and (C) overlapping chromatograms. No interference was detected for the PQ chromatographic window around tR 5.9 min, proving the method selectivity and speciicity
A method for extracting PQ from the plasma was established for 50-µL plasma samples. Full PP was achieved by adding acetonitrile, followed by zinc sulfate (see Methods). The total time required for full PP and PQ extraction was approximately 45 min.
PQ recoveries from plasma spiked with PQ diphosphate (expressed as PQ base) were 89.8 ± 5.1% at 250ng.mL-1, 97.7 ± 1.1% at 500ng.mL-1, and 100.4 ± 4.6% at 1,000ng.mL-1. These results indicated that the extraction method developed for low sample volumes (50µL) was highly eficient, as evidenced by the recovery of 80% or greater added PQ at all tested concentrations20-23.
The HPLC-DAD-UV method for the analysis of PQ in plasma matrices developed in this study was validated for linearity, intra-day and inter-day precision, accuracy, recovery, robustness, and detection and quantification limits (see Methods). The calibration curves obtained in the concentration range of 13 to 2,000ng.mL-1 demonstrated excellent linearity (r = 0.9997 ± 0.0003; average and standard-deviation of
three different calibration curves). The difference between experimental and estimated values in the concentration range of 13 to 2,000ng.mL-1 indicated that the distributions of values were homoscedastic. The linear regression equation for PQ quantiication in plasma samples was as follows: concentration = [(absorbance) + 185.58 (± 36.14)]/103.29 (± 0.67). Calculated LOQ and LOD were (see Methods) 3.5 and 1.0ng.
mL-1, respectively. Intra-day and inter-day precision as well
as accuracy are presented in Table 2. Precision and accuracy
values were within an acceptable range (85-115%)20-23. With respect to robustness, the method showed the highest variation in PQ content as a function of the mobile phase pH (13.7%) and, to a lesser degree, as a function of the acetonitrile brand (0.9%) (Table 3).
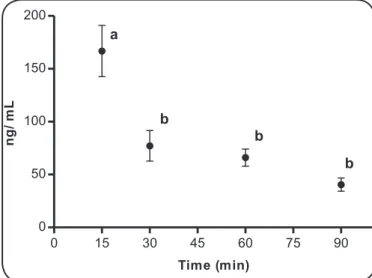
Blood plasma samples from female DBA-2 mice treated with 20mg.kg-1 PQ diphosphate (oral route) were analyzed with the new validated method (Figure 2). PQ content showed a Cmax at
15 min of 154 ± 23ng.mL-1.
DISCUSSION
Previously published HPLC-UV methods for PQ analysis in plasma require large sample volumes (100-500µL) and were developed and validated using human blood plasma (Table 1).
We established a new extraction method that is suitable for PQ analysis in small volumes of plasma, which is consider necessary for studies in small rodents (such as DBA-2 mice), the most frequently used experimental model of blood stage malaria. DBA-2 mice are susceptible to Plasmodium berghei (ANKA)
Precision
PQ concentration (ng.mL-1)
13 100 250 500 2000
Intra-day Average (ng.mL-1)
RSD % Accuracy % 14.7 7.4 113.4 100.9 1.7 100.9 245.0 2.1 98.0 489.8 2.2 98.0 1981.0 0.1 99.1 Inter-day
Average (ng.mL-1)
RSD % Accuracy % 14.2 10.2 109.4 100.4 2.2 100.4 241.7 2.5 96.7 496.8 4.4 99.4 1986.8 0.6 99.3 TABLE 2
Accuracy and precision of the HPLC-DAD-UV method developed for PQ analysis in mouse blood plasma.
HPLC-DAD-UV: high-performance liquid chromatography with diode array ultraviolet detection; PQ: primaquine diphosphate; RSD: relative standard deviation. Minutes
5.2 5.4 5.6 5.8 6.0 6.2 6.4 6.6 6.8 7.0
m AU 0.0 0.5 1.0 1.5 2.0 2.5 m AU 0.0 0.5 1.0 1.5 2.0 2.5
5.
94
1
3: 264 nm, 4 nm Primaquin
primaquine -PL-PQ-250ng
Minutes
5.0 5.2 5.4 5.6 5.8 6.0 6.2 6.4 6.6 6.8 7.0
m AU 0 1 2 3 0 1 2 3 5 .9 41
3: 264 nm, 4 nm Primaquine
primaquine -PL-PQ-250ng
3: 264 nm, 4 nm Primaquin
primaquine -PL-teste
Minutes
5.0 5.2 5.4 5.6 5.8 6.0 6.2 6.4 6.6 6.8 7.0
m AU 0 1 2 3 m A U 0 1 2 3 3: 264 nm, 4 nm
Primaquine primaqui -PL-test
A
B
C
Minutes5.2 5.4 5.6 5.8 6.0 6.2 6.4 6.6 6.8 7.0
m AU 0.0 0.5 1.0 1.5 2.0 2.5 m AU 0.0 0.5 1.0 1.5 2.0 2.5
5.
94
1
3: 264 nm, 4 nm Primaquine
primaqui -PL-PQ-250ng
Minutes
5.0 5.2 5.4 5.6 5.8 6.0 6.2 6.4 6.6 6.8 7.0
m AU 0 1 2 3 0 1 2 3 5. 94 1
3: 264 nm, 4 nm Primaqu
primaqui -PL-PQ-250ng
3: 264 nm, 4 nm Primaquine
primaqui -PL-teste
Minutes
5.0 5.2 5.4 5.6 5.8 6.0 6.2 6.4 6.6 6.8 7.0
m AU 0 1 2 3 m A U 0 1 2 3 3: 264 nm, 4 nm
Primaquin primaquine -PL-test
A
B
C
TABLE 3
Robustness of the HPLC-DAD-UV method for PQ analysis in mouse blood plasma.
Parameters Nominal condition PQ average content ng.mL-1
Variation PQ average content ng.mL-1
Effect
(∆%)
Ammonium acetate Buffer molarity (mM)
10mM 502.6
11mM
536.1 -6.7
Acetonitrile concentration in Mobile phase (% acetonitrile)
45% 497.3
46%
545.7 -9.7
Flow rate (mL.min-1) 1.0 mL.min -1
539.3
1.1 mL.min-1
499.4 7.4
Mobile phase pH 3.8
557.4
4.0
481.3 13.6
Oven temperature (°C) 50°C
517.1
45°C
480.5 7.1
Precipitation time (min) 30 min 514.4
45 min
524.3 -1.9
Acetonitrile brand (®) Tedia®
517.0
Lichrosolv®
521.7 -0.9
HPLC-DAD-UV: high-performance liquid chromatography with diode array ultraviolet detection; PQ: primaquine diphosphate.
severe and lethal malaria and to screen novel effective and safe antimalarial agents1,2. Furthermore, the extraction procedure is simple because it does not require solid phase extraction, the total analysis time is short (7 min), the mobile phase includes ultrapure water buffer and acetonitrile, without requiring organic modiiers. It is fair to assume that the method is more cost-effective than standard analytical methods used for PQ determination in blood plasma (Table 1).
The observed LOQ and LOD (3.5 and 1.0ng.mL-1, respectively) were very low, since a UV detector was used. In fact, LOQs reported in the literature12-14, 16-18 for PQ analyses using HPLC-UV are up to 10ng.mL-1. The excellent signal symmetry and linearity across a range of concentrations obtained using the new method led to markedly lower LOQ and LOD estimates than those previously reported for similar HPLC methods for PQ.
With respect to robustness, variation ranged from 0.9% (acetonitrile brand) to 13.7% (mobile phase pH). Nevertheless, analytical determination of the PQ content was not altered substantially by variation in any of seven tested parameters (variation < 15%) (Table 3), thereby demonstrating that the
method is reasonably robust20-23. Analyses of female DBA-2 blood plasma in triplicate resulted in less than 5% relative standard deviation, demonstrating that drug plasma extraction and analysis are effective and reproducible.
0 15 30 45 60 75 90
0 50 100 150 200
a
b
b
b
Time (min)
n
g
/
m
L
FIGURE 2 - PQ concentration (means ± standard deviation) in DBA-2 plasma
after oral administration. Mean values with different letters are signiicantly different (p < 0.05). PQ: primaquine diphosphate;
models for the study of malaria. This new method exhibits good selectivity, linearity, intra-day and inter-day precision, robustness, accuracy, and recovery. Additional advantages of the analytical method over similar, existing HPLC-UV methods include a comparatively shorter analysis time, the use of smaller volumes of plasma, and lower LOD and LOQs.
Financial support
Authors thank Conselho Nacional de Desenvolvimento Cientíico e Tecnológico CNPq and Fundação de Amparo à Pesquisa do Estado do Rio de Janeiro (FAPERJ) for inancial support.
Conlict of interest
The authors declare that there is no conlict of interest.
REFERENCES
1. Vale N, Moreira R, Gomes P. Primaquine revisited six decades after its discovery. Eur J Med Chem. 2009;44(3):937-53.
2. Hill DR, Baird JK, Parise ME, Lewis LS, Ryan ET, Magill AJ. Primaquine: report from CDC expert meeting on malaria chemoprophylaxis I. Am J Trop Med Hyg. 2006;75(3):402-15. 3. Li Q, O’Neil M, Xie L, Caridha D, Zeng Q, Zhang J, et al. Assessment
of the prophylactic activity and pharmacokinetic proile of oral tafenoquine compared to primaquine for inhibition of liver stage malaria infections. Malar J. 2014;13(1):141.
4. Brito MAM, Peixoto HM, Almeida ACG, Oliveira MRF, Romero GAS, Moura-Neto JP, et al. Validation of the rapid test Carestart(™) G6PD among malaria vivax-infected subjects in the Brazilian Amazon. Rev Soc Bras Med Trop. 2016;49(4):446-55.
5. Bolchoz LJ, Budinsky RA, McMillan DC, Jollow DJ. Primaquine-induced hemolytic anemia: formation and hemotoxicity of the arylhydroxylamine metabolite 6-methoxy-8-hydroxylaminoquinoline. J Pharmacol Exp Ther. 2001;97(2):509-15.
6. Silva MCM, Santos EB, Costa EG, S Filho MG, Guerreiro JF, Póvoa
MM. Alteraç̃es clínicolaboratoriais em pacientes com malária por
Plasmodium vivax e deiciência de glicose-6-fosfato desidrogenase
tratados com 0,50mg/kg/dia de primaquina. Rev Soc Bras Med Trop. 2004;37(3):215-17.
7. Constantino L, Paixao P, Moreira R, Portela MJ, Do Rosario VE, Iley J. Metabolism of primaquine by liver homogenate fractions: evidence for monoamine oxidase and cytochrome P450 involvement in the oxidative deamination of primaquine to carboxyprimaquine. Exp Toxicol Pathol. 1999;51(4-5):299-303.
8. Ganesan S, Tekwani BL, Sahu R, Tripathi LM, Walker LA. Cytochrome P450 - dependent toxic effects of primaquine on human erythrocytes. Toxicol Appl Pharmacol. 2009;241(1):14-22.
9. Pybus BS, Sousa JC, Jin X, Ferguson JA, Christian RE, Barnhart R, et al. CYP450 phenotyping and accurate mass identiication of metabolites of the 8-aminoquinoline, anti-malarial drug primaquine. Malar J. 2012;11:259.
10. Pybus BS, Marcsisin SR, Jin X, Deye G, Sousa JC, Li Q, et al. The metabolism of primaquine to its active metabolite is dependent on CYP 2D6. Malar J. 2013;12:212.
11. Santos JB, Luz FCO, Deckers FAL, Tauil PL. Subdoses of primaquine in overweight patients and malaria vivax relapses: report of two cases in the Federal District, Brazil. Rev Soc Bras Med Trop. 2010;43(6):749-50.
12. Mihaly GW, Ward SA, Edwards G, Orme ML, Breckenridge AM. Pharmacokinetics of primaquine in man: identiication of the
carboxylic acid derivative as a major plasma metabolite. Br J Clin Pharmacol. 1984;17(4):441-6.
13. Zuluaga-Idárraga L, Yepes-Jiménez N, López-Córdoba C, Blair-Trujillo S. Validation of a method for the simultaneous quantiication of chloroquine, desethylchloroquine and primaquine in plasma by HPLC-DAD. J Pharm Biomed Anal. 2014;95:200-6.
14. Lal J, Mehrotra N, Gupta RC. Analysis and pharmacokinetics of bulaquine and its major metabolite primaquine in rabbits using an LC-UV method- a pilot study. J Pharm Biomed Anal. 2003;32(1):141-50. 15. Dua VK, Kar PK, Sarin R, Sharma VP. High-performance
liquid chromatographic determination of primaquine and carboxyprimaquine concentrations in plasma and blood cells in Plasmodium vivax malaria cases following chronic dosage with primaquine. J Chromatogr B Biomed Appl. 1996;675(1):93-8. 16. Paliwal JK, Gupta RC, Grover PK. Simultaneous determination of
a new antimalarial agent, CDRI compound 80/53, and its metabolite primaquine in serum by high-performance liquid chromatography. J Chromatogr B Biomed Sci Appl. 1993;616(1):155-60.
17. Page-Sharp M, Ilett KF, Betuela I, Davis TM, Batty KT. Simultaneous determination of primaquine and carboxyprimaquine in plasma using solid phase extraction and LC-MS assay. J Chromatogr B Analyt Technol Biomed Life Sci. 2012;902:142-6. 18. Kim YR, Kuh HJ, Kim MY, Kim YS, Chung WC, Kim SI, et al.
Pharmacokinetics of primaquine and carboxyprimaquine in Korean patients with vivax malaria. Arch Pharm Res. 2004;27(5):576-80. 19. Nitin M, Rajinikanth M, Lal J, Madhusudanan KP, Gupta RC.
Liquid chromatography-tandem mass spectrometric assay with a novel method of quantitation for the simultaneous determination of bulaquine and its metabolite, primaquine, in monkey plasma. J Chromatogr B: Analyt Technol Biomed Life Sci .2003. 793(2);253-63. 20. Ministério da Saúde. Agência Nacional de Vigilância Sanitária. Resolução n° 899, de 29 de maio de 2003. Guia para validação de métodos analíticos e bioanalíticos. Brasília: Diário Oicial da União 02 jun 2003.
21. Instituto Nacional de Metrologia, Normalização e Qualidade e Tecnologia. DOQ-CGCRE-008 - Orientação sobre Validação de Métodos de Ensaios Químicos. Revisão 02, 2007. 25p.
22. International Conference on Harmonization (ICH) of Technical Requirements for the Registration of Pharmaceuticals for Human Use. Validation of Analytical Procedures: Text and Methodology - ICH-Q2A, Geneva: 1995. 17p.
23. International Conference on Harmonization (ICH) of Technical Requirements for the Registration of Pharmaceuticals for Human Use. Validation of Analytical Procedures: Text and Methodology - ICH-2B, Geneva; 1996. 15p.
24. Susin C. Basic statistical analysis for dental research. In: Rode SM, Dias KRHC, França CM. Handbook of scientiic methodology. IADR latinoamericana; 2009.
25. Snyder LR, Kirkland JJ, Glajch JL. Practical HPLC Method Development. 2nd edition, New York: Wiley-Interscience; 1997. 800p. 26. Ahuja S, Dong MW. Handbook of Pharmaceutical Analysis by
HPLC. 1st edition. vol. 6, London: Elsevier; 2005. 600p.
27. César IC, Pianetti GA. Robustness evaluation of the chromatographic method for the quantitation of lumefantrine using Youden´s test. Braz J Pharm Sci. 2009;45(2):235-40.
28. Youden WJ, Steiner EH. Statistical Manual of Association of Oficial Analytical Chemistry (AOAC). Washington: AOAC; 1975. 88 p.