Article
Kinetic Analysis of the Chemical Processes in the Decomposition of Gaseous
Dielectrics by a Non-Equilibrium Plasma - Part 2: SF
6and SF
6/O
2.
Glauco F. Bauerfeldt and Graciela Arbilla*
Departamento de Físico-Química, Instituto de Química, Universidade Federal do Rio de Janeiro, Sala 408, CT Bloco A, Cidade Universitária, 21949-900, Rio de Janeiro - RJ, Brazil
Neste trabalho é realizada a simulação numérica da decomposição em fase gasosa de SF6 e
misturas de SF6/O2, na presença de silício. São determinadas as velocidades relativas dos processos
individuais, o efeito da incerteza dos parâmetros e os coeficientes de sensibilidade. Os resultados são comparados com dados experimentais encontrados na literatura e resultados calculados previamente para a corrosão do silício, a fim de ajustar os parâmetros do modelo. À semelhança do que acontece com o CF4, o principal agente de corrosão é o flúor atômico e a concentração das
principais espécies envolvidas depende da composição da mistura. A forma das curvas de sensibilidade segue o formato geral das curvas que representam a velocidade dos processos individuais e a relação entre os coeficientes de sensibilidade calculados para as diferentes etapas de reação é uma medida da contribuição de cada uma ao processo total.
In this work, a numerical modelling analysis of the gas-phase decomposition of pure SF6 and
SF6/O2 mixtures, in the presence of silicon was performed. The relative rate of individual processes,
the effect of the parameters uncertainties and the sensitivity coefficients were determined. The results were compared with literature experimental data for the plasma etching of silicon and with previous simulated results to adjust the model parameters. As in the CF4 system, the main etching
agent is atomic fluorine and the concentration of the major species depends on the composition of the mixture. The shape of the sensitivity curves follows the general shape of the individual rate curves and the ratio between the calculated sensitivity coefficients is closely related to the contribution of each reaction.
Keywords: sensitivity analysis, rate of production analysis, SF6 decomposition
*e-mail: [email protected]
Introduction
In a previous paper, the plasma chemistry of pure CF4
and CF4/O2 mixtures has been studied1 . As discussed in
that work, models for the plasma chemistry of SF6/O2 and
CF4/O2 mixtures have been extensively investigated by
dif-ferent research groups2-19. These processes are extremely
complex to be modelled and solved, considering all the ho-mogeneous processes in the gas phase and the heteroge-neous processes occurring at the gas-solid interface20.
In this work, as explained in more detail in Reference 1, the numerical integration is used to obtain a good understand-ing of the main chemical processes in the gaseous phase and to estimate the relative importance of individual reactions and the sensitivity coefficients Sij for the species (i) towards the
model parameters (λj ). In solving the chemical sub-model,
the other processes are considered in a parameterised, sim-plified way. Although limited, this approach enables the analy-sis of the chemical system without the need of invoking the steady-state approximation and provides information about the key processes.
Formulation of the Models
The model of Ryan and Plumb14, as well as kinetic data
of Ryan11, Kopalidis and Jorné17 and Khairallah et al.18,
were used as a basis for the present kinetic scheme. Since the main goal of this study was the sensitivity and rate of production analysis21, only slight modifications were made
in the previous proposed models. The model was discussed by Bauerfeldt and Arbilla19.
Experimental data from Smolinsky and Flamm22, for
CF4/O2 mixtures, were used to choose the boundary
condi-tions. In that work, the total gas number density was 1.6 × 10¹⁶
13.56 MHz discharge. These conditions are not exactly the same as those of the experiments of d’Agostino and Flamm23. In their work, the SF6/O2 mixtures at a total gas
number density of 3.0 × 1016 cm-3 (1.0 Torr) in a 5 cm
length aluminium tube with 27 ccSTP/min flow rate, were excited by a 45 W, 27 MHz discharge. The analysis of the stable products was performed by infrared spectroscopy/ gas chromatography and gas chromatography/mass spec-trometry. Oxygen and fluorine atoms were observed by emission spectroscopy. Nevertheless, the conditions of the work of Smolinsky and Flamm22, for CF4/O2, were
pre-ferred in order to compare the present simulation with the results of Part 11.
Further details on the formulation of this sub-model can be found in our previous papers1,19.
The Numerical Method
The differential equations were solved using the Runge-Kutta-4-Semi-Implicit Method24 as implemented in the
ki-netic program KINAL25. The kinetic results were analysed
by comparing the relative importance of each reaction, in other words, by calculating the contribution of each step to the total rate of concentration change for each specie. The sensitivity coefficients26 were calculated by the
Di-rect Decomposed Method27 in order to estimate the effect
of parameters’ uncertainties on the predicted concentra-tions. Since some of the parameters and coefficients, such as electron number density, branching ratios and hetero-geneous reaction rate constants, are very difficult to evalu-ate, an additional test was done by changing some of the parameters within their range of uncertainty.
Results and Discussion
Pure SF6
The chemical model for the SF6 and SF6/O2 plasmas
used in the etching of silicon was studied previously in our laboratory19. This model consists of a set of dissociation,
gas phase recombination, and solid phase association (sur-face adsorption, reaction and further desorption) reactions. The complete reaction set and boundary conditions may be found in our earlier paper19, as well as the results for
the kinetic simulation. An initial relevance analysis was also performed in that work. Initial conditions for the simu-lation are listed in Table 1 and are the same as used in reference 19.
As in our previous work on CF4 and CF4/O2 systems1
and, also, as considered by other authors14, we assumed that
a negligible loss of free radicals occurs at the walls. The reaction set model and the general approach were very simi-lar to that of pure CF4 system1.
The experimental results of d’Agostino and Flamm23
were used for comparison. Evidences from other experi-mental works7,11,17,18 were taken into account.
The SF6 dissociation may be assumed to occur by the
following set of reactions:
e- + SF6 → e- + SF5 + F (1)
e- + SF5 → e- + SF4 + F (2)
e- + SF4 → e- + SF3 + F (3)
e- + SF3 → e- + SF2 + F (4)
e-+ SF2 → e- + SF+ F (5)
e- + SF→ e- + S + F (6)
The experimental evidence of several publications28,29
suggests that SF6 breaks down to SF2 very fast, on a time
scale that is short with respect to that required for further reaction of the dissociation fragments. So, Ryan and Plumb14 considered the production of SF2 as a “direct”
process, within the framework of their model:
e- + SF6 → e- + SF2 + 4F (7)
The rate for reaction 7 was calculated by scaling the experimental value of Phelps and Van Brunt30, to fit the
data of d’Agostino and Flamm23. The other possibility is
to consider, in an explicit way, each of the dissociation steps (reactions 1 to 4)17. A good description of the
sys-tem is obtained using the dissociation rate of reference 30, for reaction 1 in combination with the estimated electron density for the experiments of reference 23, and consider-ing reactions 2 to 4 to be fast enough so that the primary process (reaction 1) becomes the determinant step.
Both possibilities were considered in these simulations. In a first approach, k7, was set as 28 s-1 and k1 was set as zero,
kj being the rate constant for reaction j. In a second approach
k1 was set as 56 s-1, k7 was set as zero and k2 to k6 were set an
order of magnitude higher than k1. The integration of the rate
equations shows that the results for F atom in the plasma re-gion differ in about 7% and the values for the SF6 loss differ
in less than 3%. So, the comparison of modelling results with experimental data of etching rate and of SF6 conversion would
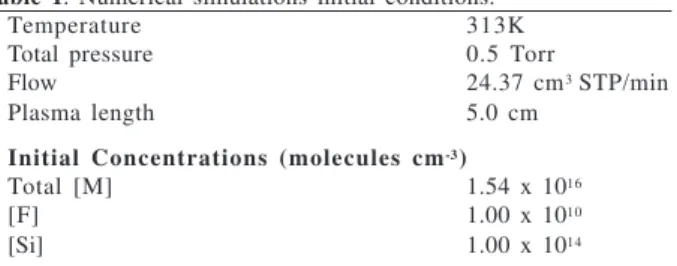
Table 1. Numerical simulations initial conditions.
Temperature 313K
Total pressure 0.5 Torr
Flow 24.37 cm3 STP/min
Plasma length 5.0 cm
Initial Concentrations (molecules cm-3)
Total [M] 1.54 x 10¹⁶
[F] 1.00 x 10¹⁰
not give insight to this point. The main differences are ob-tained for the SF2 and SF5 concentrations. Considering that
the primary dissociation occurs by reaction 1, the SF5
con-centration is 1.8 times higher and the SF2 concentration is
one order of magnitude lower. We interpret these results as an indication of the need to determine the intermediates concen-tration in the experimental system, in order to choose between one of the previous reaction sequences.
The effect of the electron number density on the mod-elling results was also investigated: a factor of two in this parameter changes the fluorine atom concentration by a factor of about 1.3. The results shown in this work were obtained with an electron number density of 1.0 ×
1010 cm-3 and considering reaction 7 as the main path
of SF6 decomposition.
For the simulation conditions, a residence time of 1.0 × 10⁻³ s is equivalent to a linear distance of 0.22 cm (origin of the plasma region) and a residence time of 2.25 × 10⁻² s is equivalent to 4.98 cm (end of the plasma
region). The space beyond 5.0 cm, equivalent to a linear time greater than 2.26 × 10⁻² s, is the “afterglow” region,
where the reactive species continue reacting towards equi-librium. Using this time scale, the comparative rates of in-dividual processes for the main gaseous species are dis-played in Table 2. As shown by these results, the species SFx recombine rapidly with F atoms. In fact, in pure SF6, the main reactions of F atoms are with SFx radicals:
SFx + F + M → SFx + 1 + M with x = 1, 2, 3, 4, 5 (8)
The symbol M is used for a non reacting molecule, as usual. The main reactions are with SF2, SF4 and SF5, which take
ac-count for 80%-90% of fluorine consumption, depending on the distance of the discharge origin. The recombination reac-tion to give gaseous F2 represents about 10% in the origin of
the plasma region and less than 8% in the middle of the reactor. Surface reactions are artificially more important in the origin of the plasma region as a consequence of the bound-ary and initial conditions used in the computer simulation. For the selected residence times and initial values of [Si]initial
and [SF6]initial, the number of Si atoms in the surface
de-creases rapidly. If the number of active sites had been con-sidered constant during the whole process, the rate of attack to the surface would be proportional to the fluorine atoms concentration, since the solid phase association reaction:
Si + F → SiF/Si (9)
was considered as the rate determining step.
For pure SF6, the main stable gaseous products are SiF4
and F2. These products are formed by the set of reactions:
SiFx/Si + F → SiFx+1/Si with x = 1, 2, 3 (10)
SiF4/Si → SiF4 (11)
and
2F + M → F2 + M (12)
2F(s) → F2(s) (13)
F2(s) → F2 (14)
Table 2. Contribution of individual reactions to kinetic processes in the plasma region.
Process Rate (particles cm-3 s-1)
Pure SF6 25% O2 / 75% SF6 80% O2 / 20% SF6 Main reactions for SF2 radicals
e + SF6→ e + SF2 + 4F 4.013 x 10+17 2.749 x 10+17 3.832 x 10+16
SF3 + SF3→ SF2 + SF5 2.816 x 10+17 7.604 x 10+16 1.654 x 10+8
SF2 + O(3P) → SOF + F zero -6.168 x 10+16 -3.807 x 10+16
SF2 + F + M → SF3 + M -6.821 x 10+17 -2.908 x 10+17 -2.505 x 10+14
SF2(s) → SF2 3.499 x 10+15 7.535 x 10+14 7.250 x 10+11 Main reactions for SF5 radicals
e + SF6→ SF5 + F + e 4.013 x 10+17 2.749 x 10+17 3.832 x 10+16
SF5 + SF5→ SF6 + SF4 -3.415 x 10+17 -4.573 x 10+16 -3.097 x 10+12
SF5 + F + M → SF6 + M -6.297 x 10+17 -4.561 x 10+17 -4.753 x 10+15
SF4 + F + M → SF5 + M 5.720 x 10+17 2.316 x 10+17 1.949 x 10+13 Main reactions for F atoms
e + SF6→ e + SF5 + F 4.013 x 10+17 2.749 x 10+17 3.832 x 10+16
e + SF6→ SF2 + 4F + e 1.605 x 10+18 1.100 x 10+18 1.533 x 10+17
2F + M → F2 + M -1.891 x 10+17 -7.411 x 10+17 -5.942 x 10+17
e + F2→ e + 2F 2.165 x 10+17 6.347 x 10+17 4.970 x 10+17
SF2 + O(3P) → SOF + F zero 6.168 x 10+16 3.807 x 10+16
SOF + O(3P) → SO
2 + F zero 5.444 x 10+16 3.843 x 10+16
SF4 + F + M → SF5 + M -5.720 x 10+17 -2.316 x 10+17 -1.949 x 10+13
SF3 + F + M → SF4 + M -1.284 x 10+17 -1.321 x 10+17 -1.555 x 10+14
SF2 + F + M → SF3 + M -6.821 x 10+17 -2.908 x 10+17 -2.505 x 10+14
SO2F + F + M → SO2F2 + M zero -5.732 x 10+16 -5.191 x 10+16
The symbols SiFn+1/Si, F(s) and F2(s) indicate adsorbed
species on the surface.
As previously discussed, the recombination reactions of fluorine atoms with the SFx radicals, dominate the
chemis-try in the gaseous phase, limiting the conversion of SF6.
e- + F2à e- + 2F
-6 -5 -4 -3 -2 -1
-16 -14 -12 -10 -8 -6 -4
e- + SF5à e- + SF4 + F e- + SF4à e- + SF3 + F e- + SF3à e- + SF2 + F e- + SF6à e- + SF2 + 4F
lo g S ens it iv it y C oef fi c ie nt
Figure 1. Sensitivity coefficients for atomic fluorine, relative to its production by SFx and F2 dissociation reactions, for the plasma etching of silicon in pure SF6 as a function of time.
-6 -5 -4 -3 -2 -1
-15 -10 -5 0 5 10 15
2F + M à F2 + M
F + Si à SiF/Si
lo g S e n s it iv it y Co e ff ic ie n t
-6 -5 -4 -3 -2 -1
0 2 4 6 8 10 12 14 16 lo g S e ns it iv it y C oef fi c ient
SF5 + F + M à SF6 + M SF4 + F + M à SF5 + M SF3 + F + M à SF4 + M
SF2 + F + M à SF3 + M
a
b
Figure 2. Comparison of sensitivity coefficients for atomic fluorine relative to consumption reactions : production of F2 and SiF(Si) (2a)
and gas phase recombination reactions of SFx radicals (2b), for the
plasma etching of silicon in pure SF6 .
For the SF5 radical the rate of recombination with
fluo-rine atoms is about twice the rate of the self-reaction to give SF6and SF4 radicals. A similar relation is observed
for SF2 radicals.
In Figures 1 - 3, the sensitivity coefficients Sij for the main
species towards the parameters of the model are shown. As for the CF4 plasma, the results stress the conclusions taken up to
now: the shape of the sensitivity curves follows the general shape of the individual rate curves and the ratio between the Sij values is closely related to the contribution of each reaction.
When comparing the SF, j coefficients for the electron impact reactions (Figure 1), it is clear that, in these simu-lations conditions, the degree of products dissociation by electron impact is negligible, that is, the SFx radicals react rapidly with neutral species rather than dissociating to a SFx-1 species plus F atom. Both Table 2 and Figure 2 show that the main sink of atomic fluorine is the molecular gas phase recombination.
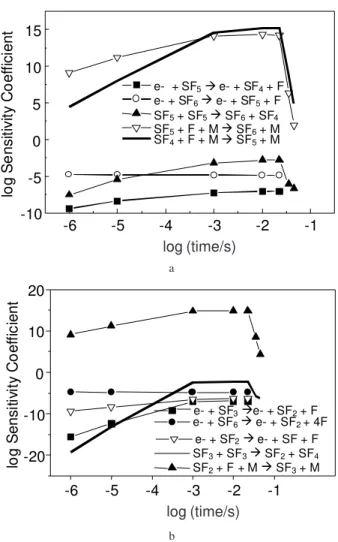
Figures 3a and 3b show the sensitivity coefficients for the main SF5 and SF2 reactions.
-6 -5 -4 -3 -2 -1
-10 -5 0 5 10 15
e- + SF5à e- + SF4 + F e- + SF6à e- + SF5 + F SF5 + SF5à SF6 + SF4 SF5 + F + M à SF6 + M SF4 + F + M à SF5 + M
lo g Se n s it iv it y Co e ff ic ie n t
-6 -5 -4 -3 -2 -1
-20 -10 0 10 20
e- + SF3àe- + SF2 + F e- + SF6à e- + SF2 + 4F
e- + SF2à e- + SF + F SF3 + SF3à SF2 + SF4 SF2 + F + M à SF3 + M
lo g S ens it iv it y C o ef fi c ient a b
Figure 3. Sensitivity coefficients relative to the most relevant
production and consumption reactions for SF5 (3a) and for SF2 (3b) for the plasma etching of silicon in pure SF6 as a function of time.
log (time/s)
log (time/s)
log (time/s)
log (time/s)
By comparing the SSF5,j values (Figure 3a) it is shown that, at the origin of the plasma region the main source of SF5 radicals is the dissociation of SF6, reaction 1. At the
end of the plasma region, recombination reactions become more relevant, mainly the SF4 + F recombination:
SF4 + F + M → SF5 + M (15)
A similar situation arises for SF2 (Figure 3b). The SSF2,j coefficients for the SF6 dissociation, reaction 7, and for
re-action 4, clearly reflects the larger contribution of the former to the formation of SF2 (Figure 3b). Both SSF5, e-+SF6→ e-+SF5+F and SSF2,e-+SF6→e-+SF2+4F coefficients do not de-pend on the distance from the origin, due to the low conver-sion of SF6. Again, at the origin of the plasma region, SF2
radicals are mainly formed by electron impact dissociation reactions. Nevertheless, for larger concentrations of inter-mediate products, the recombination reactions of the other radicals become a rather important source of SF2.
The SSF2and the SSF5coefficients for the gas phase recombination reactions :
SF2 + F + M → SF3 + M (16)
and
SF5 + F + M → SF6 + M (17)
are very similar since the rates for both processes are also very similar and are higher than the coefficients for further electron impact dissociation of SF2 and SF5.
SF6 / O2 Mixtures
The experimental evidences23 show that SO2F2, SOF4
and SO2 appear as the main new products. Also, as O2
concentration increases relatively to SF6 concentration, the
amount of SO2F2 increases relatively to SOF4. These
re-sults were also observed in our previous simulation19.
In the presence of O2, oxygen atoms compete with F
atoms for the SOFx and SFx species. The result is that, in
the presence of O2, the fluorine atom concentration
in-creases up to a maximum value. The further decrease in F concentration with added oxygen is due to dilution and to the decrease of electron energy (the latter causes the SF6
electron dissociation rate to decrease).
Figure 4a shows the sensitivity coefficients for the main atomic fluorine formation reactions. At the origin of the plasma region, dissociation of SF6 is clearly the most
rel-evant process. As the atomic oxygen concentration in-creases, their reactions with SF5 and SF2 to form SOF4 + F
and SOF + F, respectively, become competitive with elec-tron impact dissociation and other SFx reactions.
As in the pure SF6 system, both the individual rates
and the sensitivity coefficients SF are quite similar for the
SFx + F recombination reactions, being the largest
sensi-tivity coefficient found for the gas phase recombination of atomic fluorine with SF5 (Figure 3a), followed by the
co-efficients for the recombination reactions with SF2, SF4
and SF3 (Figure 4b). Since oxygen atoms compete with
fluorine atoms for these radicals, the relative importance of F2 gas phase formation:
2F + M → F2 + M (18)
becomes larger (see Figure 4b and Table 2), being about 40% in the plasma region.
Figures 5a and 5b show the SO2F2 and SOF4
sensi-tivity coefficients, calculated for the main parameters. The sensitivity coefficients confirm that the main path of for-mation of SO2F2 is the reaction with O(3P) atoms:
SOF2 + O → SO2F2 (19)
which is faster than SO2F reaction with F atoms:
SO2F + F + M → SO2F2 + M (20)
-6 -5 -4 -3 -2 -1
-16 -14 -12 -10 -8 -6 -4
e- + SF6à e- + SF5 + F e- + SF6à e- + SF2 + 4F e- + F2à e- + 2F
SF5 + O(3P) à SOF4 + F SF2 + O(3P) à SOF + F
lo
g S
ens
it
iv
it
y
C
oef
fi
c
ient
a
b
-6 -5 -4 -3 -2 -1
-20 -15 -10 -5 0 5 10 15 20
2F + M à F2 + M
SF4 + F + M à SF5 + M
SF3 + F + M à SF4 + M
SF2 + F + M à SF3 + Mk
F à F(s)
lo
g S
ens
it
iv
it
y
C
oef
fi
c
ient
Figure 4. Sensitivity coefficients for atomic fluorine relative to the
most relevant production reactions (4a) and consumption reactions (4b) for the plasma etching of silicon in a mixture 75% SF6 and 25% O2 as a function of time.
log (time/s)
SOF +F + M à SOF2 + M
-6 -5 -4 -3 -2 -1
-65 -60 -55 -50 -45 -40 -35 -30 -25 -20 -15 -10 -5
SOF2 + O(3P) à SO2F2
SF3 + O(3P) à SOF2 + F
SOF2 + F + M à SOF3 + M
log
Sen
sitivi
ty Co
effic
ient
-6 -5 -4 -3 -2 -1
-15 -10 -5 0 5 10 15
SF5 + O(3P) à SOF4 + F
SOF3 + F + M à SOF4 + M
lo
g
Se
n
s
it
iv
it
y
Co
e
ff
ic
ie
n
t
a
b
Figure 5. Sensitivity coefficients relative to the most relevant reactions the production and consumption of SO2F2 (5a) and SOF4
(5b) for the plasma etching of silicon in a mixture 75% SF6 and 25%
O2 as a function of time.
Fluorine and oxygen atoms compete for SOF2, the
second reaction giving SO2F2, being clearly more
im-portant in determining SO2F2 concentration. Reaction
with atomic fluorine:
SOF2 + F + M → SOF3 + M (21)
forms SOF3, which further reacts to give SOF4. The main
paths forming SOF4 are:
SF5 + O(3P) → SOF4 + F (22)
SOF3 + F + M → SOF4 + M (23)
The relative contributions of reaction 23, in compari-son with reaction 22, increases as SOF3 concentration
grows up in the reactor. For the 25% O2 mixture, the
SSOF4,SOF3+F →SOF4/M coefficient is higher than the SSOF4,SF5+O(3P) →SOF4+F, confirming that the main path of formation of SOF4 is through the SOF3 + F reaction.
In Figure 6 the rate of formation of gaseous SiF4 as
function of the distance from the discharge origin and the mole percent of O2 in the feed is displayed. A minimum is
0 2 4 6 8 10
0 20 40 60 80 100
0 4 8 12 16
lo
g
( r
at
e of
f
or
m
at
ion of
S
iF 4
)
% O2 Dist
an ce
( cm )
Figure 6. Rate of formation of gaseous SiF4 as a function of the distance from the discharge origin and the mole percent of O2 in the feed.
observed in this surface, which corresponds to nearly 50% of O2 in the afterglow region. From the simulated data,
the atomic fluorine concentration is maximum for 50% of oxygen, so that the rate of etching is also maximum and SiF4 is almost totally formed in the first centimetres of the
reactor. In other conditions, the etching rate is slower and the SiF4 formation is observed through the total length of
the reactor. So, the atomic fluorine is considered the ac-tive etching agent in this modelling, while the primary etch-ing reaction is rate controlletch-ing.
As expected, the concentration of atomic fluorine and the rate of formation of SiF4, in the plasma region, are
higher for the SF6 and SF6/O2 systems than for the CF4
and CF4/O2 systems1b. However, in the afterglow region,
the inverse is observed, mainly because the recombina-tion of F atoms with the SFx radicals is faster than the
reactions with CF3 and CF2. For the boundary conditions
of these simulations, the final concentrations of SiF4 are
equal because it is limited by the total number of silicon atoms used in the simulation.
Conclusions
The numerical integration of rate equations has been applied to the study of the gas-phase decomposition of pure SF6 and SF6/O2 mixtures in the presence of silicon.
As expected, the results of this computer simulation are in good agreement with previous results from litera-ture and provide complementary information about these systems. The rate of production and the sensitivity analy-sis, as well as the computed concentrations, show that the major features of plasma etching of silicon are explained in terms of the gas-phase reactions.
log (time/s)
log (time/s)
As for the CF4 and CF4/O2 systems, the model was
proposed to reproduce the experimental conclusion that atomic fluorine is the active etching agent. The primary etching reaction appears to be the most significant process and the sequential fluorination reactions have no signifi-cant sensitivities since their rates were purposely chosen not to be rate controlling.
The kinetic analysis shows that many key processes are poorly known and need a better determination. The major uncertainties in the gas phase chemistry are the branching ratios for the primary dissociation processes, the cross sections for electron impact dissociations and the electron number densities.
A more complete model should include a detailed de-scription of the surface chemistry and the transport of radi-cals and ions, which were crudely parameterised in this work. Also, the formulation of such a model must involve the consideration of the energy distribution of particles and temperature gradients, reactions of electronically and vibrationally excited species, positive and negative ions chemistry and polimerization reactions.
Acknowledgements
The authors thank partial financial support from CNPq and FAPERJ. They also thank Prof. T. Turányi (Central Research Institute of Chemistry, Budapest, Hungary) for a free copy of KINAL package and Prof. Gerardo Gerson B. de Souza (DFQ/IQ/UFRJ) for his interest in this project.
References
1. (a) Bauerfeldt, G. F.; Arbilla, G. J. Braz. Chem. Soc. 2000 (in press). (b) Bauerfeldt, G. F.; Arbilla, G. Quím. Nova. 1998, 21, 25.
2. Mogab, C. J.; Adams, A. C.; Flamm, D. L. J. Appl. Phys.1978, 49, 3796.
3. Kushner, M. J. J. Appl. Phys. 1982,53, 2923. 4. Edelson, D.; Flamm, D. L. J. Appl. Phys. 1984, 56, 1522. 5. Plumb, I. C.; Ryan, K. R. Plasma Chem. Plasma
Process. 1986, 6, 205.
6. Ryan, K. R.; Plumb, I. C. Plasma Chem. Plasma Process. 1986, 6, 233.
7. Plumb, I. C.; Ryan, K. R. Plasma Chem. Plasma Process. 1986, 6, 247.
8. Kline, L. E. IEEE Trans. Plasma Sci. 1986, PS-14, 145.
9. Anderson, H. M.; Merson, J. A.; Light, R.W. IEEE Trans. Plasma Sci. 1986, PS-14, 156.
10. Venkatesan, S. P.; Trachtenberg, I.; Edgard, T. F. J. Electrochem. Soc. 1987, 134, 3194 .
11. Ryan, K. R.; Plasma Chem. Plasma Proc. 1989, 9, 483. 12. Economou, D. J.; Park, S. K.; Williams, G. J.
Electro-chem. Soc. 1987, 134, 3194.
13. Venkatesan, S. P.; Edgard, T. F.; Trachtenberg, I. J. Electrochem. Soc. 1989, 136, 2536.
14. Ryan, K. R.; Plumb, I. C. Plasma Chem. and Plasma Process. 1990, 10, 207.
15. Lii, Y. J.; Jorné, J.; Cadien, K. C.; Schoenholtz, Jr., J.E.; J. Electrochem. Soc. 1990, 137, 3633.
16. Park, S. K.; Economou, D. J. J. Electrochem. Soc. 1991, 138, 1499.
17. Kopalidis, P. M.; Jorné, J. J. Electrochem. Soc. 1993, 140, 3037.
18. Khairallah, Y.; Khonsari-Arefi, F.; Amouroux, J. Pure Appl. Chem. 1994, 66, 1353.
19. Bauerfeldt, G. F.; Arbilla, G. Quím. Nova. 1998, 21, 34. 20. (a) Ryan, K. R.; Plumb, I. C. Crit. Rev. Solid State Mater CS 1988, 15, 153. (b) Manos, D. M.; Flamm, D. L. Plasma Etching: An Introduction; Academic Press; San Diego, CA, 1989.
21. Turányi, T. J. Math. Chem. 1990, 5, 203.
22. Smolinsky, G.; Flamm, D. L. J. Appl. Phys. 1979, 50, 4982.
23. d’Agostino, R.; Flamm, D. L. J. Appl. Phys. 1981, 52, 162.
24. Kaps, P.; Rentrop, P. Numer. Math.1979, 33, 55. 25. Turányi, T. Comput. Chem. 1990, 14, 3, 253. 26. (a) Steinfield, J. I.; Francisco, J. S.; Hase, W. L.
Chemical Kinetics and Dynamics; Prentice Hall, Englewood Cliffs; New Jersey, 1989. (b) Pilling, M. J.; Smith, I. W. M. Modern Gas Kinetics. Theory, Experiment and Application; Blackwell Scientific Publications; Oxford, 1987. (c) Hirst, D. M. A Computational Aproach to Chemistry; Blackwell Scientific Publications; Oxford, 1990.
27. Valkó, P.; Vajda, S. Comput. Chem. 1984, 8, 255. 28. Ryan, K. R.; Plumb, I. C. Plasma Chem. Plasma
Proc. 1988, 8, 263.
29. Ryan, K. R.; Plumb, I. C. Plasma Chem. Plasma Proc. 1988, 8, 281.
30. Phelps, A. V.; Van Brunt, R. J. J. Appl. Phys. 1988, 64, 4269.