0103 - 5053 $6.00+0.00
A
r
ti
c
le
* e-mail: [email protected]
Analysis of Pesticide Residues in Brazilian Medicinal Plants: Matrix Solid Phase
Dispersion
versus
Conventional (European Pharmacopoeia) Methods
Vânia G. Zuin, Janete H. Yariwake* and Fernando M. Lanças
Instituto de Química de São Carlos, Universidade de São Paulo, CP 780, 13560-970 São Carlos - SP, Brazil
Neste trabalho é proposto um método baseado na dispersão da matriz em fase sólida (MSPD) para a determinação de resíduos de pesticidas organoclorados (OC) e organofosforados (OP) por cromatografia em fase gasosa com detector de captura de elétrons (HRGC-ECD) em folhas de espécies de Passiflora L. (maracujá). Em confronto com os métodos convencionais, sobretudo
versus o descrito pela Farmacopéia Européia (EP), a MSPD mostrou-se eficiente, rápida, simples e de fácil execução. Até o momento, não existem nem metodologias oficiais e nem limites que considerem a realidade brasileira para a análise de pesticidas em plantas medicinais e medicamentos fitoterápicos em geral, e o método MSPD aqui descrito mostrou ser uma opção viável para a análise de fitoterápicos de Passiflora L.
This paper proposes a method based on matrix solid phase dispersion (MSPD) to determine the presence of organochlorine (OC) and organophosphorus (OP) pesticide residues in species of
Passiflora L. (passion fruit) leaves by gas chromatography, using an electron capture detector (HRGC-ECD). A comparison with conventional methods, mainly the European Pharmacopoeia method (EP), showed MSPD to be efficient, fast, simple and easy to perform. To date, there are no official methods or limits that take into account Brazil’s “real life” conditions in the analysis of pesticides in medicinal plants and phytomedicines, and the MSPD method described herein has proved to be a feasible one for the analysis of Passiflora L-based phytomedicines.
Keywords: Passiflora L., matrix solid phase dispersion (MSPD), HRGC-ECD, organochlorine pesticides, organophosphorus pesticides
Introduction
Scientific advances in the use of medicinal plants and phytomedicines have led to the need for more accurate, faster and more sensitive analytical methods for their analysis. These methods focus mainly on the analysis of active plant compounds with the purpose of standardizing phytomedicines. Most Brazilian medicinal plants are still lacking in analytical studies aimed at their safe use and also their registration as phytomedicines. 1 Therefore, in an earlier
study, we focused systematically on the development of analytical methods based on instrumental chromatographic techniques (HRGC, HPLC, FSCE, GC-MS, LC-MS etc.) to analyze secondary metabolites - mainly terpenoids and flavonoids - from three important Brazilian medicinal plants: “espinheira santa” (Maytenus ilicifolia M. and Maytenus aquifolium M., Celastraceae2-5); “guaco” (Mikania glomerata
Spreng., Compositae6,7) and passion fruit (a popular name
that includes several species of the genus Passiflora L., Passifloraceae8).
Phytomedicinal safety assessments, however, necessarily involve the development of adequate analytical procedures, including the analysis of toxic plant compounds such as the gingkolic acids in Gingko biloba L. (Gingkoaceae) leaf extracts.9 In addition, exogenous toxic compounds such as
pesticide residues should be analyzed in phytopharma-ceuticals.10 With the latter goal in mind, we have also begun
to systematically develop new analytical methods for pesticide residue analyses of phytomedicines, focusing on the multiresidue analysis of pesticides found in Brazilian crops. Passiflora L. was chosen as the first subject, since passion fruit is used both in phytomedicines and in the food industry (passion fruit juice), making contamination by pesticides a strong possibility in “real world” samples. In fact, using modern sample preparation techniques such as SBSE (stir bar sorption extraction)11 and SFE (supercritical
fluid extraction),12 we have been able not only to develop
(SBSE-HRGC and SFE-HRGC), but also to identify pesticide residues into Passiflora L. leaf infusions (aqueous extracts,
popularly known as “teas”) 11 and in leaf samples
commercialized as herbal medicines in Brazil.12
In general, however, most “conventional” methodologies for pesticide analysis of medicinal plants and their products, such as the EP (European Pharmacopoeia) procedure, 13 are
costly, time-consuming and require larger samples and greater volumes of hazardous solvents.10, 14 To overcome
some of the disadvantages associated with the classical solvent extraction of pesticide residues, multiresidue techniques such as MSPD (matrix solid phase dispersion) have been successfully employed.15 The MSPD technique
includes sample homogenization, cellular disruption, exhaustive extraction, fractionation and cleanup by a simple process, in which a small amount of sample (0.1 – 5 g) is blended with the selected solid-phase (such as C18, C8, C2, silica, Florisil or alumina) and the mixture packed into a small chromatographic column. Gravitational elution with an appropriate solvent in this MSPD column usually provides clean extracts. When necessary, further purification can be performed using the so-called “co-columns” (a second column for cleanup, coupled to the first one containing MSPD material. Alternatively, the same column can be filled sequentially with a cleanup material followed by an MSPD one).16,17 Among numerous applications, MSPD in pesticide
analysis has been related almost exclusively to food analysis, e.g. fruits and vegetables, 18-20 soybean oil 21 andmilk.22
However, to the best of our knowledge, there are no reports on the use of MSPD to determine pesticide residues in plant-based drugs (phytomedicines).
Our work focuses on the suitability of MSPD as an alternative method to a conventional, internationally accepted one (European Pharmacopoeia protocol)13 for the
analysis of eleven pesticides: organochlorine pesticides (OC: lindane, hexachlorobenzene, chlorothalonil, tetradifon, α-endosulfan, β-endosulfan and dieldrin) and organophosphorus pesticides (OP: malathion, fenitrothion, parathion-ethyl, parathion-methyl). Some of the pesticides analyzed are widely utilized on Brazilian crops (and may therefore also be found as contaminants in medicinal plants), and most of them are used on commercial passion
fruit crops.11 The MSPD method was optimized and
compared to the modified EP protocol for the determination of pesticides in Passiflora L. samples.
Experimental
Chemicals
All the nanograde solvents were supplied by
Mallinckrodt (Phillipsburg, USA). For the modified EP method, the stationary phase used in gel-permeation chromatography was Bio Beads SX-8 (200 - 400 mesh) supplied by Biorad (Hercules, USA), while the hydrophobic membrane Fluoropore (0.5 µm) was supplied by Millipore (Bedford, USA). The solid-phases and reagents employed for the MSPD procedure were Florisil (60 - 100 mesh) from Supelco (Bellefonte, USA), neutral alumina (60 - 230 mesh, activity I) and anhydrous sodium sulfate from Merck (Darmstadt, Germany). The pesticide standards parathion-ethyl, parathion-methyl, malathion, fenitrothion, α-endosulfan, β-endosulfan, dieldrin, lindane, hexachlorobenzene, tetradifon and chlorothalonil, each with more than 98% purity, were obtained from a variety of suppliers, including Chem Service (West Chester, USA) and Alltech (Deerfield, USA). The three different concentrations of standard analytical solutions that were used to spike the vegetable samples for testing purposes contained, respectively; 0.9 µg of each OP compound and 0.3 µg of each OC pesticide per mL of n-hexane, 0.3 µg of
OP compound and 0.10 µg of OC compound per mL of
n-hexane, 0.15 µg of OP compound and 0.05 µg of each OC compound per mL of n-hexane.
Plant samples
Passiflora alata Dryander and Passiflora edulis Sims. f. flavicarpa Deg. (Passifloraceae) leaf samples were obtained from cultivated specimens grown in Ribeirão Preto, state of São Paulo, Brazil (UNAERP). The plant material was dried at 35 °C for 24 hours, powdered, sieved (1 - 2 mm) and stored away from light and moisture.
Sample preparation
Modified EP method.This procedure was adapted from the method described by the EP.13 10 mL of acetone were
added to 1 g of dried and powdered Passiflora L. leaves. After 20 min maceration at room temperature, the sample was agitated for another 10 min. The solvent was then evaporated and the residue resuspended in approximately 3 mL of toluene. The extract was filtered through a membrane, concentrated to about 0.1 mL and injected into a 40 x 1 cm Bio Beads SX-8 column pressurized with nitrogen to reach a flow rate of 1mL/min, using toluene as mobile phase. The fraction containing all the pesticides was concentrated, diluted to 1 mL with n-hexane and analyzed by high-resolution gas chromatography with an electron capture detector (HRGC-ECD).
gently ground with a pestle in a glass mortar (5 min) until a homogeneous powdered sample was obtained. This mixture was transferred into a column (5 x 1.5 cm) filled with neutral alumina deactivated with 3% H2O (2 g) and anhydrous sodium sulfate (0.5 g). A mixture of nhexane -ethyl acetate solvent 70 : 30 (v/v, 5 mL) was utilized for elution in the column and the resulting extract was concentrated, resuspended with n-hexane (1 mL) and analyzed by HRGC-ECD.
Chromatographic analysis
Modified EP method. The experiments were performed using an HP 5890 series II gas chromatograph equipped with a 63Nielectron capture detector (Palo Alto, USA). A
LM-5 column, 25 m x 0.25 mm i.d., coated with a 0.33 µm film of a cross-linked 5% phenyl methylpolysiloxane stationary phase (L & M, São Carlos, Brazil), was used. A volume of 1 µL of each standard solution or sample extract was injected under the following conditions: injector and detector temperature, 250 °C and 300 °C, respectively; the temperature program was: initial temperature 150 °C, programmed at 4 °C min-1 to 185 °C, held for 3 min, followed
by 12 °C min-1 to 290 °C and held for 1 min. Hydrogen (UP
grade) was used as a carrier gas at a flow rate of 2.0 mL min-1;
nitrogen (UP grade) was used as make up gas at a flow rate of
60 mL min-1 and the injection split ratio was 1:15.
Chromatographic data were collected using an HP 3396-A integrator (Palo Alto, USA). Quantification was performed by the external standard method. The calibration graphs, constructed at concentrations of 0.03 to 0.9 mg of each compound per mL of plant extract, presented a good linearity (r = 0.9932 to 0.9998). The limit of detection (LOD) for the
pesticides determined by ECD varied from 2 ng mL-1
(hexachlorobenzene) to 15 ng mL-1 (malathion).
MSPD method. Analyses were carried out in a Shimadzu 17 A gas chromatograph fitted with a 63Ni electron capture
detector (Shimadzu, Tokyo, Japan). As described for the EP method, a LM-5 column was used (20 m x 0.15 mm x 0.20 mm) and 1 µL of standard solution or extract was injected. The operational conditions were: injector and detector temperature, 250 °C and 300 °C, respectively, the temperature program was: 140 °C, held for 0.5 min, 8 °C min-1 to 210 °C, followed by 12 °C min-1 to 255 °C,
for 3 min. Hydrogen (UP grade) was used as carrier gas at 1.0 mL min-1; nitrogen (UP grade) was used as make up gas
at 50 mL min-1; injection split ratio, 1:10. Chromatographic
data were elaborated using a Work Station Class program. Quantification was performed by the external standard method. The calibration graphs - constructed at same concentrations as described for the EP method - showed a
good linearity (r = 0.9978 to 0.9999). The pesticides’ LOD ranged from 2 ng mL-1 (hexachlorobenzene) to 12 ng mL-1
(malathion).
Results and Discussion
The EP method – the most recent official procedure to determine pesticides in medicinal plants – was adapted and employed as the referential methodology throughout this study. Although the amount of herbal drug employed for the analysis was reduced to about a tenth of the amount suggested by the EP, which was accomplished by reducing the consumption of all the reagents with no loss to the method’s performance, the modified procedure consumed a large amount of reagents and time. Table 1 shows the recoveries (R) and their respective relative standard deviations (RSD) and 95% confidence interval of the mean population (CL) obtained by the modified EP procedure for two Passiflora L. species.
The alternative MSPD-based method was optimized considering the analytical variables: solid phase used as dispersant material (C8, C18, Florisil), the eluant solvent and the solid phase used for the cleanup step. The use of Florisil for the microdispersion of Passiflora L. leaves produced higher recoveries than those obtained with the non-polar solid phases, except for malathion. Moreover, Florisil produced the cleanest chromatographic profiles with lower baselines than those of C8 and C18, a fact that was attributed to the preferential adsorption of polar sample components, interfering with compounds such as pigments and chlorophylls on the Florisil surface. The use of a suitable solvent mixture led to the successful and selective elution of the analytes from the extraction column, retaining a large number of matrix coextracts. In this case, 3 mL of the n-hexane-ethyl acetate mixture (70:30 v/v) proved to be the most suitable eluting condition to reach the highest recoveries. All the MSPD elutions were conducted by gravity flow. With this MSPD extraction procedure, the extracts were generally clear enough to allow for direct chromatographic determination, but higher reproducibilities were achieved when an additional cleanup was performed. The use of neutral alumina for extract cleanup was optimized in a previous study;23 therefore, this material was utilized in the
validated according to the EP criteria, meeting its currently valid regulations.
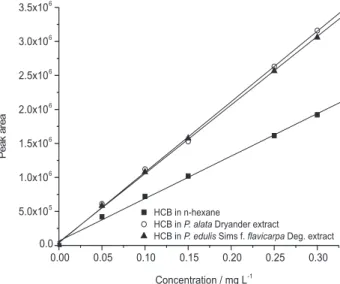
To avoid matrix-induced enhanced GC responses,24
standard pesticide solutions were prepared in hexanic plant extracts, showing suitable quantitative results. The influence of the matrix is illustrated in Figure 2, which shows the behavior of the chromatographic response found for the hexachlorobenzene (HCB) peak when this compound was prepared for calibration graphs in the presence of crude plant extract and in “pure” n-hexane. Thus, all the data listed in Tables 1 and 2 were calculated based on the external standard method and using crude plant extract to prepare the respective calibration curves.
Comparison of methods
The extraction efficiency of MSPD was also compared with that of the EP referential method. Student’s t-test was used to statistically compare the recovery and repeatability data of the two methods (EP and MSPD) for Passiflora L. Figure 1. HRGC-ECD chromatograms of (A) P. alata Dryander
and (B) P. edulis Sims f. flavicarpa Deg. extracts obtained by MSPD method and spiked with 0.1 µg OC and 0.3 µg OP/g sample. 1. hexachlorobenzene, 2. lindane, 3. chlorothalonil, 4. parathion-me-thyl, 5. fenitrothion, 6. malathion, 7. parathion-eparathion-me-thyl, 8. a-endosul-fan, 9. dieldrin, 10. b-endosula-endosul-fan, 11. tetradifon.
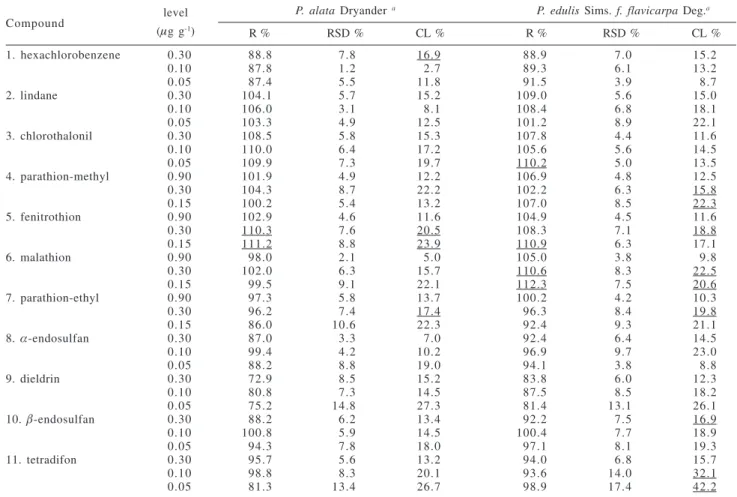
Table 1. Statistical pesticide recovery data from samples of P. alata Dryander and P. edulis Sims. f.flavicarpa Deg. leaves using the modified EP method.
Compound level
P. alata Dryander a P. edulis Sims. f.flavicarpa Deg.a
(µg g-1)
R % RSD % CL % R % RSD % CL %
1. hexachlorobenzene 0.30 88.8 7.8 16.9 88.9 7.0 15.2
0.10 87.8 1.2 2.7 89.3 6.1 13.2
0.05 87.4 5.5 11.8 91.5 3.9 8.7
2. lindane 0.30 104.1 5.7 15.2 109.0 5.6 15.0
0.10 106.0 3.1 8.1 108.4 6.8 18.1
0.05 103.3 4.9 12.5 101.2 8.9 22.1
3. chlorothalonil 0.30 108.5 5.8 15.3 107.8 4.4 11.6
0.10 110.0 6.4 17.2 105.6 5.6 14.5
0.05 109.9 7.3 19.7 110.2 5.0 13.5
4. parathion-methyl 0.90 101.9 4.9 12.2 106.9 4.8 12.5
0.30 104.3 8.7 22.2 102.2 6.3 15.8
0.15 100.2 5.4 13.2 107.0 8.5 22.3
5. fenitrothion 0.90 102.9 4.6 11.6 104.9 4.5 11.6
0.30 110.3 7.6 20.5 108.3 7.1 18.8
0.15 111.2 8.8 23.9 110.9 6.3 17.1
6. malathion 0.90 98.0 2.1 5.0 105.0 3.8 9.8
0.30 102.0 6.3 15.7 110.6 8.3 22.5
0.15 99.5 9.1 22.1 112.3 7.5 20.6
7. parathion-ethyl 0.90 97.3 5.8 13.7 100.2 4.2 10.3
0.30 96.2 7.4 17.4 96.3 8.4 19.8
0.15 86.0 10.6 22.3 92.4 9.3 21.1
8. α-endosulfan 0.30 87.0 3.3 7.0 92.4 6.4 14.5
0.10 99.4 4.2 10.2 96.9 9.7 23.0
0.05 88.2 8.8 19.0 94.1 3.8 8.8
9. dieldrin 0.30 72.9 8.5 15.2 83.8 6.0 12.3
0.10 80.8 7.3 14.5 87.5 8.5 18.2
0.05 75.2 14.8 27.3 81.4 13.1 26.1
10. β-endosulfan 0.30 88.2 6.2 13.4 92.2 7.5 16.9
0.10 100.8 5.9 14.5 100.4 7.7 18.9
0.05 94.3 7.8 18.0 97.1 8.1 19.3
11. tetradifon 0.30 95.7 5.6 13.2 94.0 6.8 15.7
0.10 98.8 8.3 20.1 93.6 14.0 32.1
0.05 81.3 13.4 26.7 98.9 17.4 42.2
Average recovery (R, n=3), relative standard deviation (RSD) and confidence limit (CL, 95 %). a Underlined: results exceeding the maximum
Table 2. Statistical pesticide recovery data from samples of P. alata Dryander and P. edulis Sims. f.flavicarpa Deg. leaves using the MSPD method.
Compound level
P. alata Dryander a P. edulis Sims. f.flavicarpa Deg.a
(µg g-1)
R % RSD % CL % R % RSD % CL %
1. hexachlorobenzene 0.30 106.9 3.0 7.8 94.6 4.3 10.0
0.10 101.7 1.3 3.2 93.4 8.9 20.3
0.05 97.2 6.1 14.5 93.0 10.4 23.8
2. lindane 0.30 100.9 5.1 12.5 75.4 7.7 14.2
0.10 94.9 6.5 15.2 84.6 11.9 24.7
0.05 90.2 12.4 27.4 73.2 18.7 33.6
3. chlorothalonil 0.30 98.1 6.5 15.7 94.8 5.6 13.0
0.10 96.1 8.5 20.1 97.7 5.2 12.5
0.05 90.4 9.1 20.1 88.3 8.2 17.6
4. parathion-methyl 0.90 100.3 6.5 15.9 97.5 2.6 6.1
0.30 100.0 6.7 16.4 98.1 9.6 23.0
0.15 89.2 9.1 19.8 90.2 7.4 16.4
5. fenitrothion 0.90 91.1 5.5 12.3 116.7 3.3 9.6
0.30 97.9 2.1 5.1 108.3 9.4 25.0
0.15 99.6 9.2 22.5 96.1 13.2 31.1
6. malathion 0.90 60.2 9.6 14.2 96.7 5.8 13.7
0.30 83.2 2.9 5.9 93.6 7.6 17.4
0.15 83.7 9.4 19.4 85.7 9.8 20.6
7. parathion-ethyl 0.90 102.0 3.1 7.8 107.7 2.6 6.9
0.30 101.9 1.0 2.5 103.8 4.0 10.3
0.15 95.5 9.1 21.3 100.0 5.7 14.0
8. α-endosulfan 0.30 74.3 8.1 14.7 101.2 10.2 25.2
0.10 97.5 10.1 24.0 90.8 8.3 18.4
0.05 91.2 12.3 27.4 83.4 15.0 30.6
9. dieldrin 0.30 109.7 3.5 9.3 104.1 6.1 15.4
0.10 106.1 1.0 2.7 103.5 9.2 23.3
0.05 95.9 9.4 22.1 90.1 10.8 23.8
10. β-endosulfan 0.30 86.8 7.0 14.9 75.8 1.5 2.7
0.10 86.0 11.7 24.7 80.3 9.6 18.9
0.05 74.6 15.1 27.7 70.6 12.0 20.8
11. tetradifon 0.30 101.4 5.2 13.0 110.7 5.8 15.7
0.10 104.9 4.6 11.8 105.2 12.3 31.6
0.05 105.7 9.5 24.5 116.4 24.7 70.3
Average recovery (R, n=3), relative standard deviation (RSD) and confidence limit (CL, 95%); a Underlined: results exceeding the maximum
limits of recovery and repeatability (EP).
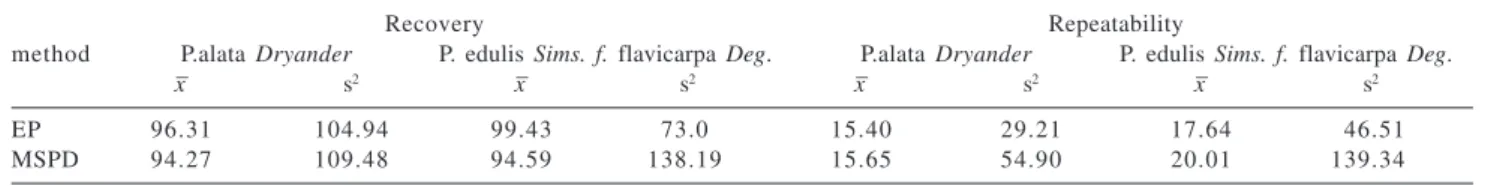
species. This analysis revealed no significant statistical differences between the mean values at the confidence level of 95% (Table 3). Besides its efficiency in pesticide residue analysis being comparable to the EP method, the MSPD method also requires the use of smaller amounts of reagents and less time. The total solvent volume utilized by the MSPD method for each essay was approximately 10 mL, the solid phase materials 4 g and the time 40 min, i.e., respectively 1/7, 1/4 and 1/3 of those consumed in the EP procedure. Furthermore, the MSPD procedure does not require sophisticated instruments or materials, and is an interesting analytical alternative for the majority of pesticide monitoring laboratories in Brazil.
Conclusions
Considering some aspects of the Brazilian reality (i.e., Figure 2. HRGC-ECD calibration curves for HCB prepared in crude
pesticides commonly used and possibly found in “real samples” of medicinal plants, laboratory infrastructure etc.), the MSPD-based method described herein was developed as an alternative to the EP method. This procedure provided analytical results equivalent to the referential EP method, with the advantages of being cheaper, simpler and faster. The proposed procedure may be useful as a screening protocol to identify pesticides in herbal drugs by industrial pharmaceutical and official regulatory laboratories.
Acknowledgements
The authors are grateful to Dr. Ana M. S. Pereira and Ademar Menezes (UNAERP) for providing plant material, and the Brazilian research funding institutions FAPESP, CAPES and CNPq for their financial support and fellowships.
References
1. Pinto, A. C.; Silva, D. H. S.; Bolzani, V. da S.; Lopes, N. P.; Epifanio, R. de A.; Quim. Nova 2002, 25 Supl. 1, 45. 2. Vilegas, J. H. Y.; Lanças, F. M.; Cervi, A.C.; Phytother. Res.
1994, 8, 241.
3. Vilegas, J. H. Y.; Lanças, F. M.; Wauters, J.-N. ; Angenot, L.; Phytochem. Anal. 1998, 9, 263.
4. Cordeiro, P.J.M.; Vilegas, J. H. Y.; Lanças, F. M.; J. Braz.
Chem. Soc.1999, 10, 523.
5. Nossack, A. C.; Vasconcelos, E. C.; Vilegas, J. H. Y.; Lanças, F. M.; Roque, N. F.; Phytochem. Anal. 2000, 11, 243. 6. Vilegas, J. H. Y.; de Marchi, E.; Lanças, F. M.; Phytochem.
Anal. 1997, 8, 74.
7. Celeghini, R. M. S.; Vilegas, J. H. Y.; Lanças, F. M.;. J. Braz.
Chem. Soc.2001, 12, 706.
8. Pereira, C. A. M; Vilegas, J. H. Y.; Rev. Bras. Pl. Med. 2000, 3, 1.
9. Ndjoko, K.; Wolfender, J.-L.; Hostettmann, K.; J. Chromatogr. A2000, 744, 249.
10. Zuin, V. G.; Vilegas, J. H. Y.; Phytother. Res. 2000, 14, 73. 11. Bicchi, C.; Cordero, C.; Iori, C.; Rubiolo, P.; Sandra, P.;
Yariwake, J. H.; Zuin, V. G.; J. Agric. Food Chem.2003, 51, 27.
12. Zuin, V. G.; Yariwake, J. H.; Bicchi, C.; J. Chromatogr. A 2003, 985, 159.
13.European Pharmacopoeia, Conseil de l‘Europe: Strasbourg, 1997.
14. Valenzuela, A. I.; Lorenzini, R.; Redondo, M. J.; Font, G.; J. Chromatogr. A.1999, 839, 101.
15. Barker, S. A.; J. Chromatogr. A.2000, 885, 115.
16. Viana, E.; Moltó, J.C.; Font, G.; J. Chromatogr. A. 1996, 754, 437.
17. Barker, S. A.; J. Chromatogr. A.2000, 880, 63.
18. Dorea, H. S.; Lanças, F. M.; J. Microcol. Sep. 1999, 11, 367. 19. Blasco, C.; Pico, Y.; Manes, J.; Font, G.; J. Chromatogr. A
2002, 947, 227.
20. Kristenson, E. M.; Haverkate, E. G. J.; Slooten, C. J.; Ramos, I.; Vreuls, R. J. J.; Brinkman, U. A. T.; J. Chromatogr. A 2001, 917, 277.
21. Muccio, A.; Pelosi, P.; Barbini, D. A.; Generali, T.; Girolimetti, S.; Stefanelli, P.; Leonelli, A.; Amendola, G.; Vergori, L.; Fresquet, E. V.; J. Chromatogr. A 1999, 833, 19.
22. Yague, C.; Bayarri, S.; Lazaro, R.; Conchello, P.; Arino, A.; Herrera, A.; J. AOAC Int.1998, 81,1023.
23. Zuin, V. G.; Yariwake, J. H.; Lanças, F. M.; Abstracts of the IX
Congreso Latinoamericano de Cromatografia, Cartagena: Colombia, 2002.
24. Kocourek, V.; Hajslova, J.; Holadova, K.; Poutska, J.; J. Chromatogr. A 1998, 800, 297.
Received: October 19, 2002
Published on the web: March 28, 2003
FAPESP helped in meeting the publication costs of this article. Table 3. Comparison of recovery and repeatability results obtained with the EP and MSPD method by Student’s ‘t’ – test (p = 0.05).
Recovery Repeatability
method P.alata Dryander P. edulis Sims. f. flavicarpa Deg. P.alata Dryander P. edulis Sims. f. flavicarpa Deg.
x– s2 x– s2 x– s2 x– s2
EP 96.31 104.94 99.43 73.0 15.40 29.21 17.64 46.51
MSPD 94.27 109.48 94.59 138.19 15.65 54.90 20.01 139.34