0103 - 5053 $6.00+0.00
A
r
ti
c
le
* e-mail: angela@rdc.puc-rio.br
Is Copper an Inhibiting Factor for Primary Production in the Upwelling
Waters of Cabo Frio?
Antônia G. Diniza, Claudia Hamacherb, Angela de L. R. Wagener *,b
and Eliane Gonzalez-Rodriguezc
a
Instituto de Quimica, Universidade Federal Rural do Rio de Janeiro, Antiga Rodovia Rio-São Paulo, km 47, 22851-900 Soropédica - RJ, Brazil
b
Departamento de Quimica, Pontificia Universidade Católica do Rio de Janeiro, R. Marquês de S. Vicente, 225, 22453-900 Rio de Janeiro - RJ, Brazil
c
Instituto Estudos do Mar Almte. Paulo Moreira, Rua Kioto, 253, 28930-000 Arraial do Cabo - RJ, Brazil
O objetivo deste trabalho foi testar a hipótese de que espécies inorgânicas de cobre poderiam atuar como um fator inibidor da produção primária nas águas de ressurgência de Cabo Frio. Para tal, amostras de água foram coletadas de quatro profundidades diferentes em três estações costeiras ao largo de Cabo Frio, nas quais determinou-se a concentração de espécies macronutrientes, pH, oxigênio dissolvido, alcalinidade, concentração de material particulado, clorofila a, produção primária, especiação de cobre (Cu(II) e Cu(I)) e a capacidade de complexação. Os resultados indicam que a taxa de fotossíntese em águas ricas em nutrientes, mas com mais altas concentrações de cobre e baixas capacidades de complexação, são significantemente reduzidas. Cu(I) constituiu de 2 a 15 % do cobre total, embora não se tenham encontrado evidências de que a sua produção fotoquímica afete a produtividade primária.
The goal of the present work was to test the hypothesis that inorganic species of copper may inhibit primary production in upwelling waters from the Cabo Frio region. Water samples were collected from four different depths up to 50 m at three stations of Cabo Frio and nutrient concentration, pH, dissolved oxygen, alkalinity, seston, chlorophyll a, primary production, NPP, copper speciation, Cu(II) and Cu(I) and complexing capacity were determined. The results indicate that the rate of photosynthesis in nutrient rich waters with higher copper content and lower complexing capacity is significantly reduced. Cu(I) made up 2-15% of the total copper, however, there was no evidence to suggest that the photochemical production of Cu(I) affects NPP.
Keywords: primary production, copper speciation, upwelling waters
Introduction
Copper (II) ions1,2 and possibly inorganic copper
complexes3 are powerful inhibitors of phytoplankton
activity even at very low concentrations. Copper (II) ions show a high affinity for ligand sites at the cell membrane and once bound, they block the transfer of other essential ions to the cell.4 The fraction of “free” copper (II) (inorganic species) present in seawater is variable and depends on the availability of organic ligands.
Upwelling ocean waters that resided for long periods well below the photic zone are usually very poor in organic substrates. Although they are rich in macronutrients, the
upwelled waters also carry a load of trace elements as “free” ions, which are able to adversely affect the initiation of
primary production.5-7 As early as 1969, Barber and Ryther4
suggested that the increase in the productivity index observed in upwelled waters that resided longer in the surface (the so-called biological conditioning) should be attributed to the increase in the amount of biogenic organic ligands.
Although more than 30 years have elapsed since the
original hypothesis by Barber5 and co-workers, no
convincing demonstration of organic conditioning of dissolved copper in upwelling waters has been presented to date. However a number of experiments carried out under controlled conditions have been reported to understand
As demonstrated by Moffet and Zika,10 even in organic rich waters, a significant fraction of “free” Cu (II) ions may exist resulting from the photodegradation of organic complexes through the mechanism of ligand-metal charge transfer. This photochemical reaction can occur in the photic zone producing Cu(I) first, which is then re-oxidized to Cu(II). The half time for the reaction is estimated to be larger than 6 h, with decreasing copper complexing capacity due to oxidation of the ligands.
In spite of the recognized influence of the South Atlantic Central Waters (SACW) upwelling on the production of the coastal region of Rio de Janeiro and S.
Paulo (Brazil),11-16 few studies have been conducted on
the chemistry of these nutrient rich waters. Data on metal speciation of the Brazilian coast are non-existent. A survey on trace metal levels was conducted in the 1980’s by
Kremling and Wagener17 along the south coast of the State
of Rio de Janeiro.
The maximum of SACW upwelling occurs at Cabo Frio when east, northeast and north winds displace surface waters allowing the flow of deeper and cooler water masses to the surface. The phenomenon is seasonal (more pronounced in period between September-April) and is characterized
by rapid shifts between upwelling and downwelling.15
Compared to other major upwellings, for instance in western Africa and western South America, the Cabo Frio upwelling is of lesser importance due to the moderate
content of nutrients in the waters (phosphorus: 1 µmol L-1;
nitrogen: 5-10 µmol L-1). However, it exceeds many times
the nutrient concentration in the Brazil Current (nitrate < 1 µmol L-1; phosphate < 0.2 µmol L-1).
In the present work the objective was to test the hypothesis of copper as an inhibitor factor for the primary production in waters of the upwelling region of Cabo Frio.
Experimental
Sampling
Water samples used in the present study were collected on two different occasions. In the first campaign, samples were collected only from 2 stations (stations 1 and 2 described below) out of the three initially planned, and besides the basic physical and chemical data listed below, the total copper (II) concentration was also measured. The stormy sea on this occasion coupled with the poor conditions on board the ship Miguel dos Santos hindered more complex sampling manipulations. In the second sampling the Astro Garoupa ship equipped with an appropriate container for advanced chemical work was
utilized and samplings occurred at three planned stations (station 1: 23o01’12” S/42o00’56” W; station 2: 23o02’00” S/ 42o00’28” W; station 3: 23o04’48” S/ 42o00’18” W). Water samples were collected from 5 m, 20 m, 30 m and 50 m depth by using pre-cleaned Teflon coated 5 L Go-Flo sampling bottles and a polyethylene coated cable. Sampling depths were selected to include the photic zone and the zone immediately below that.
Samples were transferred to storage bottles under nitrogen pressure and in a plastic foil hood. In the first campaign temperature, pH and net primary production (NPP) were determined on board and the samples were filtered immediately after sampling. Samples for ammonia and oxygen determination were fixed on board as recommended in the classical methodologies and the spectrophotometric determination of ammonia, as well as the titration for dissolved oxygen were carried out within a few hours after sampling. Other nutrient concentrations were also determined on the same day after sampling and samples were preserved under ice or in a freezer. For total copper determination, waters were transferred as above to
clean 1L Teflon bottles, acidified to pH 2 with HNO3 and
stored at –20 oC. In both sampling occasions there was full
sun and very low wind velocity.
All material used for storage, filtration, extraction and measurement were tested for metal contamination and pre-cleaned with successive treatments in Extran 5% (v/v),
HNO3 P.A. 1:1 (v/v), HNO3 P.A. 1:10 (v/v), HNO3 Supra
Pur, Merck, 1:10 (v/v), and Milli-Q water. Clean polyethylene bags were used to enclose and protect sampling and storage bottles prior to and after sampling. Temperature, salinity, pH, dissolved oxygen, particulate matter, alkalinity, phosphate, nitrate, nitrite, ammonia, silicate, chlorophyll a, primary production and total Cu (II) were determined for all the samples. In the samples from the second campaign, the copper complex capacity and copper (I) concentration were also determined together with the above. The classical methods presented in Grasshoff et al.18 and in Strickland and Parsons19 were used for nutrient, chlorophyll a and dissolved oxygen analysis.
Primary production was measured using the 14C method of
Steeman and Nielsen20 in which the water sample after
being inoculated with labeled bicarbonate is incubated under controlled temperature and fixed light intensity over 4 h, alkalinity was determined potentiometrically. Particulate matter was determined gravimetrically after filtration using 0.45 mm Millipore membrane filter.
Cu (I) determination
chelation of Cu (I) with 2,9-dimethyl-1,10 phenantroline and binding of Cu (II) with ethylenediamine, followed by extraction of the chelated Cu (I) with distilled methylene chloride (chromatographic grade submitted to sub-boiling
distillation) and back extraction in HNO3 (10% - v/v).
Extractions providing a copper concentration factor of 500 were carried out in 1L of seawater immediately after sampling. Separation funnels and all sample and reagent storage bottles were made of Teflon. All reagents were
tested for blank; HNO3 (Merck Suprapur) and NH4OH
(isothermically distillated) were used to adjust the pH. The analytical determination of copper in the acid extract was performed in a Perkin Elmer AAS 1100 equipped with a graphite furnace HGA-300. The GF-AAS detection limit
for copper was 1.76 10-8 mol L-1 and the relative standard
deviation was of the order of 10% (n=2); a standard calibration curve was used for quantification.
Total Cu (II) determination
Adsorption stripping voltammetry was used following
the method reported by van den Berg,21 which is based on
the adsorption of the copper-8-hydroxyquinoline on the hanging drop mercury electrode (HMDE). Unfiltered samples for Cu (II) determination were stored frozen at
–20 oC (after acidification to pH 2 with HNO
3 (Merck
Suprapur). Unfiltered samples were used considering the usually low particulate content of the studied waters and to avoid contamination. The optimized procedure follows: 10g of sample was weight directly into a Teflon polarographic cell; the pH was adjusted around 7.5-7.7
by adding pre-cleaned HEPES 0.01 mol L-1 and
8-hydroxyquinoline was added to give a final
concentration of 8 x 10⁻⁶ mol L-1. Measurements were
performed in a PAR 384B polarographic analyser equipped with a HMDE PAR 303A, using the following conditions: drop size large; –0.200 V initial potential; –0.550 V final
potential; 0.025 V pulse height; 0.2 s pulse time; 10 mV s-1
scan rate; 15 min de-aeration time; mild stirring; 30-60 s adsorption time. Copper peak potential appeared at – 0.400 V. All samples were run in triplicate and quantification was made by the standard addition method which yielded standard curves with 0.9987<R<0.9999. The detection
limit was 0.23 nmol L-1 and the standard deviation (n=3)
was 5.2% at 1.3 nmol L-1 concentration level.
Cu (II) complexing capacity determination
The method reported by Zhou and Wangersky22 was
used for the determination of Cu(II) complexing capacity.
Copper up to 1 µmol L-1 final concentration, was added to
400 mL of freshly collected seawater sample. After 2 h of equilibration time the whole volume was injected into a
pre-cleaned Sep-Pak C18 cartridge. The cartridges were then
stored at –20 oC before eluting the copper complexes
according to polarity by using 5.0 mL of methanol followed by 10.0 mL of methanol/water 1:1 (v/v).
Results and Discussion
Results are reported in Tables 1 and 2. Figure 1 shows the temperature/salinity diagrams that aid in understanding the complex oceanographic situation present during both campaigns. The coastal region of Rio de Janeiro is in the domain of the Brazil Current (BC), characterized by warm
(21- >24 oC) and saline (36.00-36.50) waters. The
upwelling waters in Cabo Frio are less saline (35.00-35.50) and colder (< 18 oC in the surface to <15 oC at 50 m), therefore, the temperature-salinity diagram indicates mixing between the two water masses as well as the prevailing conditions (for instance, upwelling-downwelling). It is evident from the data that a full upwelling event was not prevailing at any time. In the first sampling waters at the surface were in the temperature range of the Brazil Current but less saline, while at depths,
Figure 1. Temperature/Salinity diagram: (a) data for the first
Table 2. Total copper (II) concentration and standard deviation in the first (A) and second (B) samplings; Cu(I), standard deviation and chelated copper in the second sampling
Station/ Cu (II) Cu (I) Cu (II) chelate-methanol Cu(II) chelate-methanol/water Total Cu(II) Bound
deep (nmol L-1) (nmol L-1) (nmol L-1) (%)a (nmol L-1) (%)a (%)a
1A/5m 2.80 (0.01) 1A/20m 1.57 (0.06) 1A/30m 1.67 (0.06) 1A/50m 5.67 (0.05) 2A/5m 6.19 (0.09) 2A/20m 3.23 (0.22) 2A/30m 2.54 (0.19) 2A/50m 2.00 (0.10)
1B/5m 2.25 (0.15) 0.085 (0.002) 1.90 (0.01) 8 3 0.40 (0.01) 1 7 100
1B/20m 2.70 (0.12) 0.139 (0.002) 1.80 (0.01) 7 8 0.50 (<0.01) 2 2 8 5
1B/30m 2.56 (0.45) 0.073 (0.002) 1.90 (<0.01) 7 9 0.50 (<0.01) 2 1 9 4
1B/50m 3.16 (0.16) 0.044 (0.002) 0.70 (<0.01) 7 8 0.20 (<0.01) 2 2 2 8
2B/5m 3.29 (0.13) 0.065 (0.001) 1.30 (<0.01) 5 9 0.90 (<0.01) 4 1 6 7
2B/20m 3.77 (0.02) 0.044 (0.001) 1.30 (<0.01) 5 4 1.10 (<0.01) 4 6 6 4
2B/30m 5.71 (0.05) 0.144 (0.003) 1.80 (<0.01) 8 2 0.40 (<0.01) 1 8 3 8
2B/50m 6.47 (0.03) 0.173 (0.003) 1.30 (<0.01) 6 8 0.60 (<0.01) 3 2 2 9
3B/5m 1.32 (0.08) 0.198 ( 0.001) 1.20 (<0.01) 7 1 0.50 (<0.01) 2 9 100
3B/20m 2.31 (0.11) 0.035 (0.001) 1.50 (<0.01) 8 8 0.20 (<0.01) 1 2 7 4
3B/30m 3.45 (0.23) 0.115 (0.002) 1.00 (<0.01) 8 3 0.20 (<0.01) 1 7 3 5
3B/50m 6.18 (0.27) 0.156 (0.001) 1.70 (<0.01) 6 1 1.10 (<0.01) 3 9 4 5
a Calculated fraction of copper (II) bound using the experimental data on total copper (II) and the complexing capacity.
Table 1. Physical and chemical data obtained in the first (A) and second (B) sampling campaigns
Station/ T Salinity pH O2dis PM Alk. PO4-P NO2-N NO3-N NH4-N SiO4-Si NPP Chl a [CO2]aq deep (oC) SSU (mL L-1) (mg L-1)(x10-3mol L-1)(µmol L-1)(µmol L-1) (µmol L-1) (µmol L-1) (µmol L-1) (mgC m3 h-1) (mg m-3) (µmol L-1)
1A/5m 23.92 35.36 8.12 5.53 n.d 2.23 0.50 0.23 0.63 1.46 2.08 4.79 1.47
1A/20m 18.10 35.91 8.14 5.21 9.95 2.24 0.50 0.65 3.66 2.23 2.68 0.45 0.56
1A/30m 16.38 36.06 8.14 4.87 5.78 2.25 0.62 0.82 6.98 1.42 3.18 0.97 0.46
1A/50m 15.88 35.69 8.13 4.58 9.35 2.22 0.52 0.68 7.14 2.68 3.18 0.38 0.45
2A/5m 22.14 35.66 8.25 5.55 7.96 2.23 0.20 0.07 0.15 1.76 1.69 5.10 1.32
2A/20m 17.14 35.87 8.12 4.73 9.97 2.25 0.50 0.83 4.26 1.97 2.48 0.51 0.61
2A/30m 16.98 35.66 8.09 5.13 8.47 2.22 0.58 0.84 5.01 2.23 3.18 0.01 0.95
2A/50m 16.92 35.76 8.09 4.82 11.13 2.25 0.70 0.80 6.72 1.44 2.58 0.34 0.33
1B/5m 20.66 36.14 8.32 5.15 18.47 2.23 0.64 0.42 1.38 2.80 5.20 1.03 0.14 8.94
1B/20m 17.92 35.80 8.41 4.67 18.77 2.23 0.76 0.24 6.74 1.31 7.16 0.42 0.08 6.91
1B/30m 17.80 35.80 8.33 4.50 17.47 2.05 0.64 0.18 7.07 1.79 5.98 0.33 0.07 7.97
1B/50m 17.50 35.60 8.53 4.36 17.10 1.95 0.76 0.15 7.09 2.33 5.59 0.15 0.05 4.25
2B/5m 24.14 36.20 8.44 5.27 17.22 2.24 0.37 0.07 0.33 1.57 3.53 1.84 0.24 5.44
2B/20m 20.86 36.05 8.40 4.38 16.57 2.10 0.63 0.20 2.40 1.86 3.92 1.10 0.21 6.24
2B/30m 19.00 35.94 8.35 4.34 13.71 2.13 0.53 0.13 5.22 2.13 3.82 0.19 0.12 7.65
2B/50m 18.56 35.81 8.26 4.30 13.40 2.23 0.66 0.01 7.17 1.78 6.18 0.14 0.08 10.54
3B/5m 24.56 36.02 8.34 5.46 16.72 2.22 0.25 >DL 0.21 1.49 3.04 1.11 0.30 7.28
3B/20m 21.90 36.38 8.34 5.24 12.67 2.06 0.31 >DL 0.02 1.72 2.55 0.31 0.10 7.03
3B/30m 19.12 35.90 8.31 5.17 11.80 2.07 0.60 0.33 4.35 1.85 4.61 0.31 0.22 8.28
3B/50m 18.66 35.81 8.60 4.49 11.72 2.24 0.61 0.05 4.81 2.65 3.82 0.11 0.11 3.91
PM: particulate matter; Chl a: chlorophyll a; SSU: standard salinity units; NPP: net primary production; DL (NO2-N): 0.01 µmol L-1.
temperatures were in the range of the SACW but salinities were higher. In both samplings, colder waters penetrated the photic zone (1% of light extinction at 20-25 m as estimated from Secchi disc). The relatively low salinities at the surface in the first sampling can be explained by the presence of surface shelf waters (>18 ºC and 34 – 36, caused by the mixing of coastal and tropical waters) as reported
for other occasions by Valentin, 23 Mendonça24 and Moreira
da Silva.25,26 The presence of waters with temperatures as
low as 15-16 oC at 50 m indicate a recent event of upwelling
while the intermediate temperatures are deriving from a mixture of water masses that is common in periods following termination of upwelling.
proximity of the Brazil Current to the coast and a complex mixture of BC and SACW. The process of upwelling and downwelling generates large horizontal and vertical heterogeneity in the area, whereby the water masses that are subsiding carry materials produced in the surface to greater depths. The lower temperatures and salinities in profile 1 indicate penetration of colder waters through the bottom and mixing. This complexity of waters in a process of vertical and horizontal movement affect the measured chemical properties and produce scattered depth profiles with very distinct features at each sampling station, as discussed below.
In both samplings the low dissolved oxygen values observed in surface waters in comparison with those
encountered in typical upwelling events (~ 6 mL L-1 in the
surface and 4 mL L-1 at depth) are indicative of a period
after a recent upwelling. In these periods production is low but there is still an elevated number of cells and organic matter to decompose. The N/P ratio, which was between 9.2 (surface) and 20.2 (50 m) in the first sampling and between 5.3 (surface) and 14 (30 m) in the second sampling,
confirms earlier observation27 of nitrogen limitations in
the area. Phosphate correlates directly with silicate and both nutrients are inversely correlated to temperature as expected, since the colder waters are the main source of new N, P and Si in the area.
Using pH, alkalinity and the temperature corrected ionization constants for the carbonic acid in seawater was
calculated CO2(aq) for the second sampling (see Table 1).
The CO2(aq) and O2dis depth profiles also point out the
heterogeneity of the system. At station 1 production and heterotrophic respiration (possibly also due to the accumulation of land organic material) are both occurring more intensively at the surface while at stations 2 and 3
the CO2(aq) maximum is at the bottom of the photic zone.
The high Cu(II) values at 5 m depth in the first sampling may reflect the input of land derived material (possibly also from Guanabara Bay and from the north). The T/S values for these samples show high temperature waters with unusually low salinity that can only be explained as resulting from continental drainage as discussed above. For the second sampling there is, in general, an increasing Cu(II) concentration with depth. There are large concentration variations between samplings in both stations 1 and 2. At 50 m, concentrations were in the range between 2 and 6.5
nmolL-1. Kremling and Wagener17 reported concentrations
of 1.3 to 4.5 nmolL-1 for the same region.
Cu (I) was found as 2 to 15% of the total Cu (II), in
agreement with the levels reported by Moffet and Zika,10
but only in stations 1 and 3 were the concentrations higher at the surface where photochemical reactions are more
intense. The depth profiles were also very irregular when
compared to those reported by the Moffet and Zika,10 who
found a smooth decrease in Cu (I) from surface to the bottom of the photic zone (200 m) in the coastal region of Florida. The irregular profiles were ascribed to the complex distribution and mixture of water masses prevailing in the sampling period. Mixing processes and the formation of
vortices during subsidence periods28 increasing the vertical
transport of material may explain the values of Cu (I) below the euphotic zone (~25 m depth). A production of Cu (I) from biological processes cannot be ruled out although no relationship has been found between Cu (I) concen-tration and the chemical indicators of biological activity observed here.
Complexing capacities varied from 0.90 nmolL-1 to
2.80 nmolL-1 and since the samples were unfiltered, the
values also include binding sites in the particulate phase. Binding sites of low polarity are predominant making up more than 60% of the total complexing capacity. The concentration of copper bound was estimated from the complexing capacities and varied from 100% at the surface to 28-45 % at 50 m.
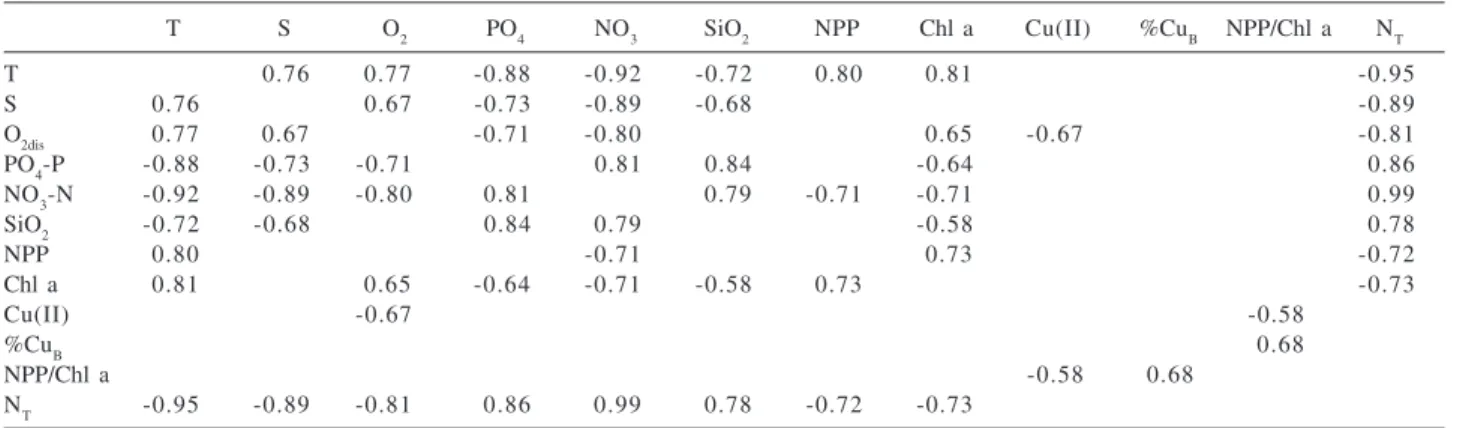
Although concentration depth profiles as stated above were very different in the observed stations, the whole set of data for each sampling were evaluated in order to improve the statistical significance of the conclusions. The
statistically significant (p ≤ 0.05) Pearson correlation
coefficients for the second sampling are displayed in Table 3. Trends observed for the first sampling were strongly biased by the values from 5m depth samples apparently influenced by coastal water inputs
Nitrate, phosphate and silicate concentrations are obviously dependent on the upwelling contribution as they appear in close association to low temperatures and low salinity. In both the first and second sampling, the rate of primary production was strongly but negatively correlated to nutrient species, inclusively to the production potential of the water masses as represented by the ratio
NT/P. On the other hand, the ratio NPP/Chl a, which is used
to normalize the production data to the initial standing biomass, correlates significantly to the fraction of bound
copper. Excellent correlations (r = 0.95; p ≤ 0.05) between
inhibiting role in phytoplankton growth in the observed waters and that biological conditioning, indeed, must take place before available nutrients can be used.
The ratio of total copper (II) to particulate matter also appears to be relevant in the control of primary production
(r = 0.70, p<0.05 for Cu(II)/PM vs. NPP/Chla). The
adsorption tendency of copper on natural particles of either
organic and inorganic origin is well known29,30 (including
surface complex formation) and therefore, the greater availability of particles should result in increased removal of copper ions from solution phase and in the decrease of its toxicity to the phytoplankton.
Alkalinity and Cu (I) showed no significant correlations with the other measured components.
Conclusions
Although samplings did not take place during a maximum upwelling period but during a stage of complex distribution of water masses, the results obtained so far, indicate the influence of copper (II) speciation on primary production in the region. The statistically significant relationship given here are the first ones reported since the
work by Barber and Ryther4 for field conditions whereas
most other copper toxicity related experiments have been performed in laboratory under controlled conditions.
The presence of a significant steady-state level of Cu (I) in seawater has been attributed to direct Cu (II) photochemical reactions or to reduction by hydrogen
peroxide31 following stabilization by chloride
comple-xation. In the observed samples copper (I) was present at measurable concentrations, however, there were no indication that its production reduced the copper binding capacity or influenced the NPP of the studied waters.
The inverse relation between primary production and nutrient species, especially of nitrogen (the principal limiting nutrient in the region), is a very strong indication
that there are other important limiting factors. Besides inorganic species of copper (II), iron deficiency could play some role although the proximity to land and therefore constant inputs of iron from the continent should rule out this aspect. Nonetheless, additional investigations should be carried out on iron speciation as related to production in these waters.
Acknowledgements
The authors are grateful to CNPq for the financial support and to PETROBRAS that provided the ship facility.
References
1. Sunda, W.G.; Guillard, R.R.L.; J. Mar. Res. 1976, 34, 511. 2. Brand, L.E.; Sunda, W.G.; Guillard, R.R..L.; J. Exp. Mar. Biol.
Ecol. 1986, 96, 225.
3. Eriksen, R.S.; Mackey, D.J.; van Dam, R.; Nowak, B.; Mar. Chem. 2001, 74, 99.
4. Barber, T.B.; Ryther, J.H.; J. Exp. Mar. Biol. Ecol. 1969, 3, 191.
5. Barber, R.T.; Dugdale, R.C.; MacIsaac, J.J.; Smith, R.L.; Inv. Pesq. 1971, 35, 171
6. Barber, R.T. In Trace Metals and Metal-Organic Interaction in Natural Waters; Singer, P. ed.; Ann Arbor Science: Ann Arbor, 1973, pp. 321-328.
7. Jackson, G.A.; Morgan. J.J.; Limnol Oceanogr. 1978, 23, 268. 8. Gerringa, L.J.A.; Rijstenbil, J.W.; Poortvliet, T.C.W.; van Drie,
J.; Schot, M.C.; Aquat. Toxicol.1995, 31, 77.
9. Rijstenbil, J.W.; Derksen, J.W.M.; Gerringa, L.J.A.; Pootvliet, T.C.W.; Sandee, A; van den Berg, M.; van Drie, J.; Wijnholds, J.A.; Mar. Biol. 1994, 119, 583.
10. Moffet, J.W.; Zika, R.G.; Geochim Cosmochim. Acta 1988, 52, 1849.
11. André, D.L.; MSc. Dissertation, Universidade Federal Fluminense, Rio de Janeiro, Brazil, 1990.
Table 3. Statistically significant Pearson correlation coefficients (p<0.05) for data from the second sampling
T S O2 PO4 NO3 SiO2 NPP Chl a Cu(II) %CuB NPP/Chl a NT
T 0.76 0.77 -0.88 -0.92 -0.72 0.80 0.81 -0.95
S 0.76 0.67 -0.73 -0.89 -0.68 -0.89
O2dis 0.77 0.67 -0.71 -0.80 0.65 -0.67 -0.81
PO4-P -0.88 -0.73 -0.71 0.81 0.84 -0.64 0.86
NO3-N -0.92 -0.89 -0.80 0.81 0.79 -0.71 -0.71 0.99
SiO2 -0.72 -0.68 0.84 0.79 -0.58 0.78
NPP 0.80 -0.71 0.73 -0.72
Chl a 0.81 0.65 -0.64 -0.71 -0.58 0.73 -0.73
Cu(II) -0.67 -0.58
%CuB 0.68
NPP/Chl a -0.58 0.68
12. Pires-Vanin, A.M.S.; Publ.Esp. Inst. Oceangr. 1993, 10, 217. 13. Miranda, L.B.; Katsuragawa, M.; Publ. Esp. Inst. Oceanogr.
1991, 8, 1.
14. Rodrigues, R.F.; Publ. Inst. Pesq. Mar. 1977, 115, 1. 15. Valentin, J.L.; Hidrobiologia1984a, 113, 183. 16. Valentin, J.L.; Mar. Biol. 1984b, 82, 259.
17. Kremling, K.; Wagener, A. de L.R.; Abstract of the Rio Con-ference on the Chemistry of Tropical Marine Systems, Rio de Janeiro, Brazil, 1987.
18. Grasshoff, K.; Ehrhardt, M.; Kremiling, K.; Methods of Sea-water Analysis, 2nd ed., Verlag Chemie: Kiel, 1983.
19. Strickland, J.D.H.; Parsons, T.R.; Bull. Fish. Res. Board. Can.
1972, 167, 311.
20. Steeman, N. In The Sea; Hill, M.N., ed., Interscience Publ: New York, 1952, vol. II.
21. van den Berg, C.M.G.; Mar. Chem. 1986, 19, 111. 22. Zhou, X.; Wangersky, P.J.; Mar. Chem. 1989, 26, 21.
23. Valentin, J.L.; Mar. Biol. 1984, 82, 259
24. Mendonça, C.F.; Publ. Inst. Pesq. Mar. 1977, 102, 1. 25. Moreira da Silva, P.C.; Publ. Inst. Pesq. Mar. 1968a, 12, 1. 26. Moreira da Silva, P.C.; Publ. Inst. Pesq. Mar. 1968b, 20, 1. 27. Gonzalez-Rodriguez ,E.; Rev. Brasil. Biol. 1991, 51, 471 28. Valentin, J.L.; Monteiro-Ribas, W.; Mureb, A.; Pessoti, E.;
Publ. Inst. Pesq. Mar. 1976, 97, 1
29. Stumm, W.; Morgan, J.J.; Aquatic Chemistry, 3rd ed., Wiley: New York, 1996.
30. Andrade, W.; Wagener, A de L. R.; Cien. Cult.1997, 49, 48. 31. Moffet, J.W.; Zika, R.G. In Photochemistry of Environmental Aquatic Systems; Zika, R.G.; Cooper, W.J., eds.; Adv. Chem. Ser. 327; Amer. Chem. Soc.: Washington, 1987.
Received: October 24, 2002