Article
J. Braz. Chem. Soc., Vol. 25, No. 4, 675-685, 2014. Printed in Brazil - ©2014 Sociedade Brasileira de Química 0103 - 5053 $6.00+0.00
A
*e-mail: [email protected]
Study of Fatty Acids Profile in Biological Sample by Capillary Zone Electrophoresis
Associate to Chemometric Approach
Patrícia M. C. Barra,a Patrícia L. Oliveira,a Danielle M. O. Aragão,b
Céphora M. Sabarense,c Beatriz J. V. Aarestrup,d Mônia S. Azevedo,e
Ana Carolina O. Costa,e Gustavo A. Mickef and Marcone A. L. Oliveira*,a
aChemistry Departament, Institute of Exact Sciences, bBiology Departament, Institute of Biological
Sciences, cNutrition Departament, Federal University of Juiz de Fora, Rua José Lourenço Kelmer -
São Pedro, 36036-900 Juiz de Fora-MG, Brazil
dMorphology/HistologyDepartament, Institute of Biological Sciences, Morphology,
Center for Reproductive Biology, Federal University of Juiz de Fora, Rua José Lourenço Kelmer - São Pedro, 36036-900 Juiz de Fora-MG, Brazil
eDepartment of Food Science and Technology, Federal University of Santa Catarina,
Campus Reitor João David Ferreira Lima, s/n, Trindade, 88040-900 Florianópolis-SC, Brazil
fChemistry Department, Federal University of Santa Catarina,
Campus Reitor João David Ferreira Lima, s/n, Trindade, 88040-900 Florianópolis-SC, Brazil
Foi proposta a determinação de ácidos graxos (FA) no fígado de ratos Wistarde três grupos diferentes (seis ratos por grupo) submetidos à dieta (AIN-93G) utilizando a técnica de eletroforese capilar de zona (CZE). Cada grupo recebeu a mesma dieta, sendo o óleo de soja a fração lipídica da dieta (7% m/m). O primeiro grupo foi alimentado com ração contendo óleo de soja fresco, o segundo foi alimentado com a dieta cuja fração lipídica foi óleo de soja utilizado durante 7 dias em processo de fritura por imersão e, finalmente, o terceiro grupo foi alimentado com dieta cuja fração lipídica foi óleo de soja utilizado durante 15 dias em processo de fritura. Após 45 dias consumindo essas dietas, os ratos foram submetidos à eutanásia e o teor de FA no fígado foi monitorado por CZE de uma forma simples, rápida e eficiente. Os resultados obtidos foram comparados com o método oficial por cromatografia à gás e não foram observadas diferenças significativas no intervalo de confiança de 95%. Os eletroferogramas para análise de FA foram submetidos à análise de componentes principais (PCA), sendo possível discriminar o grupo final dos grupos intermediários e controle. Além dos resultados da PCA, a lipoproteína de baixa densidade (LDL), foi avaliada, indicando que o tempo de exposição total de óleo submetido a processos de fritura profunda pode ser considerado relevante para a avaliação da qualidade do óleo.
The determination of fatty acids (FA) in liver from three different groups of Wistar rats (six rats by group) submitted to diet (AIN-93G) by capillary zone electrophoresis (CZE) was proposed. Each group received the same diet. However, the soybean oil used to prepare the feed, whose amount was 7% w/w, had different origins. The first group was fed with feed containing soybean oil fresh; the second one was fed with soybean used during 7 days in deep frying process; finally, the third was fed with soybean used during 15 days in deep frying process. After 45 days the rats were submitted to euthanasia and the FA amount in liver was successful monitored by CZE in a simple, fast and efficient way. The results obtained were compared to gas chromatography official method and no significant differences were observed within 95% confidence interval. The electropherograms to FA analysis were submitted to principal component analysis (PCA) being possible to discriminate the final from the control and intermediate groups. In addition to PCA results, the low density lipoprotein (LDL) was evaluated indicating that the total time exposure of the oil submitted to deep frying processes can be considered relevant to evaluating the oil quality.
Keywords: fatty acids, liver rat, capillary zone electrophoresis, gas chromatography,
Introduction
The consumption of certain foods or fatty acid (FA) supplements can modulate abnormal FA and eicosanoid metabolism, both of them associated with development of chronic diseases. Among all the fats, certain FA have the potential to be used as functional ingredients since their intake has been found positively related to health.1,2
According to Wang et al., in vivo data from male Wistar rats indicate that diets with high rate of saturated fatty acids, but not unsaturated fatty acids results in induction of hepatic endoplasmic reticulum (ER) stress and liver damage.3
According to Mattson and Grundy, a diet rich in saturated fatty acids promotes raise in low density lipoprotein (LDL) level in comparison with monounsaturated and polyunsaturated diet.4
Fried foods have high acceptance and one of the preferential aspects for this kind of cooking is the sensorial characteristic developed and the energetic value acquired. However, the frying process induces changes in the oils, and these modifications are related with FA profile modification and thus, the production of toxic compounds,5 which
could be ingested from fried foods.6 In this way, the single
most important determinant of the FA composition of the final fried product is the quality of the frying oil. There was a linear relationship between the degradation index throughout the frying process.7 The substances formed
during deep-fat frying are toxic compounds and may cause deleterious effects on rats when ingested through heated fats, especially in their liver.8
The metabolic impact of a greater use of these frying oils on population fat intake is more difficult to assess, so it has been studied in animals. One of the investigation methods is the metabolic studies or histological evaluation in hepatic tissue.9
In general, FA analysis of whole blood is a representative biological sample for the assessment of the FA status in relation to physiopathological conditions. Other samples (e.g., adipose tissues, erythrocytes, cellular membrane) could also be conducted to estimate the FA status in populations and this information is useful in relation to dietary fat intakes to health outcomes.10
The classical separation technique for FA analysis is the gas chromatography with flame ionization detector (GC-FID). The FA methodology analysis involves firstly lipid fraction extraction, saponification reaction and then derivatization of the total FA content into fatty acid methyl esters (FAME) before injection in the GC-FID equipment.11-13
However, other possibilities have been reported in the literature such as high performance liquid chromatography under UV detection (HPLC-UV) taking into account
derivatization reactions using phenacyl and naphthacyl esters,14 thin layer chromatography impregnated with silver
(HPLC-Ag+), Fourier-transform infrared (FTIR),15,16 and
infrared total attenuated reflectance (ATR-IR).17
Among the capillary electrophoresis (CE) methodologies used to FA analysis, it is possible to highlight different modes and detection possibilities, for example: non aqueous capillary electrophoresis (NACE) with a near-infrared fluorophore detection,18 NACE combined with
indirect fluoresce detection,19 hydro organic CZE-UV
under direct or indirect detection,20-25 micellar electrokinetic
chromatography under UV detection (MECK-UV),26,27 and
capillary electrophoresis with contactless conductivity detection (CE-C4D).28,29
Due to the chemical FA features, which are low molar absorptivity, low solubility in aqueous medium, and the presence of FA homologues and isomers; the most common background electrolyte (BGE) systems used for FA analysis by CE takes into account the optimization of variables, such as: buffers like phosphate or Tris/HCl, buffers chromophore like Tris/p-hydroxybenzoate or p-anisato,27 chromophore
agents like sodium dodecyl benzenesulfonate (SDBS),22
organic solvents like methanol (MeOH),30 acetonitrile
(ACN)28 and/or 1-octanol,22 surfactants agents like sodium
dodecyl sulfate (SDS),31 polyoxyethylene 23 lauryl ether
(Brij 35),22 and chiral selectors like cyclodextrins.27,30
Since the 1990s, the analysis of long chain FA by CE has aroused interest in the scientific community due to the versatility, short analysis time and absence of derivatization reaction in sample preparation step. During the last ten years the majority
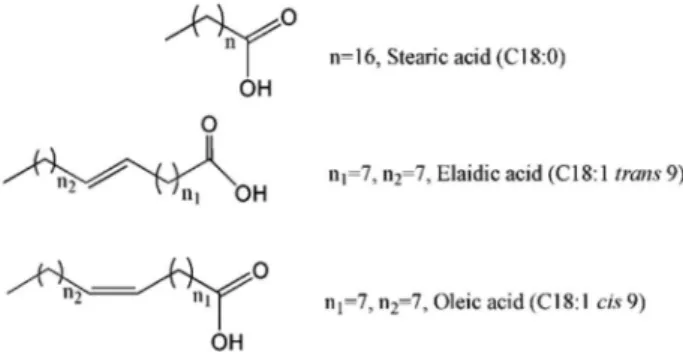
cis/trans FA analysis have been performed by Oliveira group in several different food matrices as oils and fats using CZE approach.20-22,24,29,32-34 For illustration, an example of chemical
structures of FA saturated and cis/trans unsaturated chains were depicted in Figure 1. However, studies involving analysis of liver samples or the other animal tissues by CE are incipient and assessing the content of FA in this type of matrix is necessary.
Figure 1. The chemical structures of saturated (palmitic acid, C16:0),
Within this context, the deposit of fat and FA profile in the liver of Wistarrats fed diets with soybean oil for deep frying were evaluated by CZE. The methodology selected was performed under indirect UV detection in the absence of derivatization and extraction steps for sample preparations and compared to the classical GC method.
Experimental
Animals and diets
The study was conducted under the approvals of the Local Commission of Animal Experiment Ethics at the Federal University of Juiz de Fora.
The rats were kept in the bioterio of the Institute of Biology at the University of Juiz de Fora, 3 animals per box, two boxes per group, totalizing eighteen animals, with supply of filtered water and food (for each group)
ad libitum. The temperature was maintained between 22 and 26 °C. The brightness was set to light and dark cycles lasting 12 h each.
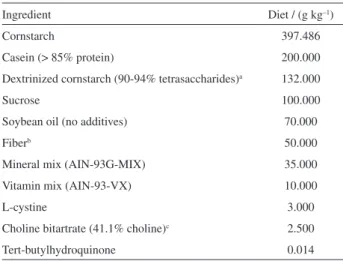
The animals were fed a diet formulated with ingredients of high purity, closely following the guidelines outlined by the American Institute of Nutrition35 as described in Table 1.
The AIN-93G diet is recommended to support growth, pregnancy and lactational phases. Bourre et al.36 suggested
that the optimal (n-6):(n-3) ratio to rodents is between 1 and 6. Soybean oil is the only single source of dietary fat that comes close to meeting these criteria. The oil contains about 14% saturated fatty acids, 23% monounsaturated fatty acids, 51% linoleic acid, and 7% linolenic acid. This gives a
(n-6):(n-3) ratio of 7, and a polyunsaturated: saturated ratio of ca. 4.36 Thus, soybean oil is the recommended source of
fat in the AIN-93 diets.
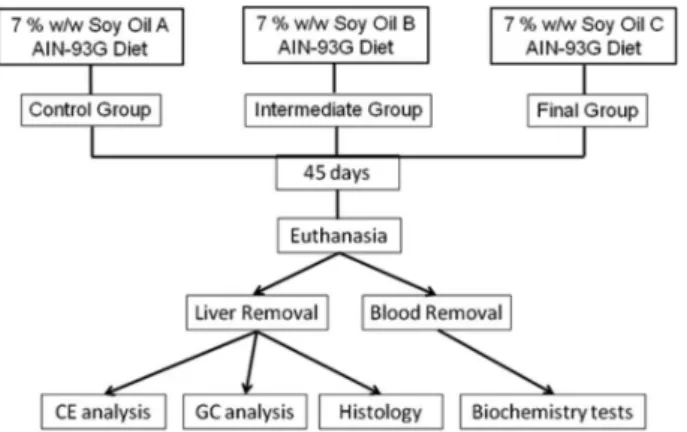
In this work, three groups were formed with six Wistar rats each, and the animals of group A were fed with AIN-93G diet whose fat source was soybean oil fresh from the same batch used in the frying process called here SOY OIL A. The diet of the animals in Group B was also AIN-93G diet, however the lipid source of the formulation was soybean oil used in the frying process by intermediate time (1 week, 04 cycles of use and frying various food in days non sequential) called here SOY OIL B and for animals of group C were fed with AIN-93G diet whose fat source was soybean oil used in the frying process for maximum time before disposal, according to the undesirable sensory parameters such as viscosity and darkening (2nd week of use,
total of 10 cycles, four cycles in the first week and second week six cycles of use of oil, on average 15 days total time of use), called here SOY OIL C. It is noteworthy that the percentage of any component of the diet was changed between the groups, only the quality of soy oil used. The diet of each group was separately prepared by mixing each ingredient described in Table 1, suitably sieved, with subsequent achievement of pellets that were immediately frozen to prevent mold and oxidation until the time of delivery to the animals.
After 45 days from the beginning of the experiment, all the animals involved were euthanized according to the Guide for the Care and Use of Laboratory Animals37
by anesthetic overdose with ketamine (100 mg kg–1) and
xylazine (10 mg kg–1). After the observation of a significant
decrease in heart rate, the heart was exposed then step exsanguination was performed and the blood was collected for subsequent biochemical test. The liver was obtained by removing complete excision, stored in suitable containers and stored at –80 °C until the analysis. The liver samples used to the histology analyses were fixed in 10% buffered formaldehyde immediately after the collection and subsequently subjected to histological processing. The rest of the material used was not intended for medical waste collected in University. The flowchart described in Figure 2 makes clear the process above cited.
Chemicals and Materials
All reagents were of analytical grade and the water was purified by deionization (Milli-Q system; Millipore, Bedford, MA, USA). The solvents MeOH (Vetec, Rio de Janeiro, Brazil), ACN (Merck, Rio de Janeiro, Brazil), hexane, petroleum ether and 1-octanol (Merck, Rio de Janeiro, Brazil) were purchased with chromatographic
Table 1. AIN-93G diet formulated for the growth, pregnancy and
lactational phases of rodents35
Ingredient Diet / (g kg–1)
Cornstarch 397.486
Casein (> 85% protein) 200.000
Dextrinized cornstarch (90-94% tetrasaccharides)a 132.000
Sucrose 100.000
Soybean oil (no additives) 70.000
Fiberb 50.000
Mineral mix (AIN-93G-MIX) 35.000
Vitamin mix (AIN-93-VX) 10.000
L-cystine 3.000
Choline bitartrate (41.1% choline)c 2.500
Tert-butylhydroquinone 0.014
aDyetrose (Dyets, Bethlehem, PA) and Lo-Dex 10 (American Maize,
Hammond, IN) meet these specifications. An equivalent product may also be used; bSolka-Floc® (200 FCC FS&D, St. Louis, MO) or its equivalent
grade. Polyoxyethylene 23 lauryl ether (Brij 35®) and SDBS were obtained from Sigma-Aldrich (St. Louis, MO, USA). Reagents such as KOH, H2SO4, NaOH, NH4Cl, and
HCl were obtained from Merck (Rio de Janeiro, Brazil). FA standards of C13:0 (internal standard), C16:0, C18:0, C18:1 9c, C18:2cc, C16:1c and C18:3ccc were purchased from Sigma-Aldrich (St. Louis, MO, USA). Individual FA stock solutions at a concentration of 20.0 mmol L–1 were
prepared by dissolving appropriate amounts of the above mentioned standards in MeOH; then they were stored in a freezer until the analysis. A mixture of all of the standards was prepared at the concentration of 0.5 mmol L–1 by the
appropriate dilutions in MeOH.
Mixture FAME standards containing: 37 FAME from 4 to 24 carbon atoms (Supelco Inc. Bellefonte, PA, USA) with certificated quantities of each compound; mixture of
cis/trans FAME isomers of 18:2 (cc, ct, tc, tt) and 18:3 (ccc, cct, ctt, tcc, ttc, tct, ctc, ttt) (Sigma Chemical Co, St Louis, MO); individual FAME standards about 99% purity (Sigma Chemical Co, St Louis, MO): elaidic (18:1 9t), 18:1 7c, 18:1 12c, conjugated linoleic acid (18:2 9c11t and 18:2 10t12c) were used for experimental set.
Aqueous Brij 35® stock solution was prepared by weighing and dissolving an amount corresponding to 50.0 mmol L–1 in a 100.0 mL volumetric flask. A mass
of NaOH corresponding to 0.5 mol L–1 was weighed and
dissolved in a 100.0 mL volumetric flask and the volume was made up with MeOH. Aqueous SDBS stock solution was prepared by weighing and dissolving a mass corresponding to 100.0 mmol L–1 in a 100.0 mL volumetric flask.
Aqueous buffer stock solutions at concentrations of 100.0 mmol L–1 were prepared from a mass of sodium
phosphate monobasic (NaH2PO4); corresponding to
50.0 mmol L–1 and 50.0 mmol L–1 of sodium phosphate
dibasic (Na2HPO4); which was weighed and dissolved in
a 250.0 mL volumetric flask. Phosphate buffers and the Brij 35® stock solutions were kept in a freezer to prevent mold formation. The fresh working electrolyte solution
was prepared by the appropriate dilutions of stocks and the incorporation of solvents.
Instrumentation
Capillary electrophoresis system
Separation optimization experiments were conducted using a CE system (HP3d CE, Agilent Technologies, Palo Alto, California, USA) equipped with a diode-array detector, with indirect detection (inverted peak: 400 (± 2) nm in sample and 224 (± 2) nm in reference), a temperature control device (set at 25 °C), and a data acquisition and treatment software (HP ChemStation, rev A.06.01). Samples were hydrodynamically injected (12.5 mbar for 5 s) and the electrophoretic system was operated under normal polarity and constant voltage (+19 kV); manual integration using peaks baselines. For all the experiments, a fused-silica capillary tube with fluoro-polymer external coating was used (TSH: this capillary is more abrasion resistant and offers unique solvent resistance properties): (Polymicro Technologies, Phoenix, AZ, USA) 48.5 cm long (40 cm effective length) 75 µm of internal diameter (I.D.) and 375 mm of outside diameter (O.D.). It is important to highlight that using TSH capillary avoids some adsorptions problems in the fused silica capillary inner wall in comparison with the capillary containing polyimide external coating. Such studies on adsorption investigation were described by Balesteros et al..38
Gas chromatography
The FA analysis from rat liver and soybean samples were performed using AOCS Official Method Ce 1f-96: “Determination of cis- and trans- Fatty Acids in Hydrogenated and Refined Oils and Fats by Capillary GLC,Reapproved 1997 • Revised 2002”39 with appropriate adaptations
in temperature program for determination of fatty acid composition. The 7890A gas chromatography system (Agilent Technologies) equipped with a flame ionization detector (FID), a split/spitless injector, operated with a split ratio of 1:10, and a capillary column HP-88 (88% Cianopropylaryl 60 m × 0.250 mm I.D. × 0.20 µm film thickness) was used. Helium was used as the carrier gas at flow rate 1mL min–1. Temperatures of injector and detector
were 260 °C and 300 °C, respectively. The oven temperature was held at 140 °C for 5min, temperature programmed at 4 °C min–1 to 240 °C held for 10 min. Gas-chromatographic
peaks of FAME of the samples were identified by comparison with the standards data retention time.39
Histological assessment and histopathologic analysis The material, from total hepatectomy was cleaved along
with the long axis section from the major hepatic blood vessels and their branches in the right lobe, as surgical procedure by Nolan and Leibowitz.40
After blocks manufacturing, cuts corresponding to each sample were separated for performing routine staining with hematoxylin and eosin (HE) to perform histochemical reaction.
Sections were analyzed on Zeiss microscope (Hallbergmoos, Germany) in increments of 250X, 400X and 1000X, along its entire length. The analysis was performed by two different observers with experience and training in histopathology, along its entire length. From this assessment, representative areas were selected to capture digital computerized Axion Vision (Zeiss, Berlin, Germany), via digital camera coupled to an optical microscope.
For evaluation of acute liver injury was used Ishak Modified by Hepatic Activity in liver necroinflammatory activity,41 as suggested by Theise,42 and the criteria
suggested by Albassams et al. for acute poisoning were observed.43
Sample preparation
Capillary electrophoresis
Approximately 250 mg of rat liver sample (RL) and 300 mg of soybean oil were saponified separately with 2.0 mL of a methanolic NaOH solution (0.5 mol L–1)
in a heated water bath (75-80 °C) for 25 min. Then the saponification content dissolved was diluted in a volumetric flask of 5.0 mL. Before a CE injection, 200 µL of each RL sample was diluted separately in MeOH in a volumetric flask to 1.0 mL. It is important to emphasize that when solid residue remained into the saponification flask was observed, the residue was subtracted from the original mass weighed before the final calculation.
Official method by gas chromatography
Lipid extraction was performed according to analytical standards from the Adolfo Lutz Institute in Brazil.44 The
samples were esterified according to Metcalfe et al., and Hartman and Lago, with adaptations.45,46
Statistical analysis
The statistical tests such as normality, homocedasticity and independence were performed in SPSS 8.0 for Windows software. The lack of fit analysis was performed in Microsoft Office® Excel software. Finally, the liver rat electropherograms obtained were manipulated using a MATLAB environment. For PCA calculations the data were preprocessed using the normalize (1-Norm, area = 1), SNV and mean center.
Analytical procedure
When a new capillary was used, it was conditioned by the pressure flushing of 1.0 mol L–1 NaOH solution (30 min),
deionized water (5 min) and electrolyte solution (10 min). In between runs, the capillary was replenished with 0.2 mol L−1
NaOH solutions (2 min), deionized water (2 min), and fresh electrolyte solution (3 min, pressure flush). This conditioning procedure was critical for ensuring the peak area and migration time repeatability and for preventing deleterious solute adsorption to the capillary wall.
Results and Discussion
Fatty acids analysis
The proposal for the FA quantification in the real samples was based on a statistical study which involved the response factor (Rf) calculation through using C13:0 as internal standard (IS). Rf is a measure of the relative response of an analyte compared to its internal standard. Each calibration or response factor represents the slope of the line between the response for a given standard and the origin.47 In order to calculate Rf, a random
experiment in genuine replicates using of C18:0, C18:1 9c, C16:0, C18:2cc, C16:1 c C18:3ccc standards solution with ranging concentrations at 0.15, 0.30, 0.50, 0.70, 0.90 and 1.10 mmol L–1 and C16:1c standard solution
with ranging concentrations at 0.05, 0.30, 0.55, 0.80 and 1.05 mmol L–1, and fixed C13:0 concentration at
0.5 mmol L–1 was based in the detailed study performed
in our research group.32 Thus, the Rf calculation is
an interesting approach to FA quantification. The Rf is calculated just once for each FA in introductory experiments (under controlled operational conditions with standards). The Rf takes into account the statistics evaluation of the regression models by carrying out tests such as normality, homoscedasticity, independence test in residues and linearity evaluation (lack of fit test, ANOVA) in data set. In other words, by implementing an analysis using the same internal standard at the same concentration as in the preliminary experiment, under the same operational conditions, and if there is no occurrence of assumption violation in the statistic tests, the Rf for each FA can be used for different samples without the necessity to perform experiments to measure the response factor every time.
In the present work, the quantification procedure involved the calculation of Rfi as described by the
mathematical equation 1:
where: AFAi is the FA area, AC13:0 is the IS area, [FAi] is
the FA concentration in mmol L–1 and [C13:0] is the IS
concentration fixed in 0.5 mmol L–1. Subscript i means each
individual FA: C18:0, C18:1 9t, C18:1 9c, C16:0, C18:2cc, C18:3ccc and C16:1c.
Since the regression model diagnosis was considered satisfactory, the slope could be used as Rf in equation 1, as long as the C13:0 at 0.5 mmol L–1 is used, the concentration
of each FA remaining as incognito. Percentage for each FA (%FAi) in the samples was carried out through equation 2,
obtained after rearranging equation 1:
(2)
where: AFAi is the area for each FA, AC13:0 is IS area, [C13:0]
is the IS fixed concentration of 0.5 mmol L–1, V is the
volume in L, m is the sample mass in mg, Rfi is the response
factor (fitted model slope for each FA), and MWFAi is the
molecular weight for each FA.
The Rfi values to FA were 0.477, 0.506, 0.555, 0.589,
0.626, 0.818, and to C18:0, C18:1 9t, C18:1 9c, C16:0,
C18:2cc, C18:3ccc, respectively.32 However, to Rf the
C16:1c was performed in this work and the value that was found was 0.425.
In order to check the CE methodology reliability for the FA analysis, the soybean oil samples were analyzed in genuine duplicate and the results were compared to the AOCS official GC method Ce 1f-96.39
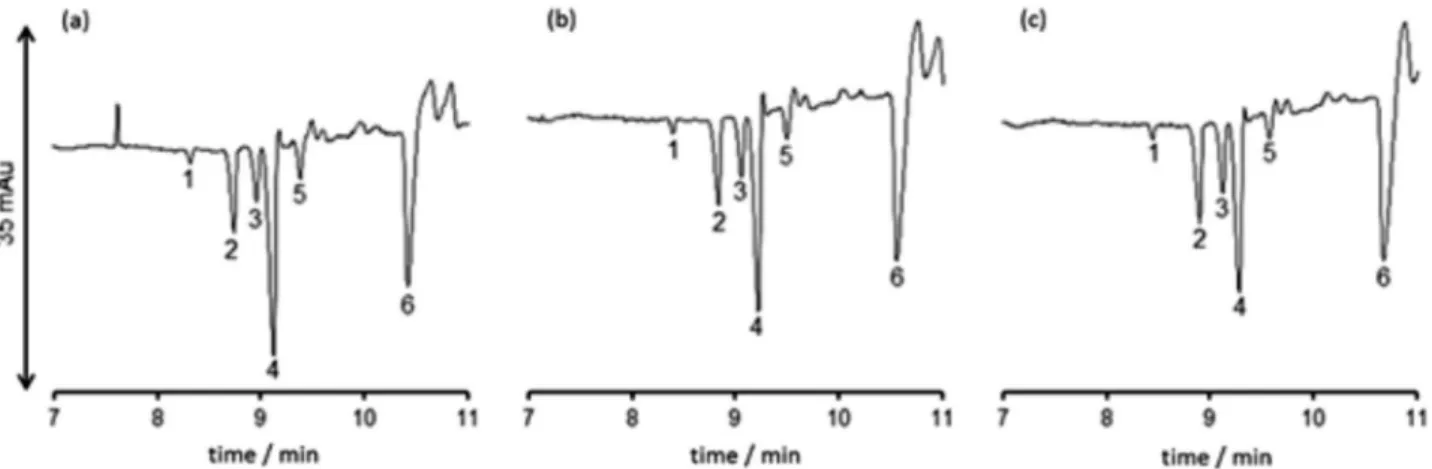
Table 2 shows statistical results to soybean quantification for CE and GC. For normality test (Shapiro-Wilk) no significant difference was found for 99% confidence interval, because p-values found were higher than 0.01. According to the paired sample t test, no evidence of significant difference between the two methodologies was observed in the 95% confidence interval (p-value found was higher than 0.05), and Figure 3 shows the soybean oil electropherograms obtained through the CE analysis.
During the batch process by deep frying, the oil is exposed repeatedly to high temperatures, an average 180 °C in the presence of air and water vapor released from the fried food. This process causes decreased content of polyunsaturated fatty acids with consequent increase in the content of saturated fatty acids, and other reactions.6
Figure 3. Soybean oil electropherograms. (a) soybean A (fresh oil), (b) soybean B (used for intermediate time) and (c) soybean C (used for final time before disposal). 1- C18:0, 2- C18:1c, 3- C16:0, 4- C18:2cc, 5- C18:3ccc and 6- C13:0 (IS). Operationalconditions: injection 5 s × 12.5 mbar, +19 Kv applied voltage, 25 °C cartridge temperature and indirect detection at 224 (± 2) nm, TSH capillary with 48.5 cm long (40 cm effective length) 75 µm I.D. and 375 mm O.D.. Electrolyte: 15.0 mmol L–1 of NaH
2PO4/Na2HPO4 at pH 6.86, 4.0 mmol L–1 of SDBS, 8.3 mmol L–1 of Brij 35, 45% v/v of ACN and
2.1% of 1-octanol.
Table 2. FA levels in soybean oil samples by CZE and GC methods
Soybean oil C18:0
a C18:1 ca C16:0a C18:2a C18:3a
CE GC CE GC CE GC CE GC CE GC
Control 3.66 3.55 20.15 22.96 10.82 10.95 54.14 53.31 5.93 5.98
Intermediate 3.50 3.75 23.88 24.75 12.74 12.31 47.53 50.27 5.43 5.10
Final 3.64 3.98 27.25 29.08 15.12 13.99 40.07 43.90 4.85 4.24
t-test 0.093 0.217 0.266 0.104 0.184
The oil corresponding to the final group had C18: 2cc and C18: 3ccc FA, despite the long frying process and, hence oxidative processes. However, the lipid profile of the oil is also affected by the exchange of fatty acids between the food and the frying medium. Whereas food from animal origin (meat) were used in the frying process, changing the content of C18: 2 may not be as drastic.
TFA was not detected in samples of frying oil, probably because the frying has been used in various food intermittent cycles. Reports in the literature signal that the formation of TFA in frying oils occurs after 10 h under
continuous use and when a single type of food often of vegetable origin has been considered.48,49
In order to check the CE methodology reliability for the FA analysis in biological samples, the Wistar liver rat samples were analyzed in genuine duplicate and the results were compared to the AOCS official GC method Ce 1f-96.39 Table 3 shows statistical results (Shapiro-Wilk
normality test and paired sample t test) for CE and GC. For normality test no significant difference was found for 95% and 99% confidence interval, because p-values found were higher than 0.05 and 0.01, respectively. According to
Table 3. FA levels in Wistar liver rat samples by CZE and GC methods and statistical approaches
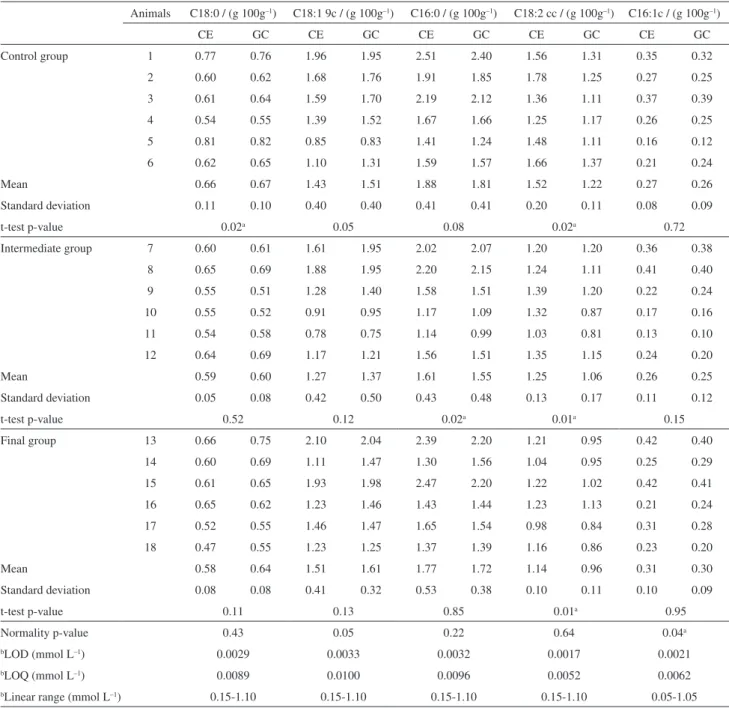
Animals C18:0 / (g 100g–1) C18:1 9c / (g 100g–1) C16:0 / (g 100g–1) C18:2 cc / (g 100g–1) C16:1c / (g 100g–1)
CE GC CE GC CE GC CE GC CE GC
Control group 1 0.77 0.76 1.96 1.95 2.51 2.40 1.56 1.31 0.35 0.32
2 0.60 0.62 1.68 1.76 1.91 1.85 1.78 1.25 0.27 0.25
3 0.61 0.64 1.59 1.70 2.19 2.12 1.36 1.11 0.37 0.39
4 0.54 0.55 1.39 1.52 1.67 1.66 1.25 1.17 0.26 0.25
5 0.81 0.82 0.85 0.83 1.41 1.24 1.48 1.11 0.16 0.12
6 0.62 0.65 1.10 1.31 1.59 1.57 1.66 1.37 0.21 0.24
Mean 0.66 0.67 1.43 1.51 1.88 1.81 1.52 1.22 0.27 0.26
Standard deviation 0.11 0.10 0.40 0.40 0.41 0.41 0.20 0.11 0.08 0.09
t-test p-value 0.02a 0.05 0.08 0.02a 0.72
Intermediate group 7 0.60 0.61 1.61 1.95 2.02 2.07 1.20 1.20 0.36 0.38
8 0.65 0.69 1.88 1.95 2.20 2.15 1.24 1.11 0.41 0.40
9 0.55 0.51 1.28 1.40 1.58 1.51 1.39 1.20 0.22 0.24
10 0.55 0.52 0.91 0.95 1.17 1.09 1.32 0.87 0.17 0.16
11 0.54 0.58 0.78 0.75 1.14 0.99 1.03 0.81 0.13 0.10
12 0.64 0.69 1.17 1.21 1.56 1.51 1.35 1.15 0.24 0.20
Mean 0.59 0.60 1.27 1.37 1.61 1.55 1.25 1.06 0.26 0.25
Standard deviation 0.05 0.08 0.42 0.50 0.43 0.48 0.13 0.17 0.11 0.12
t-test p-value 0.52 0.12 0.02a 0.01a 0.15
Final group 13 0.66 0.75 2.10 2.04 2.39 2.20 1.21 0.95 0.42 0.40
14 0.60 0.69 1.11 1.47 1.30 1.56 1.04 0.95 0.25 0.29
15 0.61 0.65 1.93 1.98 2.47 2.20 1.22 1.02 0.42 0.41
16 0.65 0.62 1.23 1.46 1.43 1.44 1.23 1.13 0.21 0.24
17 0.52 0.55 1.46 1.47 1.65 1.54 0.98 0.84 0.31 0.28
18 0.47 0.55 1.23 1.25 1.37 1.39 1.16 0.86 0.23 0.20
Mean 0.58 0.64 1.51 1.61 1.77 1.72 1.14 0.96 0.31 0.30
Standard deviation 0.08 0.08 0.41 0.32 0.53 0.38 0.10 0.11 0.10 0.09
t-test p-value 0.11 0.13 0.85 0.01a 0.95
Normality p-value 0.43 0.05 0.22 0.64 0.04a
bLOD (mmol L–1) 0.0029 0.0033 0.0032 0.0017 0.0021
bLOQ (mmol L–1) 0.0089 0.0100 0.0096 0.0052 0.0062
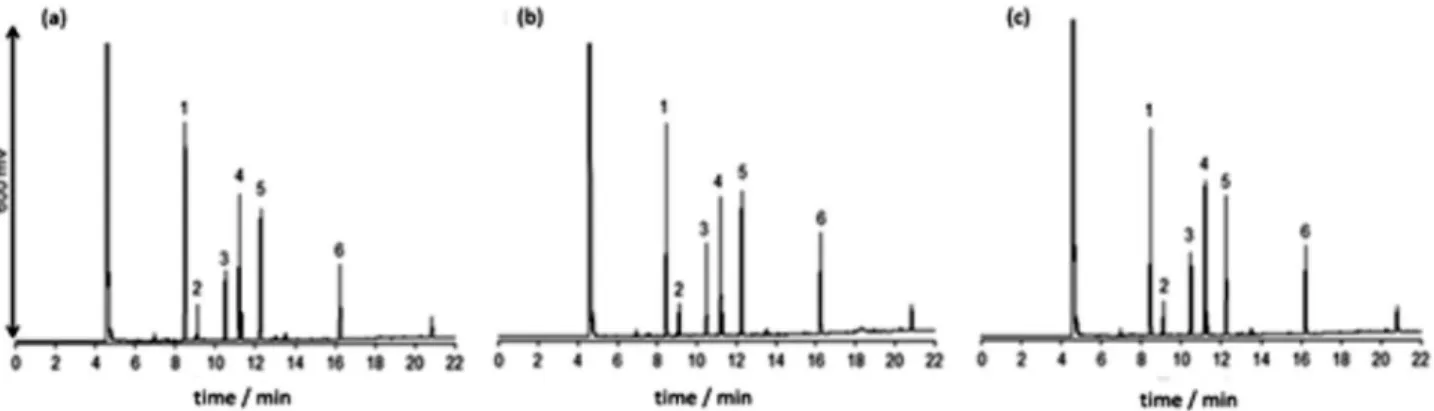
paired sample t test, no evidence of significant difference between the two methodologies were observed in the 95% and 99% confidence interval (p-values found were higher than 0.05 and 0.01, respectively) and Figure 4 shows the liver rat electropherograms obtained through CE analysis and Figure 5 shows the liver rat chromatograms.
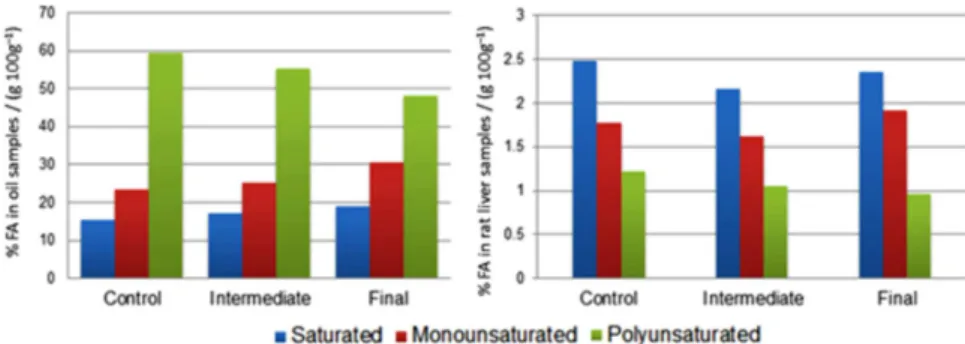
The quality of the oil used for deep frying process of various foods was evaluated by varying the content of the FA. It was observed that the elevated temperature and time of use of the oil resulted in decreased content of polyunsaturated FA (C18: 2ccc and C18: 3ccc) and consequently, increased content of saturated FA (C18: 0 and C16: 0).
The increase of saturated fatty acids is related to fat deposition in the liver of animals fed with used oil in the frying process (SOY OIL C), and the profile of the saturated FA in tissue. Since the essential linoleic acid is not synthesized in the body, the presence of this FA in tissues is a direct consequence of the diet consumption. Thus, there was also a decrease in the content of C18: 2cc (ω-6) in the rat liver, and it was more evident in the liver of final group animals compared to the control group. This decrease in ω-6 content can damage the production of eicosanoids
compounds; it is known that the eicosanoids have various biological activities, such as: modulate the inflammatory response and immune response, and play an important role in platelet aggregation, growth and cell differentiation.50
The graph in Figure 6 summarizes the variation in the content of saturated, monounsaturated and polyunsaturated FA in oil and rat liver samples.
Histological evaluation
Although not having analyzed the total fat amount in the tissue studied, it is found in Figure 4 that the presence of vesicles of fat, which are increased in the tissue of the animals of both intermediate and final group. The samples were evaluated in zones 1, 2 and 3, according to the criteria: vasodilation (sinusoidal capillaries and venules), stasis (sinusoidal congestion of capillaries and venules), intracellular accumulation (glycogen/lipid), inflammatory infiltration, hepatocyte necrosis and focal fibrosis.51 Through
Figure 4. Histological assessment and fatty acids electropherograms obtained from liver rat (histological slides with increased 400X - Hepatic venule is highlighted X and portal tract is highlighted*). (a) Control group, (b) Intermediate group and (c) Final group. Peaks identified in electropherograms: 1-C18:0, 2-C18:1c, 3-C16:0, 4-C18:2cc, 5-C16:1c and 6-C13:0 (IS). CE operational conditions: injection 5 s × 12.5 mbar, +19 Kv applied voltage, 25 °C cartridge temperature and indirect detection at 224 (± 2) nm, TSH capillary with 48.5 cm long (40 cm effective length) 75 µm I.D. and 375 mm O.D., electrolyte: 15.0 mmol L–1 of
NaH2PO4/Na2HPO4 at pH 6.86, 4.0 mmol L–1 of SDBS, 8.3 mmol L–1 of
Brij 35, 45% v/v of ACN and 2.1% of 1-octanol.
Figure 5. Fatty acids chromatograms obtained from liver rat. (a) Control group, (b) Intermediate group and (c) Final group. 1-C16:0, 2-C16:1c, 3-C18:0, 4-C18:1c, 5-C18:2cc and 6-C22:1c. Operational conditions:split/spitless injector, operated with a split ratio of 1:10, and a capillary column HP-88 (88% Cianopropylaryl 60 m × 0.250 mm I.D. × 0.20 µm film thickness). Helium as carrier gas at flow rate 1 mL min–1. Temperatures of injector and detector
analysis of histological slides; it could be inferred that in the samples from the control group, characteristics compatible with normality were observed, as shown in Figure 4a. However, one of the samples of the control group exhibited mild vasodilation without pathological significance. Moreover, the intermediate group (Figure 4b), discrete vasodilation was observed in all samples, especially more prominent in zone 3, and intracellular accumulation in zone 1 and zone 2 portion. Finally, in the final group, as highlighted in Figure 4c, the samples exhibited intracytoplasmic accumulation throughout the length of the hepatic lobule (zones 1, 2 and 3) and, in some samples, it was slightly more intense vasodilation observed in relation to the intermediary group, also in all zones. Thus, one can notice that in any sample there was progression to chronic hepatitis nonspecific as well as areas of necrosis and fibrosis. However, evidence shows that there could be development of inflammation in tissues final group if the diet continued to be administered for a longer period of time.
It is known that the fat diet and with high proportion of saturated fatty acids can lead to hepatic fat deposition, with the risk of developing diseases. In the present study, this relationship was observed, when considering a diet adequate in lipids quantitatively, but qualitatively compromised by the long period prescribed for heating the frying medium.
Lipoprotein analysis
According to values of lipoproteins described in Table 4, increases in total cholesterol and LDL can be observed, and the decreased level of high density lipoprotein (HDL) are
directly related to the quality of the diet fed to the animals. This may be due to the increased content of saturated fatty acids and decrease of polyunsaturated fatty acids in the oil as it is exposed to a deep frying process, as shown in Table 2. Another time, the relationship between diet quality and impact on the nutritional status of the animals in relation to lipoproteins was confirmed. These measures are useful in diagnostic risk of cardiovascular disease.
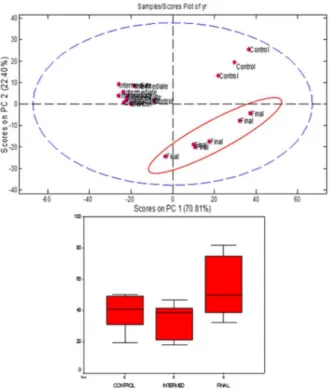
Principal components analysis in electropherograms obtained from rats’ liver
In order to evaluate the behavior of the three groups of animal experimental model used, a study involving principal component analysis (PCA) was performed, shown in Figure 7. In the present case, the total of eighteen electropherograms (objects) obtained from experimentation was used in PCA calculation resulting in total percentage explained to 93.21% for the two first principal components (PC1 and PC2). Through analysis of the score plot, it was observed that the final group (lineate) remained separated in comparison with the other groups (control and intermediate groups). In other words, the results indicate that the final group can be considered to be a risk group with more predispositions to develop cardiovascular disease. In addition to PCA results, the LDL Box-Plot analysis was plotted and indicated that LDL medium value to the final group was higher than the control and intermediate groups, indicating that the total exposure time of the oil submitted to deep frying processes can be considered relevant to evaluating the oil quality. Therefore, it can be concluded that as more intense the exposure time of the oil in the
Figure 6. Graphs of the variation in the content of saturated, monounsaturated and polyunsaturated FA in oil and rat liver samples.
Table 4. Lipoproteins values to Wistar rats
Groups HDL / (mg dL–1)a LDL / (mg dL–1)a Total cholesterol / (mg dL–1)a
Control 88.31 38.66 141.81
Intermediate 80.46 34.15 127.88
Final 78.99 54.65 148.53
Figure 7. Principal component analysis (PCA) scores and low density lipoprotein (LDL) box plot.
frying process, the higher will be the alteration caused in the animal tissue (liver), according to what was demonstrated previously in Figure 4.
Conclusion
An alternative CZE methodology optimized for FA analysis in biological tissues was successfully demonstrated. The methodology present simplicity, acceptable efficiency, short analysis time, low cost, absence of derivatization step in sample preparation, low sample amount for analysis and high throughput in comparison with the GC official method, since no significant differences were observed within 95% confidence interval. Thus, taking into account the advantages presented, the CZE methodology can be an interesting analytical tool to FA analysis in biological research. In the present work, the CZE methodology optimized allowed to monitoring the metabolic alterations in Wistar rats liver according to the lipid content offered in the diet. The promising results presented encourage us to begin research involving monitoring of FA in human blood serum in order to try to relate it to diagnostic of diseases.
Acknowledgements
The authors wish to thank Conselho Nacional de Desenvolvimento Científico e Tecnológico
(CNPq-475055/2011-0 and 301689/2011-3), Fundação de Amparo à Pesquisa do Estado de Minas Gerais of Brazil (FAPEMIG-CEX APQ 02420-11 and CEX-PPM 00205-11), Center for Reproductive Biology-UFJF and Coordenação de Aperfeiçoamento de Pessoal de Nível Superior (CAPES) for fellowships and financial support.
References
1. Berquin, I. M.; Edwards, I. J.; Chen, Y. Q.; Cancer Letters2008,
269, 363.
2. Elvevoll, E. O.; Eilertsen, K. E.; Brox, J.; Dragnes, B. T.; Falkenberg, P.; Olsen, J. O.; Kirkhus, B.; Lamglait, A.; Osterud, B.; Atherosclerosis2008, 200, 396.
3. Wang, D.; Wei, Y.; Schmoll, D.; Maclean, K. N.; Pagliassotti, M. J.; Endocrinology2006, 147, 350.
4. Mattson, F. H.; Grundy, S. M.; J. Lipid Res.1985, 26, 194. 5. Burenjargal, M.; Totani, N.; J. Oleo Sci.2009, 58, 1. 6. Choe, E.; Min, D. B.; J. Food Sci.2007, 72, 77.
7. Farhoosh, R.; Moosavi, S. M. R.; Anal. Chim. Acta. 2008, 617, 18.
8. Lamboni, C.; Sébédio, J.-L.; Perkins, E. G.; Lipids1998, 33, 675.
9. Cortez-Pinto, H.; Moura, M. C.; Day, C. P.; J. Hepatol.2006,
44, 197.
10. Report of an Expert Consultation, Office of Knowledge Exchange, Research and Extension; Summary of Conclusions and Dietary Recommendations on Total Fat and Fatty Acids, In
Fats and Fatty Acids in Human Nutrition; Food and Agriculture
Organization of the United Nations (FAO): Rome, 2010. 11. Ichihara, K.; Waku, K.; Yamaguchi, C.; Saito, K.; Shibahara, A.;
Miyatani, S.; Yamamoto, K.; Lipids2002, 37, 523. 12. Lepage, G.; Roy, C. C.; J. Lipid Res.1984, 25, 1391. 13. Bailey-Hall, E.; Nelson, E. B.; Ryan, A. S.; Lipids2008, 43,
181.
14. Jordi, H. C.; J. Liq. Chromatogr.1978, 1, 215. 15. Al-Alawi, A.; Voort, F. R. V.; JAOCS 2004, 81, 441.
16. Voort, F. R. V. D.; Ismail, A.; Sedman, J.; JAOCS.1995, 72, 873.
17. Mossoba, M. M.; Yurawecz, M. P.; McDonald, R. E.; JAOCS 1996, 73, 1003.
18. Gallaher Jr., D. L.; Johnson, M. E.; Anal. Chem.2000, 72, 2080. 19. Wang, T.; Wei, H.; Liz, S. F. Y.; Electrophoresis 1998, 19, 2181. 20. Castro, P. M.; Barra, M. M.; Ribeiro, M. C. C.; Aued-Pimentel, S.;
Silva, S. A.; Oliveira, M. A. L.; J. Agric. Food Chem.2010, 58, 1403.
21. Oliveira, M. A. L.; Micke, G. A.; Bruns, R.; Tavares, M. F. M.;
J. Chrom. A.2001, 924, 533.
22. Oliveira, M. A. L.; Solis, V. S.; Gioelli, L. A.; Polakiewicz, B.; Tavares, M. F. M.; Electrophoresis2003, 24, 1641.
24. Barra, P. M. C.; Barra, M. M.; Azevedo, M. S.; Fett, R.; Micke, G. A.; Costa, A. C. O.; Oliveira, M. A. L.; Food Control 2012,
23, 456.
25. Porto, B. S. L.; Souza, M. V. N.; Oliveira, M. A. L.; Anal. Sci. 2011, 27, 541.
26. Collet, J.; Gareil, P.; J. Chrom. A.1997, 792, 165. 27. Gareil, P.; Collet, J.; J. Capillary Electrop.1996, 3, 77. 28. Surowiec, I.; Kamla, I.; Kenndler, E.; J. Chrom. A.2004, 1024,
245.
29. Oliveira, M. A. L.; Lago, C. L. D.; Tavares, M. F. M.; Quim. Nova.2003, 26, 821.
30. Liu, X.; Cao, Y.; Chen, Y.; J. Chrom. A. 2005, 1095, 197. 31. Bohlin, M. E.; Ohman, M.; Hamberg, M.; Blomberg, L. G.;
J. Chrom. A.2003, 985, 471.
32. Barra, P. M. C.; Castro, R. J. C.; Oliveira, P. L.; Aued-Pimentel, S.; Silva, S. A. D.; Oliveira, M. A. L.; Food Res. Int.2013, 52, 33. 33. Oliveira, M. N. S. D.; Gusmão, E.; Lopes, P. S. N.; Simões,
M. O. M.; Ribeiro, L. M.; Dias, B. A. S.; Rev. Bras. Frutic. 2006, 28, 380.
34. Castro, R. J. C.; Sobrinho, F. S.; Gama, M. A. S.; Barra, P. M. C.; Antoniassi, R.; Oliveira, M. A. L.; Cent. Eur. J. Chem. 2013,
11, 286.
35. Reeves, P. G.; Nielsen, F. H.; Fahey Jr., G. C.; J. Nutr.1993,
123, 1939.
36. Bourre, J. M.; Francois, M.; Youyou, A.; Dumont, O.; Piciotti, M.; Pascal, G.; Durand, G.; J. Nutr.1989, 119, 1880. 37. Committee for the Update of the Guide for the Care and Use of
Laboratory Animals; Guide for the Care and Use of Laboratory Animals, In Committee for the Update of the Guide for the Care
and Use of Laboratory Animals. ed.; The National Academies
Press: Washington, D.C., USA, 2011.
38. Balesteros, M. R.; Tavares, M. F. M.; Ribeiro, S. J. L.; Polachini, F. C.; Messaddeq, Y.; de Oliveira, M. A. L.; Electrophoresis 2007, 28, 3731.
39. AOCS; Determination of cis- and trans- Fatty Acids in Hydrogenated and Refined Oils and Fats by Capillary GLC.
AOCS Official Method Ce 1f-96 (Reapproved 1997 and revised
2002), Firestone, D. ed.; AOCS Press: Champaign, USA, 1996.
40. Nolan, J. P.; Leibowitz, A. I.; Gastroenterology1978, 75, 445. 41. Bahia, L.; Coutinho, E. S. F.; Barufaldi, L. A.; Abreu, G. A.;
Malhão, T. A.; Souza, C. P. R.; Araujo, D. V.; BMC Public Health2012, 440, 1.
42. Theise, N. D.; Modern Pathol.2007, 20, S3.
43. Albassams, M. A.; Yong, I.; Bhatnagaar, R.; Sham, K.; Prior, M. G.; Vet. Pathol.1987, 24, 427.
44. Zenebon, O.; Pascuet, N. S.; Tiglea, P.; Métodos Físico-Químicos Para Análise De Alimentos; Instituto Adolfo Lutz:
Brasília, Brasil, 2005.
45. Metcalfe, L. D.; Schmitz, A. A.; Pelka, J. R.; Anal. Chem.1966,
38, 514.
46. Hartman, L.; Lago, R. A. C.; Lab. Pract.1973, 22, 475. 47. Rome, K., McIntyre, A., Macclesfield, A.; Chrom. Today2012,
May/June, 52.
48. Sanibal, A. A. E.; Filho, J. M.; Ciênc. Tecnol. Aliment.2004,
24, 27.
49. Bansal, G.; Zhou, W.; Tan, T. W.; Neo, F. L.; Lo, H. L.; Food Chem.2009, 116, 535.
50. Ricciotti, E.; FitzGerald, G. A.; Arterioscler. Thromb. Vasc. Biol.2011, 31, 986.
51. Thung, S. N.; Gerber, M. A.; Histology for Patologist, Sternberg, S. S. ed.; Raven Press: New York, 1992.
Submitted on: July 25, 2013