Printed version ISSN 0001-3765 / Online version ISSN 1678-2690 http://dx.doi.org/10.1590/0001-3765201720150638
www.scielo.br/aabc | www.fb.com/aabcjournal
Lychee (
Litchi chinensis
Sonn.) peel flour: effects on hepatoprotection
and dyslipidemia induced by a hypercholesterolemic diet
ESTELA R. QUEIROZ1
, CELESTE M.P. DE ABREU1
, DENISE A. ROCHA1
, RAIMUNDO V. DE SOUSA2, RODRIGO M. FRÁGUAS1, MARIANA A. BRAGA1 and PEDRO H.S. CÉSAR1
1
Departamento de Química, Universidade Federal de Lavras / UFLA, Campus Universitário, Caixa Postal 3037, 37200-000 Lavras, MG, Brazil 2
Departamento de Medicina Veterinária, Universidade Federal de Lavras / UFLA, Campus Universitário, Caixa Postal 3037, 37200-000 Lavras, MG, Brazil
Manuscript received on September 17, 2015; accepted for publication on April 15, 2016
ABSTRACT
Dyslipidemias are associated with the incidence of cardiovascular diseases, obesity, diabetes, hypertension
and hepatic steatosis, being the cause of morbidity and mortality. This study investigated the effects of lychee peel flour (PF) on serum levels of total cholesterol (TC), low-density lipoprotein (LDL-c),
triacylglycerols (TAG) and various parameters related to obesity, in rats fed a hypercholesterolemic diet.
Therefore, 20 male rats were used. In the first 21 days, the animals were fed a hypercholesterolemic diet, except for control group. In the following 21 days, their diets were modified, and they received a standard diet
(Control); hypercholesterolemic (Hyper); hypercholesterolemic + 5% PF (PF5) and hypercholesterolemic + 10% PF (PF10). The results revealed that PF intake attenuated weight gain, reduced body mass index, glucose and the levels of TAG, TC, LDL-c, hepatic enzymes and leptin, besides the percentage of hepatic lipids, liver lipid peroxidation and frequency of severe steatosis. Histological studies of the aorta did not show the formation of the atheromatous plaque. These results reinforce its potential to reduce the risk of diseases associated with obesity.
Key words: cholesterol, lipid peroxidation, steatosis, triacylglycerol, weight gain.
Correspondence to: Estela de Rezende Queiroz E-mail: estelaqueiroz@yahoo.com.br
INTRODUCTION
Disorders in cholesterol and lipid metabolism are called dyslipidemias or hyperlipidemias, and may be associated with the incidence of cardiovascular diseases, obesity, diabetes, hypertension and hepatic steatosis, being the major causes of morbidity and mortality (Abdel-Sattar et al. 2011). Developed and developing countries have witnessed a steady
increase in the prevalence of hyperlipidemias,
predominantly related to lifestyle changes, which
associate insufficient physical activity and a high
intake of foods high in calories and fat (Colagiuri
2010), culminating in a significant increase in cases
of obesity and cardiovascular diseases (Miller et
al. 2015). This increase, as well as the oxidative
damage caused by free radicals, are considered
etiologic factors related to various human chronic
Hyperlipidemia is primarily characterized by an increase in the levels of total cholesterol (TC), triacylglycerols (TAG) and low-density lipoprotein (LDL-c), along with a decrease in high-density lipoprotein (HDL-c) (Chen et al. 2014). The treatment of hyperlipidemia involves diet, exercise and drug therapy. However, the possibility of reducing the risk of diseases through diet has attracted the attention of both
the scientific community and the pharmaceutical
and food industries. In this context, plant foods are given special attention, since they are a source of biologically active substances, which can have hypoglycemic, hypolipidemic and antioxidant
effects (Zhao et al. 2012).
Lychee (Litchi chinensis Sonn.) is a subtropical non-climacteric fruit from China, which has been widely spread as an economic culture in subtropical areas of many countries (Jiang et al. 2013), including Brazil. It is much appreciated by consumers around the world due to its attractive appearance, pleasant taste and nutritional value (Queiroz et al. 2015).
In folk medicine and pharmacological studies,
anticancer, anti-inflammatory, antifungal, antiviral,
antioxidant, anticoagulant, antidiabetic, anti-hyperlipidemic, antihyperglycemic, hepato- and cardioprotective activities have been assigned to lychee, its by-products and secondary metabolites (Bhoopat et al. 2011, Xu et al. 2011, Jiang et al. 2013, Huang et al. 2014). The pharmacological properties of lychee peel and seed are assigned to the presence of phytochemicals, such as ascorbic acid and phenolic compounds, including gallic acid, flavonoids (procyanidin B4, procyanidin B2 and epicatechin) and anthocyanins (cyanidin-3-rutinoside, cyanidin 3-glucoside, quercetin-3-rutinoside and quercetin-3-glucoside) (Bhoopat et al. 2011, Xu et al. 2011, Jiang et al. 2013). Research reported the presence of proanthocyanidins,
flavonoids, steroids and sesquiterpenes in lychee
seeds (Xu et al. 2011), which could be used as a
natural antioxidant source, functional ingredient or natural preservative (Prasad et al. 2009). The peel contains large amounts of flavonoids and polyphenols (Jiang et al. 2013), with a high antioxidant activity (Queiroz et al. 2015),
responsible for its pharmacological effects (Jiang
et al. 2013). Even with losses in antioxidant activity due to drying, dried lychee peels have a strong antioxidant activity compared to the fresh
fruit, which allows their use as flour (Queiroz et al.
2015).
Considering the importance of food for health maintenance and the few results on the benefits of the intake of lychee peel flour, this
study investigated the effects of lychee peel flour
(PF) on the serum levels of total cholesterol (TC), low-density lipoprotein (LDL-c), triacylglycerols (TAG) and various parameters related to obesity, in rats fed a hypercholesterolemic diet.
MATERIALS AND METHODS
FRUIT HARVEST AND PREPARATION OF LYCHEE PEEL FLOUR
Lychee fruits from the Sapindaceae family, Bengal cultivar, were harvested in an experimental orchard located in Lavras, Minas Gerais, 2012/2013 harvest, and selected according to color uniformity (red-intense peel), absence of defects and average weight of 16 g. The selected fruits were washed, sanitized with 200 µL/L sodium dichloroisocyanurate for 15 min, weighed and separated into peel, pulp and seed. The peel was dried in an oven at 45°C for four days, until constant weight. It was then ground
in a TECNAL mil, and lychee peel flour (PF) was
obtained, which was stored protected from light until the time of analysis.
CHEMICAL COMPOSITION OF LYCHEE PEEL FLOUR
and water. After an adjustment period of seven days, the animals were randomly divided into two groups: (a) normocholesterolemic animals fed a standard diet AIN-93G (n=5) and (b) animals fed a hypercholesterolemic diet (cholesterol 0.07%, cholic acid 0.03% and lard 3.5%) (n=15), for 21 days. In the following 21 days, the animals were
subdivided into five groups and fed the diets:
- Control group (n=5): standard diet AIN-93G
normocholesterolemic,
- Hyper group (n=5): hypercholesterolemic diet,
- PF5 group (n=5): hypercholesterolemic diet
added with 5% lychee peel flour.
- PF10 group (n=5): hypercholesterolemic diet
added with 10% lychee peel flour.
The concentrations of 5 and 10% were chosen,
since they can significantly contribute to fibers and
phenolic compounds.
The diets were prepared according to Reeves et al. (1993) of the American Institute of Nutrition (AIN); however, some modifications related to source and concentration of lipids and carbohydrates were performed, following the standard AIN- 93G . The addition of 3.5% lard to the diets, which increased cholesterol, occurred at the expense of 3.5% soybean oil. The diets of the groups that received lychee peel flour were submitted at the expense of part of the carbohydrate source (dextrin), as shown in Table I.
In vivo ASSAY
The animals were weighed with a Bel Engineering® digital scale, on the day of the experiment installation (day 0), and every other day until the end of the experiment (day 42). The naso-anal distance (length) was determined weekly. Body weight and naso-anal distance were used to determine the following anthropometrical parameters: Body mass index (BMI) = body weight (g) / length2 (cm2) and Lee index = cube root of body weight (g) / naso-anal distance (cm) (Novelli et al. 2007).
proposed by the AOAC (2012), and dietary fiber,
determined using enzymatic kit Sigma®, followed the technique proposed by the AOAC (2012). The total energy value (TEV) was calculated as the sum of calories provided by carbohydrates, lipids and proteins, multiplying their values in grams by the Atwater factors: 4 kcal, 9 kcal and 4 kcal, respectively.
DETERMINATION OF PHYTOCHEMICALS IN LYCHEE PEEL FLOUR
Phenolic compounds were extracted with 50% methanol using a reflux condenser for three consecutive times, at 80°C. The extracts were dosed using the Folin-Denis reagent at 760 nm (AOAC 2012). The results were expressed in mg gallic acid equivalents/100 g sample. Flavonoids were
extracted with 80% methanol in a reflux condenser at 80°C, and quantified by UV-VIS spectroscopy
at 510 nm (Zhishen et al. 1999), using rutin as a standard. Total anthocyanins were determined by the method of Fuleki and Francis (1968). They were
extracted in 95% methanol, acidified with 1.5 M
hydrochloric acid at the ratio 85:15 v/v for 24 h under
cooling, quantified by UV-Vis spectrophotometry
and expressed in g cyanidin 3-glucoside/100 g sample. Ascorbic acid was extracted in 0.5% oxalic acid, added with 0.1 g kieselguhr for 15 min under
agitation in an ultrasonic bath, and quantified by
spectrophotometry, according to Strohecker and Henning (1967).
ANIMALS AND DIETS
TABLE I
Percent composition of the four diets characterized by the different treatments administered to the experimental
animals.
Ingredients
Groups
Control Hyper PF5 PF10 (g/100g)
Corn starch 39.489 39.389 39.389 39.389 Casein 20.000 20.000 20.000 20.000 Dextrin 13.200 13.200 8.200 3.200 Sucrose 10.000 10.000 10.000 10.000 Soybean oil 7.000 3.500 3.500 3.500
Pork fat -- 3.500 3.500 3.500
Cellulose 5.000 5.000 5.000 5.000 Mineral pre-mix
AIN-93G 3.500 3.500 3.500 3.500 Vitamin pre-mix
AIN-93G 1.000 1.000 1.000 1.000 L-cystine 0.300 0.300 0.300 0.300 Choline bitartrate 0.250 0.250 0.250 0.250
Cholesterol +
cholic acid (7:3) -- 0.100 0.100 0.100 DL-methionine 0.160 0.160 0.160 0.160 Vitamin E 0.100 0.100 0.100 0.100
BHT 0.001 0.001 0.001 0.001
Lychee peel flour -- -- 5.000 10.000
Diet (total in
grams) 100.00 100.00 100.00 100.00 Calories (kcal/g) 3.39 3.39 3.38 3.38
The daily food intake was measured by the
difference between the offered diet and leftovers and used to calculate feed efficiency, dividing weight
gain (g) by food intake (kcal) (Levin et al. 1986). Blood glucose was measured weekly, with the aid of a Breeze 2® machine, using glucotest strips, by the glucose oxidase method. Therefore, blood samples were collected from the tail of the animals after a 12 h fasting on days 0, 7, 14, 21, 28, 35, and 42.
EUTHANASIA OF ANIMALS AND SAMPLE COLLECTION
At the end of the experiment, all animals were
subjected to fasting for 12 h before sacrifice. The
animals were anesthetized with sodium thiopental, intraperitoneally, at a dose of 40 mg/kg body weight. The blood was collected by cardiac puncture, which caused death by exsanguination under anesthesia, and the blood samples were centrifuged at 3000 x g for 10 min, for the obtention of the serum.
After euthanasia, the liver and the thoracic aorta of the animals were removed, weighed and, from the weight of the liver, the percentage of liver weight/body weight was calculated on the day of euthanasia. The aorta and a fraction of the liver were subjected to histological analysis after removal, and the remainder was frozen and used for further analyses.
DETERMINATION OF SERUM LIPID PARAMETERS
Total serum cholesterol (TC), triacylglycerol (TAG), and high-density lipoprotein (HDL-c) were measured using commercial kits (Labtest Diagnóstica, Minas Gerais, Brazil). In the analysis of HDL-c, low-density lipoprotein (LDL-c), very low-density lipoprotein (VLDL-c) and chylomicrons in serum were precipitated and the concentration of cholesterol in the HDL-c fraction was determined using the commercial kit for TC assays (Labtest Diagnóstica, Minas Gerais, Brazil). These parameters were determined in duplicates.
LIVER TOTAL LIPIDS
The percentage of total lipids was determined according to the AOAC (2012). The minced livers were defatted with a cellulose cartridge, in a Soxhlet apparatus, using ethyl ether as a solvent. The results were expressed as percentage of lipids
DETERMINATION OF THE ACTIVITY OF THE ENZYMES ASPARTATE AMINOTRANSFERASE (AST), ALANINE AMINOTRANSFERASE (ALT) AND GAMMA GLUTAMYL TRANSFERASE (GGT) IN THE SERUM
The activities of AST, ALT and GGT in the serum were determined using commercial kits (Labtest Diagnóstica, Minas Gerais, Brazil), following the manufacturer’s instructions.
DETERMINATION OF LEPTIN
Serum levels of leptin were measured by enzyme-linked immunosorbent assay (ELISA), using a commercial kit (BioVendor, Asheville, USA).
DETERMINATION OF LIPID PEROXIDATION
Liver lipid peroxidation was determined by the formation of thiobarbituric acid-reactive substances (TBARS), according to Winterbourn et al. (1985). The results were expressed in µmols MDA/mg fresh liver.
HISTOPATHOLOGICAL ANALYSIS
For the histopathological study, aorta and liver
tissues were placed in formol for 24 h, fixed in buffered formalin, dehydrated in graded alcohol, diaphanized in xylene and embedded in paraffin.
One liver fragment of each rat was used. The blocks were then sectioned in a microtome (5
μm) and histological sections were stained with hematoxylin-eosin solution (HE). Hepatic steatosis
was classified in 4 different levels: 0- absence of
steatosis, 1- mild, 2- moderate, 3- severe, according to the histological features disclosed in the majority of the liver tissue (Melo et al. 2008).
EXPERIMENTAL DESIGN AND STATISTICAL ANALYSIS
The experimental design was completely randomized (CRD). The lychee peel flour was analyzed in four replicates and the results were expressed as mean ± standard deviation. The in
vivo assay consisted of four treatments (Control,
Hyper, PF5 and PF10) and five animals for each
treatment. The results underwent variance analysis and to the Scott-Knott test at 5% probability, using the statistical software Sisvar (Ferreira 2011).
RESULTS AND DISCUSSION
CHEMICAL AND PHYTOCHEMICAL COMPOSITION OF THE LYCHEE PEEL FLOUR
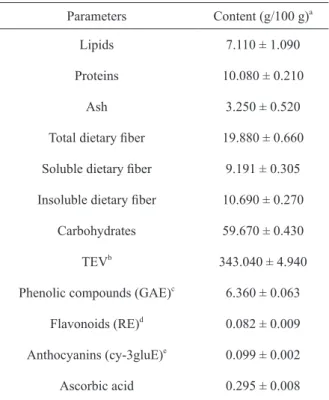
The chemical and phytochemical composition and the total energy value (TEV) of PF are shown in Table II. Brazilian law provides that the maximum humidity limit for wheat flour is 15% (Brasil 2005), therefore, the PF presented a low moisture content (6.10 ± 0.14%), which is important for its conservation, since it prevents microbial growth, as well as chemical and enzymatic reactions. The contents of carbohydrates and TEV were high (59.67 ± 0.43 g/100 g and 343.04 ± 4.94 kcal/100 g, respectively) and a low content of proteins and lipids was observed. It is noteworthy that
the PF contains 19.88 g/100 g dietary fiber. The Reference Daily Intake (RDI) is 25 g fiber (Food
and Drug Administration 2015); thus, the PF may be considered a potential fiber source, since it
contributes significantly to the RDI.
In this study, from the total fiber content in the PF, about 46% (9.191 g/100 g) is soluble
fiber, and 54% (10.690 g/100 g) is insoluble. The
insoluble portion increases satiety and improves
intestinal transit. Soluble fiber, which correspond
to 46.25% of total PF fibers, play an important role in the control of cholesterol absorption and, therefore, it is indicated for therapeutic purposes and in the control of dyslipidemia (Sposito et al.
2007). The high concentration of soluble fiber in
the PF contributes to the adjustment of the diet, since it is common to reach the insoluble fiber
recommendation without reaching the soluble fiber
to those reported by Queiroz et al. (2012), who
obtained contents of total and soluble fiber of 18.21
and 8.24 g/100 g, respectively, in dry lychee peel. Among the phytochemicals observed in the PF, phenolic compounds and ascorbic acid (6.360 ± 0.063 and 0.295 g/100 g, respectively) stand out. Even present in lower concentrations, the PF also presents significant levels of anthocyanins and
flavonoids, known for their antioxidant activity.
Evidence suggests that phenolic compounds present in plants have beneficial effects in the prevention of obesity (Chuang and Mcintosh 2011, Sergent et al. 2012, Sreerama et al. 2012). In vitro experiments show that extracts of plants and fruits rich in polyphenols are capable of inhibiting pancreatic lipase, a key enzyme responsible for the degradation of dietary triacylglycerols into
monoacylglycerol and free fatty acids, in order to be absorbed by the enterocyte. Thus, the inhibition of pancreatic lipase may result in a reduced fat absorption, attenuating obesity (Sergent et al. 2012). Therefore, since it is a source of phenolic compounds, the PF has the potential to be used in the development of functional foods or supplements, which may contribute to the prevention of obesity, despite its bioavailability was not evaluated in this study.
GENERAL CHARACTERISTICS OF THE ANIMALS, SERUM PROFILE AND MARKERS OF LIVER DYSFUNCTION AND INJURY
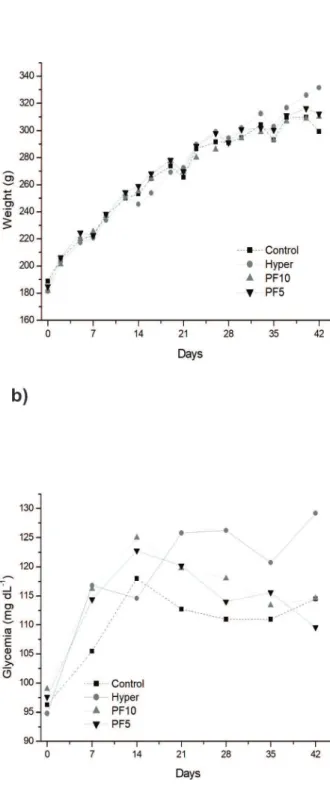
Fig. 1 and Table III show the general characteristics of the animals treated with normocholesterolemic (Control) and hypercholesterolemic (Hyper, PF5 and PF10) diets. There was no significant difference in feed consumption throughout the
treatment, among the analyzed groups (p≥0.05).
Although some studies have reported an increase in satiety and a reduction in appetite after the
consumption of diets high in fiber, the results of the
present study showed no association between the consumption of PF and the reduction in the amount of food ingested. This behavior was also observed
by Eufrásio et al. (2009), who evaluated the effect
of different types of fibers on lipid fractions of rats fed a hypercholesterolemic diet, and found no reduction in feed intake for animals fed diets
enriched with fibers.
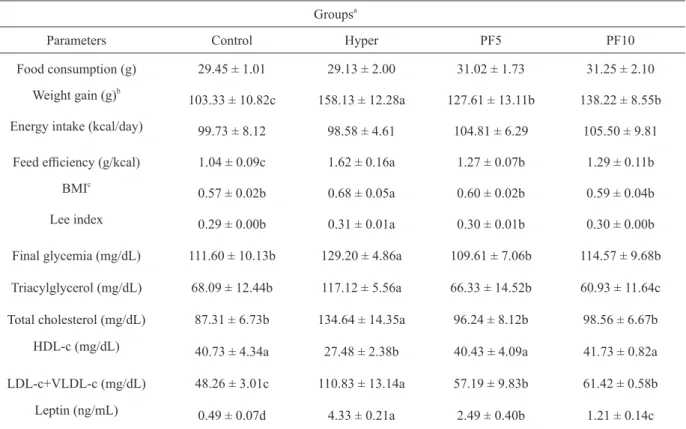
However, the animals fed the PF had a weight gain significantly lower than the Hyper group, indicating that the consumption of PF decreases the
absorption efficiency of nutrients. Although there is no statistical difference between the amount of energy intake by the groups, feed efficiency, that
is, the conversion of calories into body weight, was higher in the Hyper group (1.6 ± 0.2 kcal/g) than in animals treated with the PF (1.3 ± 0.03 and 1.3 ± 0.1 g/kcal for PF5 and PF10, respectively). Even if they have been fed a diet rich in cholesterol, the TABLE II
Chemical and phytochemical composition of lychee peel flour.
Parameters Content (g/100 g)a
Lipids 7.110 ± 1.090
Proteins 10.080 ± 0.210
Ash 3.250 ± 0.520
Total dietary fiber 19.880 ± 0.660
Soluble dietary fiber 9.191 ± 0.305
Insoluble dietary fiber 10.690 ± 0.270
Carbohydrates 59.670 ± 0.430
TEVb 343.040 ± 4.940
Phenolic compounds (GAE)c 6.360 ± 0.063 Flavonoids (RE)d 0.082 ± 0.009 Anthocyanins (cy-3gluE)e
0.099 ± 0.002 Ascorbic acid 0.295 ± 0.008 a
Data represent the mean ± standard deviation (n = 4). b
TEV, Total energy value, expressed in kcal/100g. c
GAE, gallic acid equivalents. d
RE, rutin equivalents. e
intake of PF contributed to a lower use of lipids and/or calories from the diet, resulting in a lower weight gain. Fernandez et al. (2002) also found no
significant differences in the ingested amount of diets with different fiber concentrations; however, they observed a significantly lower weight gain in groups fed higher fiber concentrations.
As a result, BMI (Table III) differed significantly between the groups and, in the animals of the Hyper group, a value higher than those obtained in the groups treated with the PF was observed. Once the growth pattern observed in the animals of all groups was similar (Fig. 1a and Table III). The BMI for normal adult rats ranges between 0.45 to 0.68 g cm-2 (Novelli et al. 2007). Thus, while animals of PF group were with normal BMI, the animals of Hyper group had tendency to overweight, getting the normal BMI limit. Despite
the differences in BMI, no significant differences
were observed in the Lee index (Table III). The Lee index, in this study, was similar to that reported by Novelli et al. (2007), who obtained an index of 0.31 ± 0.02 in rats fed a hypercaloric diet during 30 days. Almeida et al. (2015) observed, in rats fed
different concentrations of ora-pro-nobis flour, that
the group that received the hypercaloric diet with the replacement of 10% of the total food energy by
ora-pro-nobis flour had the lowest Lee index , when
compared to the groups fed 5% of the total food
energy by ora-pro-nobis flour and the hipercaloric
control, whose values were 0.280, 0.293, 0.306, respectively, demonstrating that 10% of
nobis flour is more effective than 5% of ora-pro-nobis flour. In this study, no significant differences
were observed in the Lee index of the groups PF5 and PF10.
The blood glucose of animals treated with the PF was lower than that observed in the Hyper group, from the 21st day of treatment (Fig. 1b) and, at 42
days, the final glycemia in animals treated with the PF was significantly lower than that of the animals
in the Hyper group (Table III), which shows the
potential of the PF in the control of glycemia. Lima et al. (2012) also observed that the consumption of the mesocarp of Passiflora nitida Kunth
(“maracujá-do-mato”) flour had a hypoglycemic effect, and they attribute this effect to the presence of fibers, which form a gel in the intestinal wall,
changing the absorption of glucose, improving the tolerance to it and providing a decrease in serum glucose. Thus, the reduction in glucose observed
in this study is probably due to the fiber present in
the PF.
High levels of TC, LDL-c and TAG are directly associated with the risk prognosis of coronary atherosclerosis, ischemic heart disease and heart attack, while HDL-c has a protective effect against these disorders (Sposito et al. 2007). The
serum profile (Table III) showed that the animals
of the Hyper group fed the high-cholesterol diet presented, in relation to the Control group, a
significant increase in the levels of TC (134.6 ±
14.3 and 87.3 ± 6.7 mg/dL) and TAG (117.1 ± 5.6 and 68.1 ± 12.4 mg/dL), respectively, indicating that the model used is able to induce dyslipidemias.
The consumption of PF significantly reduced the
serum levels of TC and LDL-c+VLDL-c; however, the concentrations of 5 and 10% PF caused similar reductions. In these groups, the serum levels of TC
and HDL-c did not differ from those observed in the
Control group (without the addition of cholesterol), which shows the potential of PF in the control of hypercholesterolemia. The consumption of PF also reduced TAG levels, and the lowest TAG levels were observed in animals fed PF10 (60.9 ± 11.6 mg/dL).
The synthesis of cholesterol in the organism is a complex process in which several steps are involved. One of the regulation points of this synthesis is the conversion of mevalonate to
excretion of bile acids and neutral steroids (Vadder
et al. 2014), the intake of dietary fiber affects the
colon microbiota and its subsequent products, increasing the concentrations of short chain fatty acids (SCFA): acetate, propionate and butyrate. It is believed that SCFA play an important role in the control of obesity, since it has been suggested that acetate and butyrate may inhibit the synthesis of cholesterol, and butyrate and propionate may reduce food intake and protect against diet-induced obesity (Lin et al. 2012, Zhong et al. 2015).
Eufrásio et al. (2009) observed that the use
of soluble fibers (pectin and guar gum) prevented
the increase in TC and LDL-c induced by a hypercholesterolemic diet. The results of the present study are similar to those reported by Eufrásio et al. (2009), who demonstrated that the addition of PF (5 and 10%) contributed to the control of various parameters associated with obesity and suggest that
the high fiber content found in PF is the responsible
for this control. On the other hand, lychee peels are also sources of phenolic compounds and several phytochemicals, which have the ability to modulate the metabolism of lipids (Chuang and Mcintosh 2011, Sergent et al. 2012, Sreerama et al. 2012).
Adipose tissue is recognized as an important endocrine organ, releasing several adipokines, proteins capable of acting on various physiological and pathophysiological processes. The production
of adipokines can be regulated by inflammatory
stimuli; however, in case of obesity and metabolic syndrome, this production is changed (Greenberg and Obin 2006, Guimarães et al. 2007, Miao et al. 2015). Obese people exhibit an increased secretion
of inflammatory cytokines related to obesity, such
as leptin, TNF-α and IL-6, and decreased levels of
anti-inflammatory cytokines, such as adiponectin
(Forsythe et al. 2008). Leptin is a protein produced by adipocytes, which plays a central role in the control of appetite and weight in animals and humans. Responsible for the control of food intake and energy expenditure, not only does this hormone
Figure 1 - General characteristics of the animals in the groups: Control (standard diet AIN-93G), Hyper (hypercholesterolemic
diet), PF5 (hypercholesterolemic diet + 5% peel flour) and PF10 (hypercholesterolemic diet + 10% peel flour), for a 42
TABLE III
General parameters and serum profile of animals in the groups: Control (standard diet AIN-93G), Hyper (hypercholesterolemic diet), PF5 (hypercholesterolemic diet + 5% peel flour) and PF10 (hypercholesterolemic diet + 10%
peel flour) for lychee. Groupsa
Parameters Control Hyper PF5 PF10
Food consumption (g) 29.45 ± 1.01 29.13 ± 2.00 31.02 ± 1.73 31.25 ± 2.10 Weight gain (g)b
103.33 ± 10.82c 158.13 ± 12.28a 127.61 ± 13.11b 138.22 ± 8.55b Energy intake (kcal/day) 99.73 ± 8.12 98.58 ± 4.61 104.81 ± 6.29 105.50 ± 9.81
Feed efficiency (g/kcal) 1.04 ± 0.09c 1.62 ± 0.16a 1.27 ± 0.07b 1.29 ± 0.11b
BMIc
0.57 ± 0.02b 0.68 ± 0.05a 0.60 ± 0.02b 0.59 ± 0.04b
Lee index 0.29 ± 0.00b 0.31 ± 0.01a 0.30 ± 0.01b 0.30 ± 0.00b
Final glycemia (mg/dL) 111.60 ± 10.13b 129.20 ± 4.86a 109.61 ± 7.06b 114.57 ± 9.68b Triacylglycerol (mg/dL) 68.09 ± 12.44b 117.12 ± 5.56a 66.33 ± 14.52b 60.93 ± 11.64c Total cholesterol (mg/dL) 87.31 ± 6.73b 134.64 ± 14.35a 96.24 ± 8.12b 98.56 ± 6.67b
HDL-c (mg/dL) 40.73 ± 4.34a 27.48 ± 2.38b 40.43 ± 4.09a 41.73 ± 0.82a
LDL-c+VLDL-c (mg/dL) 48.26 ± 3.01c 110.83 ± 13.14a 57.19 ± 9.83b 61.42 ± 0.58b Leptin (ng/mL) 0.49 ± 0.07d 4.33 ± 0.21a 2.49 ± 0.40b 1.21 ± 0.14c aData represent the mean ± standard deviation (n = 5). Means followed by the same lowercase letter in the rows do not differ by the Scott-Knott test at 5% probability.
bWeight difference between the beginning and end of the experiment. c
BMI, Body mass index.
affect the regulation of neuroendocrine axes, but it also has effects on the central nervous system,
causing changes in psychological functions. High levels of leptin reduce food intake, while low levels induce hyperphagia. However, much increased levels (hyperleptinemia), found mainly in obese people, may indicate a state of leptin resistance and is associated, in this context, to obesity and hyperphagia (Stieg et al. 2015). Blood levels of
leptin were statistically different among the groups
in this study (Table III) and, in the Hyper group, the highest concentration (4.33 ± 0.21 ng/mL) was observed. The animals fed the PF had a serum leptin content lower (2.49 and1.21 ng/mL for PF5 and PF10, respectively) than the animals from the
Hyper group, which suggests that the intake of PF
attenuated leptin secretion by adipocytes. It should
be noted, however, that PF10 was more effective
in reducing the release of this hormone. The lower
weight gain observed in animals fed PF may be
associated with a reduced production of leptin
observed in these groups.
Gosmann et al. (2012) reported that mate
leaf extracts, rich in polyphenols, are capable of
inhibiting the expression of leptin, suggesting that
the polyphenol extract inhibits the storage of lipids
in adipocytes, in part, by suppressing the expression
of various genes related with adipogenesis.
study is probably due to the presence of phenolic compounds in the PF.
Although studies indicate that leptin signaling plays an important role in hypothalamic centers that regulate food intake and adiposity, suggesting its participation in stimulus (Nakazato et al. 2001, Romero and Zanesco 2006), ghrelin, a gastrointestinal hormone, is directly involved in regulating short term energy balance and is one of
the most important flags to the top of food intake
(Pereira et al. 2010). Therefore, further studies
should be conducted to evaluate the effect of PF
intake on ghrelin levels.
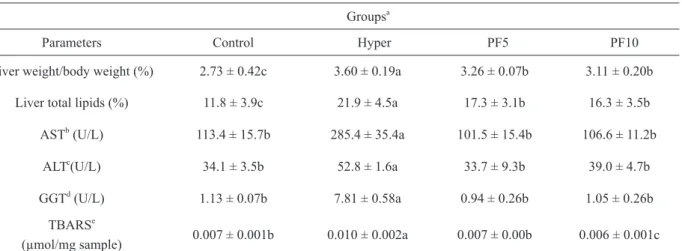
The markers of liver dysfunction and injury of animals in the analyzed groups are shown in Table IV. The percentage of liver weight/body weight indicated that the animals of the Hyper group had
their liver significantly bigger than the animals fed
the PF, showing that the liver damage, caused by the intake of a diet rich in cholesterol, was attenuated
by the ingestion of this flour. In general, high-fat diets significantly increase body and liver weight,
which leads to obesity, hyperlipidemia and hepatic steatosis (Yang et al. 2010). Therefore, animals fed a hypercholesterolemic diet had the highest liver weight/body weight percentages, compared to the Control group. However, the ingestion of PF5 and PF10 resulted in a reduction of 10.28% and 13.61%, respectively, in this ratio, when compared to the Hyper group, which indicates that the consumption of PF caused a lower fat deposition in the liver and resulted in a smaller organ. Therefore, the percent levels of hepatic lipids observed in animals
treated with the PF were significantly lower than
those observed in animals of the Hyper group. This indicates that the PF ingestion attenuated the fatty degeneration in hepatocytes. The results of this experiment are in accordance with Eufrásio et al. (2009), who observed that the intake of soluble
fibers was efficient to avoid the increase of total
lipids in livers of rats fed the hypercholesterolemic diet.
There is a significant difference in the activities of AST, ALT and GGT between the groups (Table IV), which, according to Al-Habori et al. (2002) and Motta (2009), are considered indicators of hepatocellular damage enzymes. Thus, an increase in the activity of AST and, in particular, ALT and GGT, for groups of animals fed hypercholesterolemic diets is probably due to an injury of hepatocytes in the livers of these animals. Therefore, the intake of diets containing the PF (Table IV) attenuated the injury of hepatocytes, resulting in activities of AST, ALT and GGT lower than those observed in the Hyper group, and
without a statistical difference in the Control group.
These results corroborate the data observed for liver weight/body weight percentages and hepatic lipids,
and reinforce the hepatoprotective effect and the
attenuation of fatty degeneration in hepatocytes, caused by the use of the PF. The decrease in the activities of AST and ALT was also observed by Wu et al. (2013) in rats fed a hypercaloric diet,
treated with the aqueous extract of lychee flowers,
and this decrease was attributed to the presence of phenolic compounds in the extract.
Diets with a high concentration of fat
significantly increased the values of thiobarbituric
acid-reactive substances (TBARS) in the liver, which implies lipid peroxidation (Campanella et al. 2014). The increase in TBARS in the liver of animals fed the hypercholesterolemic diet indicates an increased oxidative stress in hepatocytes and results in damage to the liver (Chang et al. 2013). Therefore, the administration of a hypercholesterolemic diet increased the formation of TBARS in the liver of animals; however, it is observed that the groups that consumed the PF had a lower formation of TBARS than the Hyper group (Table IV). It is important to observe that, since the PF is a source of compounds with a high antioxidant activity, as ascorbic acid, phenolic compounds,
flavonoids and anthocyanins (Table II), the animals
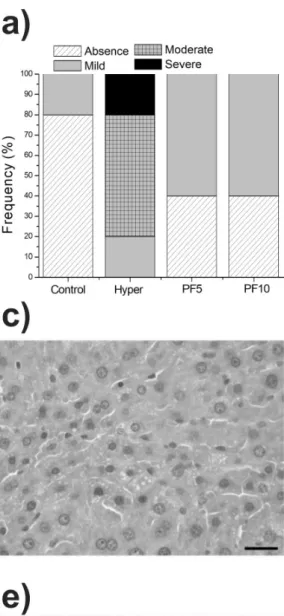
and 20% severe steatosis (Fig. 2e) were observed.
The intake of 5 and 10% PF was equally effective
in the control of steatosis, and the prevalence of mild steatosis (60%) was observed, with no serious cases.
Regardless of the diet provided, the aorta of
the animals showed no evidence of infiltration of inflammatory cells or fat deposition which would
characterize the formation of an atheroma plaque (Fig. 2f), and it is possibly due to the short diet administration period, or to the strain of the animals used in this experiment.
Dimitrova-Shumkovska et al. (2010) observed visible subendothelial changes that indicated the beginning of plaque formation in aorta of rat exposed to high-cholesterol diet (3%) by 18 weeks. Thus, no changes observed in this study for histology aortic is probably due to the strain of the animals used in this experiment, which are resistant to the formation of atheroma plaque, to the short period of diet administration (6 weeks), or to used TABLE IV
Markers of liver dysfunction and injury of animals in the groups: Control (standard diet AIN-93G), hyper (Hypercholesterolemic diet), PF5 (hypercholesterolemic diet + 5% peel flour) and PF10 (hypercholesterolemic diet + 10%
peel flour) for lychee. Groupsa
Parameters Control Hyper PF5 PF10
Liver weight/body weight (%) 2.73 ± 0.42c 3.60 ± 0.19a 3.26 ± 0.07b 3.11 ± 0.20b Liver total lipids (%) 11.8 ± 3.9c 21.9 ± 4.5a 17.3 ± 3.1b 16.3 ± 3.5b
ASTb
(U/L) 113.4 ± 15.7b 285.4 ± 35.4a 101.5 ± 15.4b 106.6 ± 11.2b ALTc
(U/L) 34.1 ± 3.5b 52.8 ± 1.6a 33.7 ± 9.3b 39.0 ± 4.7b
GGTd
(U/L) 1.13 ± 0.07b 7.81 ± 0.58a 0.94 ± 0.26b 1.05 ± 0.26b
TBARSe
(µmol/mg sample) 0.007 ± 0.001b 0.010 ± 0.002a 0.007 ± 0.00b 0.006 ± 0.001c aData represent the mean ± standard deviation (n = 5). Means followed by the same lowercase letter in the rows do not differ by the Scott-Knott test at 5% probability.
b
AST, Aspartate aminotransferase. c
LT, Alanine aminotransferase. d
GT, Gamma glutamyltransferase. e
BARS, thiobarbituric acid-reactive substances in the liver.
that observed in the Control group. These results suggest that the PF increased the in vivo antioxidant capacity and reduced the oxidative stress caused by the intake of a hypercholesterolemic diet, reinforcing the antioxidant and hepatoprotective capacity of the PF.
The frequency of degrees of steatosis and the histological analysis of the liver and aorta of the animals are shown in Fig. 2. The histopathological study showed a vacuolization in the citoplasma
of hepatocytes, and different sizes of fat droplets,
Figure 2 - Frequency of degrees of steatosis and histological analysis of liver and aorta of animals in the groups: Control
(standard diet AIN-93G), Hyper (hypercholesterolemic diet), PF5 (hypercholesterolemic diet + 5% peel flour) and PF10 (hypercholesterolemic diet + 10% peel flour) at the end of 42 days of treatment. (a) frequency of degrees of steatosis, (b) absence of steatosis, (c) mild steatosis, (d) moderate steatosis, (e) severe steatosis, (f) aortic arch. Stained with
concentration of cholesterol (0.07% cholesterol, 0.01% cholic acid and 3.5% of lard).
The differences observed in the several
parameters evaluated between the groups PF and
Hyper showed that the ingestion of PF attenuated
weight gain, reduced BMI and assisted in the control of blood glucose and the levels of serum
lipids and leptin, besides resulting in a lower liver
weight/body weight ratio, lower lipid peroxidation
of liver, lower percentage of hepatic lipids and
reducing the frequency of severe steatosis.
In comparison, the concentrations of 5 and
10% PF showed similar results in most assessed
parameters, although the animals fed PF10
had triglyceride and leptin levels lower than those observed in animals fed PF5. However,
it is important to determine if any toxicological
effects can occur from its chronic and sub-chronic
consumption, since evidence indicates that the
relationship between heavy lychee ingestion of by an undernourished child with low glycogen/glucose
probably resulted in toxic hypoglycemic syndrome
(Spencer et al. 2015). Thus, there is a great need
further for studies to examine any harmful effects
resulting from PF consumption by humans.
CONCLUSIONS
At the concentrations used, lychee peel flour
influenced the levels of serum lipids of animals
fed a high-cholesterol diet, helping in the control
of dyslipidemia and hepatic steatosis, which
reinforces its beneficial effects in reducing the risk
of cardiovascular diseases. The administration of 10% lychee peel flour had a better response on
the lipid profile of rats; therefore, this dose can be
established as a reference for future studies, in the
control and prevention of diseases associated with
obesity and dyslipidemia.
ACKNOWLEDGMENTS
The authors would like to thank Conselho Nacional de Desenvolvimento Científico e Tecnológico (CNPq), Coordenação de Aperfeiçoamento de Pessoal de Nível Superior (CAPES) and Fundação de Amparo à Pesquisa do Estado de Minas Gerais (FAPEMIG).
REFERENCES
ABDEL-SATTAR EA, ELBERRY AA, HARRAZ FM, GHAREIB SA, NAGY AA AND GABR SA. 2011. Antihyperglycemic and hypolipidaemic effects of the methanolic extract of Saudi mistletoe (Viscum schimperi
Engl.). J Adv Res 2: 171-177.
AL-HABORI M, AL-AGHBARI A, AL-MAMARY M AND BAKER M. 2002. Toxicological evaluation of Catha edulis leaves: a long term feeding experiment in animals. J Ethnopharmacol 83: 209-217.
ALMEIDA MEF, SIMÃO AA, CORRÊA AD AND FERNANDES RVB. 2015. Improvement of physiological parameters of rats subjected to hypercaloric diet, with the use of Pereskia grandifolia (Cactaceae) leaf flour. Obes Res Clin Pract 15: S1871-403X.
AOAC - ASSOCIATION OF OFFICIAL ANALYTICAL CHEMISTRY. 2012. Official methods of analysis, 19th
ed., Gaithersburg, 3000 p.
B H O O PAT L , S R I C H A I R ATA N A K O O L S , KANJANAPOTHI D, TAESOTIKUL T, THANANCHAI H AND BHOOPAT T. 2011. Hepatoprotective effects of lychee (Litchi chinensis Sonn.): a combination of antioxidant and anti-apoptotic activities. J Ethnopharmacol 136: 55-66.
BRASIL. 2005. Ministério da Agricultura, Pecuária e Abastecimento. Instrução normativa no
8, 02 jun. 2005. Regulamento técnico de identidade e qualidade da farinha de trigo. Diário Oficial da República Federativa do Brasil. 03 jun. 2005. Seção 1, n.105, p. 91.
CAMPANELLA LCA, SILVA AC, FREYGANG J AND MAGRO DDD. 2014. Efeito da suplementação de óleo de cártamo sobre o peso corporal, perfil lipídico, glicídico e antioxidante de ratos wistar induzidos a obesidade. Rev Cienc Farm Basica Apl 35: 141-147.
CHANG YC, YU YH, SHEW JY, LEE WJ, HWANG JJ, CHEN YH, CHEN YR, WEI PC, CHUANG LM AND LEE WH. 2013. Deficiency of NPGPx, an oxidative stress sensor, leads to obesity in mice and human. EMBO Mol Med 5: 1165-1179.
injection on hyperlipidemia rats. J Ethnopharmacol 154: 437-442.
CHUANG CC AND MCINTOSH MK. 2011. Potential mechanisms by which polyphenol-rich grapes prevent obesity- mediated inflammation and metabolic diseases. Annu Rev Nutr 31: 155-176.
COLAGIURI S. 2010. Diabesity: therapeutic options. Diabetes Obes Metab 12: 463-473.
DIMITROVA-SHUMKOVSKA J, VEENMAN L, RISTOSKI T, LESCHINER S AND GAVISH M. 2010. Chronic high fat, high cholesterol supplementation decreases 18 kDa Translocator Protein binding capacity in association with increased oxidative stress in rat liver and aorta. Food Chem Toxicol 48: 910-921.
EUFRÁSIO MR, BARCELOS MFP, SOUSA RV, ABREU WC, LIMA MAC AND PEREIRA MCA. 2009. Efeito de diferentes tipos de fibras sobre frações lipídicas do sangue e fígado de ratos wistar. Cienc Agrotecnol 33: 1608-1614. FERNANDEZ SAV, TANNURI U, DOMIGUES G, UEHARA DY AND CARRAZZA FR. 2002. Efeito de dietas ricas em fibras sobre ratos em crescimento: estudo experimental. Pediatria 24: 32-37.
FERREIRA DF. 2011. Sisvar: a computer statistical analysis system. Cienc Agrotecnol 35: 1039-1042.
F O O D A N D D R U G A D M I N I S T R AT I O N . 2 0 1 5 . Guidance for industry: a food labeling guide. Available in: http://www.fda.gov/food/guidanceregulation/ g u i d a n c e d o c u m e n t s r e g u l a t o r y i n f o r m a t i o n / labelingnutrition/ucm064928.htm. Access: March 29, 2015.
FORSYTHE LK, WALLACE JM AND LIVINGSTONE MB. 2008. Obesity and inflammation: the effects of weight loss. Nutr Res Reviews 21: 117-133.
FULEKI T AND FRANCIS FJ. 1968. Extraction and determination of total anthocyanins in cranberries. J Food Sci 33: 72-77.
GOSMANN G, BARLETTE AG, DHAMER T, ARCARI DP, SANTOS JC, CAMARGO ER, ACEDO S, GAMBERO A, GNOATTO SCB AND RIBEIRO ML. 2012. Phenolic compounds from mate (Ilex paraguariensis) inhibit adipogenesis in 3T3-L1 pre adipocytes. Plant Foods Hum Nutr 67: 156-161.
GREENBERG AS AND OBIN M. 2006. Obesity and the role of adipose tissue in inflammation and metabolism. Am J Clin Nutr 83: 461S-465S.
GUIMARÃES DED, SARDINHA FLC, MIZURINI DM AND CARMO MGT. 2007. Adipocitocinas: uma nova visão do tecido adiposo. Rev Nutr 20: 549-559.
HUANG F, ZHANG R, YI Y, TANG X, ZHANG M, SU D, DENG Y AND WEI Z. 2014. Comparison of physicochemical properties and immunomodulatory activity of polysaccharides from fresh and dried litchi pulp. Molecules 19: 3909-3925.
JESUS AA, OLIVEIRA JB, TERRERI MTRA, FUJIRIRA E, WATASE M, SAMPAIO MG AND SILVA CAA. 2010. Síndromes autoinflamatórias hereditárias na faixa etária pediátrica. J Pediatr 86: 353-366.
JIANG G, LIN S, WEN L, JIANG Y, ZHAO M, CHEN F, PRASAD K N, DUAN X AND YANG B. 2013. Identification of a novel phenolic compound in litchi (Litchi chinensis Sonn.) pericarp and bioactivity evaluation. Food Chem 136: 563-568.
LIMA ES, SCHWERTZ MC, SOBREIRA CRC AND BORRAS MRL. 2012. Efeito hipoglicemiante da farinha do fruto de maracujá-do-mato (Passiflora nitida Kunth) em ratos normais e diabéticos.Rev Bras Plant Med 14: 383-388.
LIN HV ET AL. 2012. Butyrate and propionate protect against diet-induced obesity and regulate gut hormones via free fatty acid receptor 3-independent mechanisms. PLoS ONE 7: e35240.
LEVIN BE, TRISCARI J AND SULLIVAM AC. 1986. Metabolic features of diet-induced obesity without hyperphagia in young rats. Am J Physiol 251: r433-r440. MELO DS, CORRÊA ADC, MARCOS FCA, SOUSA RV,
ABREU CMP AND SANTOS CD. 2008. Efeitos da farinha de folhas de mandioca sobre a atividade das enzimas AST, ALT, FA e lipídios hepáticos de ratos Wistar. Cienc Tecnol Aliment 28: 32-37.
MIAO X, WANG Y, WANG W, LV X, WANG M AND YIN H. 2015. The mAb against adipocyte fatty acid-binding protein 2E4 attenuates the inflammation in the mouse model of high-fat diet-induced obesity via toll-like receptor 4 pathway. Mol Cell Endocrinol 403: 1-9.
MILLER JD, ARONIS KN, CHRISPIN J, PATIL KD, MARINE JE, MARTIN SS, BLAHA MJ, BLUMENTHAL RS AND CALKINS H. 2015. Obesity, Exercise, Obstructive Sleep Apnea, and Modifiable Atherosclerotic Cardiovascular Disease Risk Factors in Atrial Fibrillation. J Am Coll Cardiol 66: 2899-2906.
MOTTA VM. 2009. Bioquímica clínica para o laboratório: princípios e interpretações. 5ª ed., Rio de Janeiro: MedBook, 400 p.
NAKAZATO M, MURAKAMI N, DATE Y, KOJIMA M, MATSUO H, KANGAWA K AND MATSUKURA S. 2001. A role for ghrelin in the central regulation of feeding. Nature 409: 194-198.
NOVELLI ELB, DINIZ YS, GALHARDI CM, EBAID GMX, RODRIGUES HG, MANI F, FERNANDES AAH, CICOGNA AC AND NOVELLI FILHO JLVB. 2007. Anthropometrical parameters and markers of obesity in rats. Lab Anim 41: 111-119.
PEREIRA CA, PEREIRA LLS AND CORRÊA AD. 2010.
PRASAD KN, YANG JB, YANG S, CHEN Y, ZHAO M, ASHRAF M AND JIANG Y. 2009. Identification of phenolic compounds and appraisal of antioxidant and antityrosinase activities from litchi (Litchi sinensis Sonn.) seeds. Food Chem 116: 1-7.
QUEIROZ ER, ABREU CMP AND OLIVEIRA KS. 2012. Constituintes químicos das frações de lichia in natura e submetidas à secagem: potencial nutricional dos subprodutos. Rev Bras Frutic 34: 1174-1179.
QUEIROZ ER, ABREU CMP, OLIVEIRA KS, RAMOS VO AND FRÁGUAS RM. 2015. Bioactive phytochemicals and antioxidant activity in fresh and dried lychee fractions. Rev Cienc Agron 46: 163-169.
REEVES PG, NIELSEN FH AND FAHEEY GC. 1993. AIN-93 Purified diets for laboratory rodents: final report of the American Institute of Nutrition ad Hoc Writing Committee on the reformulation of the AIN-76A rodent diet. J Nutr 123: 1939-1951.
ROMERO CEM AND ZANESCO A. 2006. O papel dos hormônios leptina e grelina na gênese da obesidade. Rev Nutr 9: 85-91.
SERGENT T, VANDERSTRAETEN J, WINAND J, BEGUIN P AND SCHNEIDER YJ. 2012. Phenolic compounds and plant extracts as potential natural anti-obesity substances. Food Chem 135: 68-73.
SPENCER PS, PALMER VS AND MAZUMDER R. 2015. Probable toxic cause for suspected lychee-linked viral encephalitis. Emerg Infect Dis 21: 904-905.
SPOSITO AC, CARAMELLI B, FONSECA FAH AND BERTOLAMI MC. 2007. IV Diretriz Brasileira sobre Dislipidemias e Prevenção da Aterosclerose: Departamento de Aterosclerose da Sociedade Brasileira de Cardiologia. Arq Bras Cardiol 28: 2-19.
SREERAMA YN, SASHIKALA VB AND PRATAPE VM. 2012. Phenolic compounds in cowpea and horse gram flours in comparison to chickpea flour: evaluation of their antioxidant and enzyme inhibitory properties associated with hyperglycemia and hypertension. Food Chem 133: 156-162.
STIEG MR, SIEVERSA C, FARR O, STALLA GK AND MANTZOROS CS. 2015. Leptin: a hormone linking activation of neuroendocrine axes with neuropathology. Psychoneuroendocrinology 51: 47-57.
STROHECKER R AND HENNING HM. 1967. Analisis de vitaminas: métodos comprobados. Madrid: Paz Montalvo, 428 p.
VADDER F, KOVATCHEVA-DATCHARY P, GONCALVES D, VINERA J, ZITOUN C, DUCHAMPT A, BÄCKHED F AND MITHIEUX G. 2014. Microbiota-generated metabolites promote metabolic benefits via gut-brain neural circuits. Cell 156: 84-96.
WINTERBOURN CC, GUTTERDGE JM AND HALLIWELL B. 1985. Doxorubicin-dependent lipid peroxidation at low partial pressures of O2. J Free Radical Biol Med 1: 43-49. WU YHS, CHIU CH, YANG DJ, LIN YL, TSENG JK AND
CHEN YC. 2013. Inhibitory effects of litchi (Litchi chinensis Sonn.) flower-water extracts on lipase activity and diet-induced obesity. J Funct Foods 5: 923-929. XU X, XIE H, HAO J, JIANG Y AND WEI X. 2011. Flavonoid
glycosides from the seeds of Litchi chinensis. J Agric Food Chem 59: 1205-1209.
YANG DJ, CHANG YY, HSU CL, LIU CW, WANG Y AND CHEN YC. 2010. Protective effect of a litchi (Litchi chinensis Sonn.) flower-water-extract on cardiovascular health in a high-fat/cholesterol-dietary hamsters. Food Chem 119: 1457-1464.
ZHANG B, DENG Z, RAMDATH DD, TANG Y, CHEN PX, LIU R, LIU Q AND TSAO R. 2015. Phenolic profiles of 20 Canadian lentil cultivars and their contribution to antioxidant activity and inhibitory effects on α-glucosidase and pancreatic lipase. Food Chem 172: 862-872.
ZHAO LH, HUANG W, YUAN QX, CHENG J, HUANG ZC, OUYANG LJ AND ZENG FH. 2012. Hypolipidaemic effects and mechanisms of the main component of Opuntia dillenii Haw. polysaccharides in high-fat emulsion-induced hyperlipidaemic rats. Food Chem 134: 964-971.
ZHISHEN J, MENGCHENG T AND JIANMING W. 1999. The determination of flavonoid contents in mulberry and their scavenging effects on superoxide radicals. Food Chem 64: 555-559.
ZHONG HX, XIA-LU S, LIU L, JIAN-MEI Z AND
XING-YU C. 2015. Effect of dietary oat β-glucan on high-fat diet