Original Article
Effect of pore size and surface chemistry of porous silica on CO
2adsorption
Thongthai Witoon
1,2*and Metta Chareonpanich
1,21 National Center of Excellence for Petroleum, Petrochemicals and Advance Material,
Department of Chemical Engineering, Faculty of Engineering,
2 Center for Advanced Studies in Nanotechnology and Its Applications in Chemical Food and Agricultural Industries,
Kasetsart University, Chatuchak, Bangkok, 10900 Thailand.
Received 1 December 2011; Accepted 10 April 2012
Abstract
In the present study, porous silica synthesized using sodium silicate as a low-cost raw material was selected as a CO2
sorbent. The effects of pore size and amount of silanol content on CO2 adsorption capacity were investigated. The physical
properties and surface chemistry (silanol content) of the porous silica products were characterized by means of N2
-physi-sorption, Fourier transform infrared spectroscopy and thermogravimetric analysis technique. The pore size of the porous silica materials did not affect the equilibrium CO2 capacity; however the porous silica with large pore size could enhance the
diffusion of CO2. The amount of silanol content was found to be a key factor for the CO2 adsorption capacity. A greater CO2
adsorption capacity would be obtained with an increase of the silanol concentration on the surface of the porous silica materials.
Keywords: porous silica, sodium silicate, pore size, silanol content, CO2 adsorption
1. Introduction
The problem of global warming caused by CO2
emis-sion, which is the main part of greenhouse gases, has raised serious concerns. The combustion of fossil fuels is one of the major sources of CO2 emission to the atmosphere. However,
due to the fact that these fossil fuels are essential as they supply more than 70% of the world’s energy consumption. It is therefore important to find novel technologies that can allow us to utilize fossil fuels with less CO2 emission.
Gener-ally, there are three steps for CO2 management involving
separation, transportation, and sequestration (Olajire, 2010). The key point of the CO2 management is the separation of
CO2 from the flue gas because it contributes 75% to the
over-all costs.
Various technologies for CO2 capture, such as
absorp-tion, adsorpabsorp-tion, cryogenic and membrane technologies, have been proposed and investigated (MacDowell et al., 2010). Among these techniques, adsorption is one of the most pro-mising approaches as it can reduce the cost associated with the capture step. Several porous materials such as zeolite, alumina, activated carbon, and porous silica, have been con-sidered for low temperature CO2 separation. As the use of
low-cost porous material can significantly reduce the cost of CO2 management, porous silica is then becoming very
com-petitive because of its economical potential and availability as it can be produced from the renewable resource such as rice husk ash.
Recent research work has been devoted for the de-velopment of the synthesis of porous silica materials of vary-ing sizes in a controllable manner (Witoon et al., 2011), among the different routes are sol-gel process, precipitation, plasma, flame spray pyrolysis, and others. Sol-gel process, which is consisted of hydrolysis and polycondensation re-actions of a metal salt, is an effective method that is preferred
* Corresponding author.
Email address: [email protected]
to control the pore structure and surface properties of porous silica. The pore size and surface chemistry of porous silica can be controlled by adjusting the pH of the mixture, aging temperature, precursor concentration, catalysts and calcina-tion temperature (Brinker and Scherer, 1990).
Due to the fact that the pore size and surface chem-istry (silanol groups) of porous silica mainly affect the mass transfer and surface reactivity, it is of great interest to investi-gate the effect of these parameters on the CO2 adsorption
capacity. In this study, the porous silica materials were synthesized using sodium silicate as a low-cost silica source. The pore size of the porous silica materials was varied between 2 and 10 nm by varying the pH values of the gel mixture. The amount of silanol content was controlled by varying the calcination temperature. The pore size and the amount of silanol content of porous silica materials were characterized by using N2-physisorption, Fourier transform
infrared (FTIR) spectroscopy and thermogravimetric analysis (TGA) technique. The CO2 adsorption capacity of each
sample was measured by gravimetric method at different adsorption temperatures.
2. Experimental
2.1 Synthesis of porous silica materials
Porous silica materials were prepared by the sol-gel method based on the hydrolysis and condensation reaction. In a typical synthesis process, 4.5 g of sodium silicate (Na2Si3O7: 27 wt.% SiO2, 4 wt.% NaOH) was introduced into
70 mL of deionized water under stirring for 5 min. The pH of the solution was adjusted to 2, 3, and 4 by using 2 M hydro-chloric acid. The solution was stirred continuously at 40°C for 24 h, and then the obtained solution was aged in the Teflon-lined autoclave at 100°C for 24 h. The obtained solid product was consecutively filtered, washed several times with distilled water, dried at 105°C for 12 h, and calcined in air at either 200 or 500°C for 4 h at a heating rate of 1°C/min to adjust the amount of silanol content on the surface of porous silica materials.
2.2 Characterization of porous silica
Pore size, BET surface area and pore volume were determined by using N2-sorption technique at –196°C
(Quan-tachrome Autosorb 1C instrument). Prior to N2-sorption
measurements, the samples were degassed at 200°C for 12 h. The BET surface area was estimated using relative pressure in the range of 0.05 to 0.30. The pore size distribution was calculated from the adsorption branch by using Barrett– Joyner–Halenda (BJH) method. The total pore volume was obtained from the adsorption data at P/P0 of 0.99. The
func-tional groups on the surface of porous silica were examined by using Fourier transform infrared spectroscopy (Perkin Elmer System 2000 using KBr pellet). The amount of silanol groups on the surface of porous silica was investigated by
using simultaneous DTA-TGA analyzer (TA instrument, SDT2960 simultaneous DTA-TGA Universal 2000) in nitrogen at a heating rate of 10°C/min.
2.3 CO2 adsorption/desorption measurements
The CO2 adsorption/desorption measurements were
performed for all silica xerogel products by using a SDT2960 simultaneous DTA-TGA Universal 2000. A 20 mg sample was loaded into an alumina sample pan. Prior to the CO2
adsorp-tion/desorption experiment, the sample was first activated by heating from room temperature to 110°C in Ar atmosphere (99.99%) at a heating rate of 10°C/min in order to remove pre-adsorbed CO2 and H2O; then the sample was cooled down to
a given temperature. Subsequently, pure CO2 (99.999%) was
introduced into the system at a flow rate of 40 mL/min; during this process the change in the sample weight was recorded. The CO2 adsorption runs were conducted at three different
temperatures including 40, 60, and 80°C. When the sample weight was constant, CO2 was then desorbed by heating to
the temperature of 110°C in a flow of Ar (99.99%) at a heating rate of 10°C/min.
3. Results and Discussion
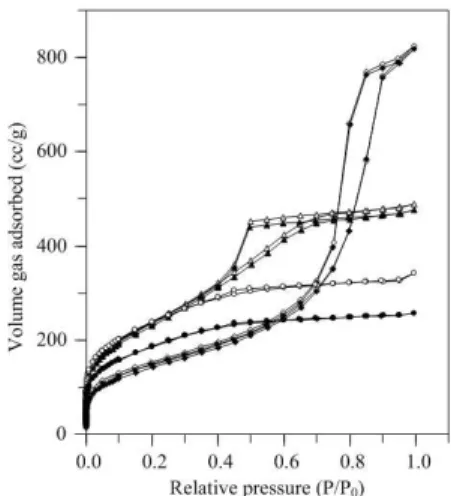
The N2-sorption isotherm of porous silica products is
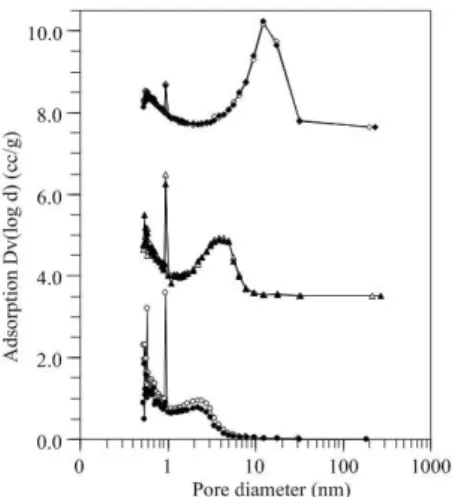
shown in Figure 1. At pH 2, the isotherm is Type I, indicating that the silica product is mainly composed of microporous structures. The characteristics of microporous–mesoporous materials confirmed by the Type I–IV composite isotherms are found for the product prepared at pH 3. With further in-creasing the pH value (pH 4), Type IV isotherm is obtained. The pore size distribution of all silica products is depicted in Figure 2. It can be clearly seen that the pore size distribution of silica products displayed multi–peaks at two different length scales: one in the range of micropores (<2 nm) and
one in the range of mesopores (2–50 nm). With increasing pH values, the amount of pores smaller than 1 nm is signifi-cantly decreased while the pore larger than 1 nm is shifted towards larger pore sizes. Comparing the results for a same pH value of the mixture, the amount of pores smaller than 3 nm of silica product prepared at pH 2 is dramatically de-creased when the calcination temperature inde-creased from 200 to 500°C. However, the calcination temperature did not significantly affect the pore structure of silica products prepared at the higher pH values.
The physical properties including, average pore size, BET surface area and pore volume of all porous silica products are given in Table 1. At a low calcination tempera-ture (200°C), the average pore size of porous silica products was increased from 2.6, 3.6 to 10.0 nm when the pH of the gel mixture increased from 2, 3 to 4, respectively. The results can be explained as follows. At pH 2, the hydrolysis rate is fast while the condensation rate of silanol species is low, result-ing in the formation of weakly branched silica oligomers, which tend to be interwoven at the gel point (Brinker and
Scherer, 1990). The compliant structure can rather freely shrink in response to solvent removal because a pressure gradient from liquid–vapor meniscus is created. With a further increase of the pH values, a structure of highly branched silica oligomers caused by an increase of the con-densation rate of silanol species is obtained. This structure can stop the gel shrinkage due to the stiffness of the imping-ing clusters. As a result, porous silica products with larger pore size are obtained at higher pH values.
The surface chemistry of the porous silica products was investigated using FTIR technique and the results are shown in Figure 3. The strong band around 1,100 cm-1 and
small bands around 780 and 460 cm-1 represent the
character-istics of the Si-O-Si groups. Regarding the presence of OH groups, their vibration bands can be located at different fre-quencies, depending on the bonding configuration. Accord-ingly, the shoulder at 950 cm-1 indicates the existence of
Si-OH asymmetric stretching band (Karbowiak et al., 2010), whereas the broad band between 3,800 and 3,050 cm-1 is
attributed to the stretching of silanol associated with surface silanols including isolated silanol, vicinal, and geminol groups (Aguiar et al., 2009). It can be seen that intensity of
Figure 2. Pore size distribution of porous silica products synthe-sized at pH values of 2 (circle), 3 (triangle) and 4 (dia-mond), and calcined at 200 °C (open symbol) and 500 °C
(filled symbol).
Table 1. Physical properties of porous silica products synthesized at different conditions and silanol group content determined by TGA techniques.
Samplesa BET surface area Average pore Pore volume Second mass loss OH group content
(m2/g) diameter (nm) (cm3/g) (%) (mmol/g)
S2-200 830 2.6 0.53 5.22 5.80
S2-500 654 2.3 0.40 2.87 3.19
S3-200 863 3.6 0.75 4.69 5.21
S3-500 843 3.5 0.74 3.89 4.32
S4-200 510 10.0 1.27 2.86 3.18
S4-500 509 9.9 1.26 2.08 2.31
a Silica xerogel products were designated as SX-Y where X is the pH of mixture and Y is the calcination
temperature.
those bands related to the existence of surface silanol is decreased with increasing pH value and calcination tempera-ture.
The TG analysis is performed to determine the quan-titative information of the silanol contents on the surface of the porous silica products. TGA patterns of the porous silica products are depicted in Figure 4. It is found that there are two distinct mass loss steps in the TGA curves of all samples. The abrupt change of the first step at temperatures below 120°C is most probably due to the removal of physical adsorbed water from the silica surface. The gradual change of the second step is corresponding to slow condensation of germinals, vicinals, and isolated silanols (Ek et al., 2001). The total silanol group content in the silica surface is determined as the hydroxyl group content and is calculated by using the entire second weight loss (ranging from 200°C to the end point of the measurement at 1,000°C).
The hydroxyl group content (Table 1), estimated by assuming that the condensation occurred based on the re-action of two hydroxyl groups on the silica surface, can be calculated as follows (Kim et al., 2009):
2
0 final
OH(SiO )2 2(WL(T ) WL(T ))100
H O
n
M
(1)
where WL(T0) and WL(Tfinal) are the weights of the silica
(wt%) at temperature of 200 °C and 1,000 °C, respectively, is
the molecular weight of water. At a low calcination tempera-ture (200°C), the amount of silanol content significantly decreases when the pH value increases from 2 to 4 due to the increase of silanol-silanol condensation rate. A significant reduction in the silanol surface is also found when the calci-nation temperature increases from 200 to 500°C, especially that of Sample S2-500. This can be explained by the fact that the pore structure of silica products prepared at pH 2 mainly composed of micropores, which can easily collapse at higher calcination temperatures (Iler, 1979; Brinker and Scherer, 1990). Based on the results of N2-sorption and TGA analysis,
the amount of silanol content of Sample S2-500 and S4-200 is almost the same but their average pore size is different (2.3 and 10.0 nm). Therefore these samples are employed to
in-Figure 4. TGA patterns of all porous silica products.
vestigate the effect of pore size on CO2 adsorption capacity
while the effect of silanol content on CO2 adsorption capacity
is studied by using the porous silica products having the equivalent pore size, but the amount of silanol content is different.
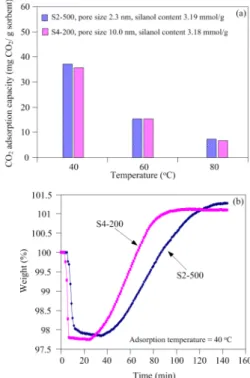
As shown in Figure 5a, the CO2 adsorption capacities
of Sample S2-500 and S4-200 are almost the same at all ad-sorption temperatures, indicating that the CO2 adsorption
capacities are not affected by the pore size. However, as seen in Figure 5b, the CO2 adsorption over Sample S4-200 is much
faster than over Sample S2-500. The CO2 adsorption capacity
of Sample S4-200 reaches ca. 90% of its equilibrium capacity within 55 min of CO2 exposure, while it takes 75 min for
Sample S2-500. It is demonstrated that the porous silica with large pore sizes can enhance the diffusion of CO2.
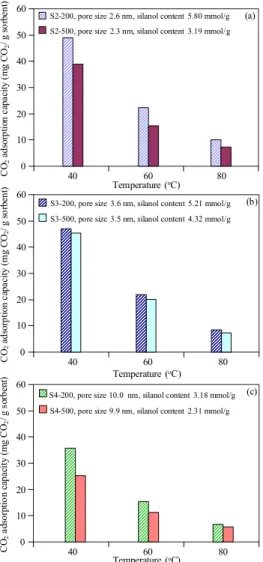
Figure 6 shows the effect of silanol content on CO2
adsorption at different adsorption temperatures. It can be clearly seen that the CO2 adsorption capacity is increased
with increasing silanol content, indicating that the key factor of CO2 adsorption on porous silica materials is the number of
silanol groups. The porous silica products with the highest silanol group content (S2-200) give the highest CO2
adsorp-tion capacity (48.9 mg CO2/g adsorbent). However,
differ-ences between the CO2 adsorption capacities of the silica
products at high adsorption temperature are found to be in-significant because the interaction between CO2 and silanol
groups is van der Waals’ force, which does not favor the adsorption at higher temperatures.
Acknowledgments
This work was financially supported by the Research Grant for New Scholar (Grant No. MRG5480196) co-funded by the Thailand Research Fund (TRF); the Commission on Higher Eduction, Thailand; and Kasetsart University, Thai-land. The authors would like to thank the National Center of Excellence for Petroleum, Petrochemical and Advanced Materials (NCE-PPAM) and Kasetsart University Research and Development Institute (KURDI). Support from the Na-tional Research University Project of Thailand (NRU) is also acknowledged.
References
Aguiar, H., Serra, J., Conzález, P. and León, B. 2009. Structural study of sol-gel silicate glasses by IR and Raman spectroscopies. Journal of Non-Crystalline Solids 355, 475–480.
Brinker, C.J. and Scherer, G.W. 1990. Sol-Gel Science: The Physics and Chemistry of Sol-gel Processing, Acade-mic Press, New York, U.S.A.
Ek, S., Root, A., Peussa, M. and Niinistö, L. 2001. Determina-tion of the hydroxyl group content in silica by ther-mogravimetry and a comparison with H1 MAS NMR
results. Thermochimica Acta 379, 201–212.
Iler, R.K. 1979. The Chemistry of Silica. John Wiley & Sons, New York, U.S.A.
Karbowiak, T., Saada, M.-A., Rigolet, S., Ballandras, A., Weber, G., Bezverknyy, I., Soulard, M., Patarin, J. and Bellat, J.-P. 2010. New insight in the formation of silanol defects in silicalite-1 by water intrusion under high pressure. Physical Chemistry Chemical Physics 12, 11454–11466.
Kim, J.M., Chang, S.M., Kong, S.M., Kim, K.-S,. Kim, J. and Kim, W.-S. 2009. Control of hydroxyl group content in silica particle synthesized by the sol-precipitation process. Ceramics International 35, 1015–1019. MacDowell, N., Florin, N., Buchard, A., Hallett, J., Galindo,
A., Jackson, G., Adjiman, C.S., Williams, C.K., Shah, N. and Fennell, P. 2010. An overview of CO2 capture
technologies. Energy & Environmental Science 3, 1645–1669.
Olajire, A.A. 2010. CO2 capture and separation technologies
for end-of-pipe applications – A review. Energy35, 2610–2628.
Witoon, T., Chareonpanich, M. and Limtrakul, J. 2011. Effect of hierarchical meso-macroporous silica supports on Fischer-Tropsch synthesis using cobalt catalyst. Fuel Processing Technology 92, 1498–1505.
Figure 6. Comparison of CO2 adsorption capacity at different ad-sorption temperature of Sample S2-200 and S2-500 (a), S3-200 and S3-500 (b), and S4-200 and S4-500 (c).
4. Conclusion
The pore size and silanol content of porous silica products could be tuned in the range of 2.3-10 nm and 2.31-5.80 mmol/g, respectively, by varying the pH of the mixture and the calcination temperature. The pore size of the porous silica materials did not affect the CO2 adsorption capacity,
however the porous silica with large pore sizes could enhance the diffusion rate of CO2. The CO2 adsorption
capa-city increased with increasing silanol content. It was de-monstrated that the silanol concentration on the surface of the porous silica materials was a key factor for the CO2
adsorption. 0 10 20 30 40 50 60
40 60 80
Temperature (oC)
C O2 ad so rp tio n ca pa ci ty (m g CO 2 / g so rb en t) 0 10 20 30 40 50 60
40 60 80
Temperature (oC)
C O2 ad so rp tio n ca pa ci ty (m g C O2 / g s or be nt ) 0 10 20 30 40 50 60
40 60 80
S2-200, pore size 2.6 nm, silanol content 5.80 mmol/g S2-500, pore size 2.3 nm, silanol content 3.19 mmol/g
Temperature (oC)
C O2 ad so rp tio n ca pa ci ty (m g C O2 / g so rb en t) (a)
S3-200, pore size 3.6 nm, silanol content 5.21 mmol/g S3-500, pore size 3.5 nm, silanol content 4.32 mmol/g
(b)