www.atmos-chem-phys.net/10/11987/2010/ doi:10.5194/acp-10-11987-2010
© Author(s) 2010. CC Attribution 3.0 License.
Chemistry
and Physics
Comparison between simulated and observed chemical composition
of fine aerosols in Paris (France) during springtime: contribution of
regional versus continental emissions
J. Sciare1, O. d’Argouges1, Q. J. Zhang2, R. Sarda-Est`eve1, C. Gaimoz1, V. Gros1, M. Beekmann2, and O. Sanchez3
1LSCE, Laboratoire des Sciences du Climat et de l’Environnement, unit´e mixte CEA-CNRS-UVSQ,
UMR8212, Gif-sur-Yvette, France
2LISA, Laboratoire Interuniversitaire des Sciences Atmosph´eriques, Universit´e Paris Est and Paris 7,
CNRS, Cr´eteil, France
3AIRPARIF, Agence de Surveillance de la qualit´e de l’air, Paris, France
Received: 14 May 2010 – Published in Atmos. Chem. Phys. Discuss.: 7 July 2010
Revised: 10 November 2010 – Accepted: 7 December 2010 – Published: 16 December 2010
Abstract. Hourly concentrations of inorganic salts (ions) and carbonaceous material in fine aerosols (aerodynamic di-ameter, A.D.<2.5 µm) have been determined experimentally from fast measurements performed for a 3-week period in spring 2007 in Paris (France). The sum of these two chemi-cal components (ions and carbonaceous aerosols) has shown to account for most of the fine aerosol mass (PM2.5). This
time-resolved dataset allowed investigating the factors con-trolling the levels of PM2.5 in Paris and showed that
pol-luted periods with PM2.5>15 µg m−3were characterized by
air masses of continental (North-Western Europe) origin and chemical composition made by 75% of ions. By contrast, periods with clean marine air masses have shown the low-est PM2.5concentrations (typically of about 10 µg m−3);
car-bonaceous aerosols contributing for most of this mass (typi-cally 75%).
In order to better discriminate between local and continen-tal contributions to the observed chemical composition and concentrations of PM2.5over Paris, a comparative study was
performed between this time-resolved dataset and the out-puts of a chemistry transport model (CHIMERE), showing a relatively good capability of the model to reproduce the time-limited intense maxima observed in the field for PM2.5
and ion species. Different model scenarios were then investi-gated switching off local and European (North-Western and Central) emissions. Results of these scenarios have clearly
Correspondence to:J. Sciare ([email protected])
shown that most of the ions observed over Paris during pol-luted periods, were either transported or formed in-situ from gas precursors transported from Northern Europe. On the op-posite, long-range transport from Europe appeared to weakly contribute to the levels of carbonaceous aerosols observed over Paris.
The model failed to properly account for the concen-tration levels and variability of secondary organic aerosols (SOA) determined experimentally by the EC-tracer method. The abundance of SOA (relatively to organic aerosol, OA) was as much as 75%, showing a weak dependence on air masses origin. Elevated SOA/OA ratios were also observed for air masses having residence time above ground of less than 10 h, suggesting intense emissions and/or photochemi-cal processes leading to rapid formation of secondary organic aerosols.
1 Introduction
With more than half of the world population living in cities, urban areas represent nowadays one of the ma-jor sources of fine anthropogenic aerosols at global scale, pointing out the need for a better characterization of these aerosols in the neighboring of their emission sources. At-mospheric pollution and exposure levels in the densely pop-ulated megacities (cities having more than 10 million of in-habitants) will be particularly high since these cities are gen-erally confined to a relatively small area; they can represent a major fraction of emissions of a given country (Gurjar et al., 2004).
With a population of about 12 millions inhabitants (20% of the French population), Greater Paris (France) is among the most populated megacities in Europe. Due to its favorable geographical situation (far from other big European cities and influenced very often by clean oceanic air masses), it may be considered as a good candidate for investigating the build-up of urban air pollution within temperate industrial-ized countries.
Particulate mass of fine aerosols (PM2.5) is continuously
monitored at several sites within Greater Paris since almost 8 years by the local air quality network (AIRPARIF), using a conventional on-line automatic system (R&P TEOM; see Patashnik and Rupprecht, 1991). During the period 2000– 2006, levels of PM2.5in the region of Paris have shown rather
stable yearly mean values ranging from 13 to 16 µg m−3 whereas primary pollutants monitored by AIRPARIF (car-bon monoxide, sulfur dioxide, NO) have shown a net de-crease during this period (http://www.airparif.asso.fr). Since the year 2007, yearly mean concentration of PM2.5has
sub-stantially increased (up to 21 µg m−3), partly due to the use of
a new measurement technique (R&P TEOM-FDMS instru-ment) enabling a proper determination of the semi-volatile fraction of fine aerosols. Although this new method greatly improves the determination of PM2.5, it has also brought
PM2.5 levels in the region of Paris closer to the 25 µg m−3
yearly mean targeted value recommended by Europe for 2010 (limit value for 2015). Efficient abatement policies aiming at reducing levels of PM2.5in the region of Paris will
have to be fed by preliminary PM2.5 source apportionment
studies and exhaustive aerosol chemistry studies (chemical mass balance) allowing a better separation between local to continental aerosol sources.
Still only few studies are available on the chemical spe-ciation of aerosols in the Paris region. They comprise pre-liminary characterizations of carbonaceous aerosols (Ruel-lan and Cachier, 2001), carbon and lead isotopes (Widory et al., 2004) and semi-volatile species (Favez et al., 2007). Time-limited information in the chemical composition of fine aerosols in Paris have been recently reported by Gros et al. (2007) but for a site impacted by traffic which may not be fully representative for the composition and levels of aerosols in the Paris urban background atmosphere. Mod-elling studies over Paris have been reported in literature but concerned mainly PM with A.D.<10 µm (PM10) or total
sus-pended matter size fractions (Bessagnet et al., 2005; Hodzic et al., 2006). As a result, chemical composition of PM2.5
over the region of Paris remains poorly documented and re-gional model simulating PM2.5concentrations and
composi-tion over this region poorly constrained.
In this context, time-resolved measurements of the ma-jor chemical constituents of fine aerosols may be particularly useful as they will offer a large database that can be used for model comparison. They may also help to better document large temporal variations in local emissions (such as traffic peaks generally observed at rush hours) as well as large diur-nal fluctuation of the boundary height, thermodynamic equi-librium, ventilation, photochemistry, and air masses origin.
Hourly measurements of the main chemical constituents of PM2.5 are reported here for the first time for the city of
Paris and cover a 3-week period during spring 2007. Hourly reconstruction of PM2.5is calculated and compared with
co-located continuous PM2.5measurements corrected from filter
sampling artifacts. Local and continental contributions to the major chemical constituents of PM2.5are discussed in light
of this time-resolved dataset, backtrajectory air masses anal-ysis, comparison with volatile organic compounds (VOC) dataset and comparison with the aerosol chemistry outputs of a regional chemistry transport model (CHIMERE) which is currently used for air pollution forecast by AIRPARIF (www. airparif.asso.fr) and INERIS (www.prevair.org, Honor´e et al., 2008).
2 Experimental
Atmospheric measurements were performed on the terraced roof (14 m above ground level) of the Laboratoire d’Hygi`ene de la Ville de Paris (LHVP; Paris, 13th district; 48◦44′44′′N, 2◦21′35′′E). This site corresponds to a monitoring station of AIRPARIF and is considered as being representative of Paris background air pollution (Favez et al., 2007). Results pre-sented here were obtained from 23 May 2007 to 10 June 2007. A wide variety of VOC has been measured during this campaign and is reported in details by Gros et al. (2010) and Gaimoz et al. (2010). Meteorological parameters were monitored at the site every 5min using a Campbell Scientific weather Station.
2.1 Field instruments
Reliable continuous (6-min time resolution) measurements of PM2.5 (nonvolatile plus semi-volatile) were performed
by a Tapered Element Oscillating Microbalance (TEOM) Model 1400 from Rupprecht and Pataschnik equipped with a Sample Equilibration System (SES) and a Filter Dynamic Measurement System (FDMS, 8500 model series). This instrument delivers a concentration of semi-volatile ma-terial (SVM) in PM2.5 which is mainly made of
2007). Real-time PM measurements provided by the TEOM FDMS have shown to compare very well with other real-time measurement obtained from other analyzers taking into account SVM (Grover et al., 2005). A very good agree-ment was found between our TEOM-FDMS measureagree-ments performed at LHVP (13th district) with similar measure-ments performed by AIRPARIF in the center of Paris (1st district, les Halles), with PM2.5(LHVP)=0.97·PM2.5(Les
Halles) + 0.19 µg m−3;r2=0.95;N=323. This result indi-cates that our measurements are not significantly impacted by local contamination and may be representative for the Paris urban background atmosphere.
A mono-wavelength (525 nm) integrating nephelometer (ECOTECH, Model M9003) was operated in parallel with a 50% cut-off diameter inlet of 2.5 µm (sharp Cut cyclone Model SCC 1.828, BGI Incorp., MA) and provided light scattering coefficient (σsp) measurements every 5 min. A
silicagel Diffusion Dryer (Model 3062, TSI Incorp., USA) mounted upstream of the nephelometer was used to keep relative humidity (RH) inside the nephelometer below 30% in order to minimize the role of water uptake onto aerosols which is known to alter (σsp) measurements. More
infor-mation on the operation, calibration, detection limit can be found in Sciare et al. (2008b).
Equivalent Black Carbon (EBC) measurements were ob-tained from 5-min integrated light absorption measurements performed by a seven-wavelength Aethalometer (Model AE-31, Magee Scientific) running at 5 LPM and equipped with a 50% cut-off diameter of 2.5 µm (R&P, Albany, NY).
Hourly concentrations of elemental carbon (EC) and or-ganic carbon (OC) in PM2.5were obtained in the field from
a semi-continuous ECOC field analyzer (Sunset Laboratory, Forest Grove, OR; Bae et al., 2004) running at 8 LPM. A denuder provided by the manufacturer was set upstream in order to remove possible adsorption of VOC onto the fil-ter. Measurement uncertainty given by the ECOC analyzer is poorly described in literature and an estimate of 20% for this uncertainty was taken here following Peltier et al. (2007).
2.2 Filter sampling and chemical analyses
Fine (A.D.<2.5 µm) aerosols were collected continuously on 25-mm diameter pre-fired quartz filters (QMA) at a flowrate of 6.8±1.5 LPM and using the same sharp cut cyclone as for the ECOC analyzer (Very Sharp Cut Cyclone (VSCC), BGI Inc., Waltham, MA). A denuder identical to the one used up-stream of the ECOC analyzer was set between the cyclone and the filter holder in order to minimize artefacts due to VOC adsorption onto the filter matrix. The filter sampling interval was typically of the order of 12 h. A total of 36 filter samples were then collected during the campaign.
Half of the 25-mm diameter QMA filters were analyzed for their EC and OC content using a thermo-optical carbon analyzer (ECOC Lab Instrument, Sunset Lab.) implemented with the NIOSH thermal program (Birch and Cary, 1996).
The uncertainty given by the manufacturer for EC and OC measurements is of 0.2µgC cm−2±5%. A total of 7 blanks
were taken in the field covering the duration of the campaign and showed non detectable amounts of EC. An average value of 0.78±0.15 µgC cm−2for OC blanks was calculated and subtracted from the OC values obtained in the field.
Water-soluble organic carbon (WSOC) and ion analyses were achieved on the second half of the QMA quartz fil-ters. WSOC measurements were performed using a total or-ganic carbon analyzer (TOC, Model Sievers 900, Ionics Ltd, USA) in which ammonium persulphate and UV light (185 and 284 nm) are used for the oxidation and the quantifica-tion of organic carbon. Informaquantifica-tion on filter extracquantifica-tion pro-tocol, detection limit, and calibration for WSOC analysis can be found in Sciare et al. (2008a). Concentrations of WSOC were corrected from blank filters taken in the field showing an average WSOC concentration of 0.54±0.18 µgC cm−2. Ion composition (anions, cations) of the filter samples were also determined following the extraction and analytical pro-tocol described in Sciare et al. (2005).
2.3 Validation of OC and EC field measurements
0 1 2 3 4 5 6 7 8 9 10
23/05 28/05 02/06 07/06 12/06 17/06
O
C
(filte
r s
a
m
p
lin
g
), µ
g
C
/m
3
3 4 5 6 7 8 9 10 11 12 13
O
C
(S
u
n
s
e
t F
ie
ld
in
s
t.), µ
g
C
/m
3
OC (manual filter sampling)
OC (Sunset Field Inst.)
Fig. 1.Hourly OC concentrations from the semi-continuous OCEC sunset field instrument (uncorrected for the offset of 3.03 µgC m−3) and OC concentrations from the manual filter sampling. Horizontal bars stand for the duration of the filter sampling.
the range given previously. Field OC data discussed in the following were then corrected from this constant value of 3.03 µgC m−3. Particulate organic matter (POM) concentra-tions reported in the following were calculated using an OC to POM conversion factor of 1.6 as proposed by Turpin and Lim (2001) for urban aerosols.
2.4 Determination of ion concentrations and reconstruction of PM2.5
Hourly ion measurements were not available during this campaign but can be estimated using the reconstruction of the light scattering coefficient following the methodology re-ported in detail by Sciare et al. (2008b). Briefly, a simple model assuming an external mixing of the particles with con-stant dry mass scattering efficiencies and concon-stant aerosol types (Malm et al., 1994, 2000) can be used here to re-construct the light scattering coefficient (σsp), following the
equation:
σsp = αionsf (RH)([(NH4)2SO4] + [NH4NO3])
+αPOM[POM] +αsea salt[sea salt] +αdust[dust] (1)
WhereαX stands for the mass scattering efficiency of the
chemical species [X]. It is assumed here that (NH4)2SO4and
(NH4)NO3have a similar mass scattering efficiency (αions)
assigned to be 3 m2g−1, which is an average of values
com-monly reported in literature (Sciare et al., 2005 and ref-erences therein). The mass scattering efficiency of POM (αPOM) is taken equal to 4 m2g−1(Malm et al., 1994). Since
our nephelometer measurements were not significantly af-fected by water uptake onto aerosols, a constant enhance-ment factor,f(RH), equal to 1 is taken here.
Non sea salt calcium (nss-Ca) and sodium can be used here as tracers for dust and sea salt aerosols, respectively, and were analyzed by ion chromatography (Sect. 2.2). Very
0 10 20 30 40 50 60
23/05 28/05 02/06 07/06
S
u
m
i
o
n
s
((N
H
4
)2
S
O
4
+
(N
H
4
)N
O
3
),
µ
g
/m
3
reconstructed ions ions from filter sampling
Fig. 2. Hourly reconstructed ions concentrations derived from Eq. (2) and ions concentrations (ammonium nitrate and ammonium sulfate) from manual filter sampling. Horizontal bars stand for the duration of the filter sampling.
low concentrations of sea salt and dust aerosols (typically be-low 1 µg m−3) are then estimated here in fine aerosols, using
a calcium-to-dust ratio of 0.10 (Sciare et al., 2005; Guinot et al., 2007) and a sodium-to-sea salt ratio of 0.306 (Ohta and Okita, 1990). The contribution of dust and sea salt aerosols to the light scattering coefficient (Eq. 1) is then neglected here due to their low concentrations and due to their low mass scattering efficiencies.
Based on these assumptions, Eq. (1) can be re-written as: [ions]=[(NH4)2SO4] + [(NH4)NO3]
=(σsp−4 × [POM])/3) (2)
Hourly concentrations of ions can be derived from this Eq. (2) for the whole period of measurement (23 May–10 June). An overall uncertainty associated with this ion cal-culation is estimated to be of the order of 30% (Sciare et al., 2008b) and takes into account uncertainties associated with the field instruments, OC-to-POM conversion factor, and light scattering efficiencies (αions andαPOM). Despite
this important uncertainty, comparison of this ion dataset with filter data ion measurements (sum of ammonium, ni-trate, sulfate) obtained in parallel and depicted in Sect. 2.2 shows very satisfactory results (slope of 1.03 andr2=0.76;
N=27). Temporal variations of reconstructed ions concen-trations (derived from Eq. 2) and measured ions concentra-tions (obtained with the filter sampling) are reported in Fig. 2 for comparison purposes. The good agreement observed in these 2 datasets further validates the indirect method used here to calculate hourly concentration of ions (ammonium sulfate + ammonium nitrate).
These concentrations of ions (derived from Eq. 2) were summed with concentrations of POM and EC (derived from the ECOC field instrument) in order to reconstruct PM2.5
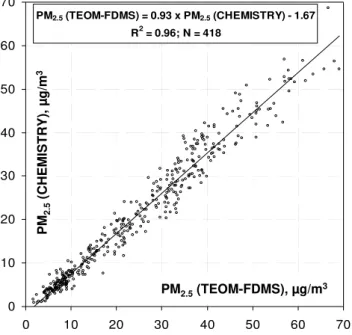
PM2.5 (TEOM-FDMS) = 0.93 x PM2.5 (CHEMISTRY) - 1.67
R2 = 0.96; N = 418
0 10 20 30 40 50 60 70
0 10 20 30 40 50 60 70
PM2.5(TEOM-FDMS), µg/m3
PM
2.5
(CHEMIS
T
RY),
µ
g/m
3
Fig. 3.Comparison between hourly PM2.5concentrations
measure-ments performed by TEOM-FDMS and hourly PM2.5
concentra-tions reconstructed from the chemical analyses by summing EC, POM, and ions.
PM2.5 (noted as PM2.5 (CHEMISTRY)) with PM2.5
con-centrations obtained independently with the TEOM-FDMS monitor is reported in Fig. 3. A very good agreement can be observed here between these two datasets (r2=0.96;
N=418) with a slope close to one (0.93) and an intercept close to zero (−1.7 µg m−3). This good accordance between measured and chemically reconstructed PM2.5demonstrates
again the consistency of the hypotheses used to calculate hourly concentrations of ions and those to reconstruct PM2.5
concentrations.
It can be also noted here that ions and carbonaceous aerosols can be considered as the two major components of Paris fine aerosols during springtime, in agreement with the study by Gros et al. (2007) who have reported that these chemical species (ions and carbonaceous aerosols) con-tributed to almost 95% of the PM2.5in Paris during
spring-time.
3 Model Description
The model used in this study is the Eulerian regional chemistry-transport model CHIMERE in its version V2008b (see http://www.lmd.polytechnique.fr/chimere/). The initial gas phase chemistry scheme has been described by Schmidt et al. (2001) and Vautard et al. (2001), the aerosol modules by Bessagnet et al. (2004 and 2008). The model has been largely applied for continental scale air quality forecast (Honor´e et al., 2008; http://www.prevair.org), and simulations, includ-ing sensitivity studies, with respect to biogenic emissions
(Curci et al., 2009) and inverse emission modeling (Kono-valov et al., 2006). The model has been also extensively used to simulate gas phase pollution levels over the Paris region (e.g., Vautard et al., 2001; Beekmann et al., 2003; Derog-nat et al., 2003; Deguillaume et al., 2007 and 2008), and on several occasions particulate matter (e.g. Bessagnet, 2005; Hodzic et al., 2006).
In this work, the model is set up on three successively nested grids: a continental domain (35◦–57.5◦N; 10.5◦W– 22.5◦E) with 0.5◦ resolution, a regional domain covering Northern France with 9 km resolution and a more refined lo-cal/urban domain covering Ile-de-France region with a 3 km horizontal resolution. In the vertical, eight hybrid-sigma ver-tical layers extend up to 500 hPa, the first layer extends up to about 40 m.
Tropospheric photochemistry is represented using the MELCHIOR chemical mechanism (Lattuati, 1997) that in-cludes 120 reactions and 44 prognostic gaseous species. All major aerosol components are considered, namely primary organic (POA) and black carbon (BC), other unspecified primary anthropogenic components, wind-blown dust, sea salt, secondary inorganics (sulfate, nitrate and ammonium) as well as secondary organic aerosols from anthropogenic and biogenic origin, and particulate water. The model does not provide information on hydrophobic/hydrophilic fractions of organic aerosols. A sectional size distribution over 8 size bins geometrically spaced from 40 nm to 10 µm in physi-cal diameter is chosen. The thermodynamic partitioning of the inorganic mixture (i.e. sulfate, nitrate, and ammonium) is computed using the ISORROPIA model (Nenes et al., 1998). Partitioning of semi-volatile OC of anthropogenic and bio-genic origin is governed by a SOA formation scheme elabo-rated by Pun and Seigneur (2006) and adapted by Bessagnet et al. (2008). The dynamical processes influencing aerosol growth such as nucleation, coagulation and absorption of semi-volatile species are included in the model as described by Bessagnet et al. (2004). Heterogeneous chemical pro-cesses onto particles and a simplified sulfur aqueous chem-istry are also considered. Dry and wet deposition for all gaseous and aerosol species are computed as a function of the friction velocities and stability of the lowest model layer (Wesely, 1988), and as a function of grid-averaged precip-itation rates and cloud water content (Tsyro, 2002). Clear sky photolysis rates are calculated off-line based on the TUV model (Madronich et al., 1998), and they are modified when in the presence of clouds. The numerical method for the tem-poral solution of the stiff system of partial differential equa-tions is adapted from the second order TWOSTEP algorithm originally proposed by Verwer (1994), and is set-up using a time step of 2.5 min for chemistry.
on the nested CHIMERE with horizontal and vertical res-olution given above (Valari and Menut, 2008). MM5 is forced by the NCEP FNL (Final) Operational Global Anal-ysis data from the Global Forecast System (GFS) operated four times a day in near-real time by the American Na-tional Centers for Environmental Prediction (NCEP), using the grid nudging (grid FDDA) option implemented within MM5. Anthropogenic gaseous and particulate emissions are derived from EMEP annual totals (http://www.ceip.at/ emission-data-webdab/) and scaled to hourly emissions ap-plying temporal profiles provided by IER (Friedrich, 1997). For the nested Northern France and Ile-de-France grid, re-fined emissions have been elaborated by the 6 ESMERALDA project partners that are, AIRPARIF, AIR NORMAND, ATMO PICARDIE, ATMO CHAMPAGNE-ARDENNE, ATMO NORD PAS-DE-CALAIS and LIG’AIR. For gas phase species, they stem from a specific cadastre for Ile-de-France and Northern France (Elaboration of an inter-regional emissions inventory for the modeling platform of cartographic previsions ESMERALDA – 2005). For partic-ulate matter emissions, a downscaling algorithm based on CORINE land-use data starting from EMEP annual totals is used to obtain spatially refined data. Splitting of PM2.5
emissions is performed using the emission inventory of Lab-oratoire d’A´erologie (Junker and Liousse, 2008). Biogenic emissions are provided by the MEGAN data base (Guenther et al., 2006). LMDz-INCA monthly mean concentrations are used as boundary conditions (Hauglustaine et al., 2004).
4 Results and discussion of experimental data
A brief description of the temporal variations of PM2.5, ion
species, and carbonaceous aerosols is presented here, based on air masses origin (backtrajectory analysis). Contribu-tions of local/continental emissions are then discussed based on the analysis of mean diurnal variations of each aerosol component, comparison with complementary VOC measure-ments and PM2.5measurements performed in the
neighbor-ing regions of Paris.
4.1 Backtrajectory analysis
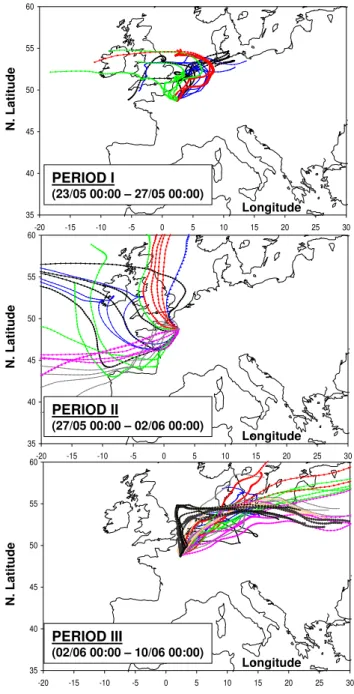
Four-day back trajectories were calculated using the Hysplit Dispersion Model (Hybrid Single – Particle Lagrangian In-tegrated Trajectory; Draxler and Rolph, 2003; Rolph, 2003) with a 500 m height at the end point (sampling site). Ac-cording to the air masses origin, the field campaign could be divided into the 3 distinct periods displayed in Fig. 4. The first period of the campaign (4 days: 23 November 00:00– 27 November 00:00 LT) was characterized by a high pres-sure system associated with air masses moving slowly and originating from Northern-Western Europe (Rhine-Ruhr re-gion). During this period residence time of air masses above continental areas was typically of 72 h or more. The
sec-35 40 45 50 55 60
-20 -15 -10 -5 0 5 10 15 20 25 30
35 40 45 50 55 60
-20 -15 -10 -5 0 5 10 15 20 25 30
35 40 45 50 55 60
-20 -15 -10 -5 0 5 10 15 20 25 30
N. Latitude
Longitude
Longitude
Longitude PERIOD I
(23/05 00:00 – 27/05 00:00)
N. Latitude
N. Latitude
PERIOD II
(27/05 00:00 – 02/06 00:00)
PERIOD III
(02/06 00:00 – 10/06 00:00)
Fig. 4. 4-day backtrajectories ending at Paris (LHVP monitoring station; 500 m above ground level) and calculated every 6 h for the periods I(A), period II(B), and period III(C)depicted in Sect. 4.1.
I II III 0 10 20 30 40 50 60 70
23/05 25/05 27/05 29/05 31/05 02/06 04/06 06/06 08/06 10/06
C oncen tr at io n, µ g /m 3 PM2.5 experimental ions experimental EC+POM experimental
Fig. 5. Hourly PM2.5concentrations measured by TEOM-FDMS,
fine carbonaceous aerosols (EC+POM) and reconstructed fine ions (ammonium nitrate + ammonium sulfate). Periods I and III were influenced by continental (European) air masses; period II was in-fluenced by clean marine air masses. The black star corresponds to the pollution episode (plume case study) depicted in Sect. 5.1.
4.2 Temporal variation of the major chemical constituents of fine aerosols
Hourly concentrations of PM2.5(TEOM-FDMS), ions (sum
of ammonium nitrate and ammonium sulfate calculated as described in the previous section) and carbonaceous aerosols (EC+POM) are reported in Fig. 5 for the 3-week duration of the campaign. The periods I, II, and III previously described from backtrajectory analysis are also reported in this Figure. An average PM2.5concentration of 24.3 µg m−3 was
calcu-lated for this campaign which is close to the yearly (2007) PM2.5 concentration of 21 µg m−3 calculated for the urban
area of Paris and illustrates that this campaign did not un-dergo unusual high levels of PM2.5compared to the rest of
the year.
The first and third periods (continental air masses from North-Western Europe) were characterized by a strong vari-ability in PM2.5, with concentrations ranging from 5 to
al-most 70 µg m−3, with intense but time-limited peak values and mean concentrations higher than the 25 µg m−3EU rec-ommended limit value. Interestingly, all the sharp maxima observed in PM2.5were entirely related to similar maxima in
ions with concentration levels up to 50 µg m−3. This strong covariation observed between PM2.5 and ions observed is
illustrated by the high correlation coefficient calculated be-tween these 2 fractions (r2=0.93). During the periods I and III, ions contributed to almost 75% of the fine aerosol mass.
These results clearly show that the highest levels of PM2.5
(and ions) were observed during the periods with continental air mass advection, possibly suggesting a long range trans-port origin for ion species. Such a continental (European) contribution to PM concentrations and composition in Paris
0 1 2 3 4 5 00 :0 0 03 :0 0 06 :0 0 09 :0 0 12 :0 0 15 :0 0 18 :0 0 21 :0 0 00 :0 0 O
C & BC
, µ g C /m 3 OC BC 0 1 2 3 4 5 00: 00 03: 00 06: 00 09: 00 12: 00 15: 00 18: 00 21: 00 00: 00 OC & BC , µ g C /m 3 OC BC 0 5 10 15 20 25 30 35 00: 00 03: 00 06: 00 09: 00 12: 00 15: 00 18: 00 21: 00 00: 00 io n s , µ g /m 3 40 45 50 55 60 65 70 75 80 85 Re la ti v e H u m idi ty ( RH) , % ions RH 0 5 10 15 20 25 30 35 00 :0 0 03 :0 0 06 :0 0 09 :0 0 12 :0 0 15 :0 0 18 :0 0 21 :0 0 00 :0 0 io n s , µ g /m 3 40 45 50 55 60 65 70 75 80 85 R e la ti v e H u m id it y (R H ), % ions RH
Periods I & III Periods II
Periods II Periods I & III
(A) (B)
(C) (D)
Fig. 6.Diurnal variations of BC and OC concentrations for periods I and III(A)and period II(B). Diurnal variations of ions concentra-tions (derived from Eq. 2) and relative humidity (RH) for periods I and III(C)and period II(D).
has to be investigated more thoroughly against a larger num-ber of observations as it may have important implications for local abatement strategies.
It is interesting to note here that the variability of carbona-ceous aerosols is completely disconnected from that of ions. Their levels were less variable during the campaign, ranging from 5 to 10 µg m−3. Their contribution to PM2.5is
particu-larly weak during the periods I and III when PM2.5is higher
than 25 µg m−3. On the other hand, they represent as much as
75% of PM2.5during the period II (marine air masses) which
is characterized by low levels of PM2.5(and ions).
4.3 Diurnal variations of ions, and carbonaceous aerosols
OC concentrations during period II, the mean diurnal profile of OC remains quite similar for all periods with a first maxi-mum during the afternoon (probably linked to photochemical processes) and a second one concomitant with the evening BC maximum. These results show that local patterns (traffic, photochemistry) can be considered as key factors controlling the diurnal variations of BC and OC, although systematically higher concentrations are observed for these species during periods with continental air masses.
As shown in Fig. 6, the diurnal variability of ions for con-tinental air masses is important with a constant rise during nighttime (from 00:00 to 08:00) when local (traffic) emis-sions are at their lowest level. This increase is followed by a regular decrease observed during daytime (from 08:00 till 17:00). This pattern is somewhat unexpected if we consider that ions originate from long range transport. On the other hand, one must keep in mind that semi-volatile ammonium nitrate is a major component of these ions and should be af-fected by local thermodynamic equilibriums. This is con-firmed by the diurnal variations of Relative Humidity (RH) which shows values below 65% during daytime (from 08:00 till 22:00), but larger values during nighttime. This RH value of 65% stands for the typical limit value above which an inor-ganic salt (ammonium sulfate, ammonium nitrate) becomes hydrated (Wexler and Clegg, 2002). Then it can be reason-ably hypothesized here that the diurnal profile of ions (during continental air masses periods) is mainly governed by the di-urnal variation of semi-volatile ammonium nitrate; accumu-lating during nighttime under favorable thermodynamic con-ditions (wet aerosols) and evaporating during daytime when aerosols become dry. This RH dependence of ammonium ni-trate has been often referred in literature (Ansari and Pandis, 1999; Charron et al., 2004; Sciare et al., 2007). Note also that formation of ammonium nitrate of local/regional origin cannot be excluded here as it will be shown from modeling results in Sect. 5.3.
4.4 Comparison with PM2.5measurements performed in the neighboring regions of Paris
In order to better infer local versus continental contribu-tions to PM2.5levels observed in Paris, the PM2.5
concen-tration levels at 3 different sites, Paris – LHVP (this study), Bethune (suburban monitoring station from the ATMO PAS-DE-CALAIS air quality network), and St Jean (suburban monitoring station from the LIG’AIR air quality network) have been reported in Fig. 7. As displayed in this Figure, the temporal variations of PM2.5 at these sites show
com-mon patterns, with a more pronounced contrast between ma-rine/continental air masses for the Paris-LHVP and St Jean stations than for the Bethune site. Interestingly, most of the sharp PM2.5peaks observed in Paris are also seen at the other
stations with a time lag of few hours suggesting large scale rather than local sources for these maxima. A more quanti-tative comparison can be performed for the 2 closest stations
0 10 20 30 40 50
60 PARIS - LHVP
0 10 20 30 40 50 60
23/05 25/05 27/05 29/05 31/05 02/06 04/06 06/06 08/06 10/06 STATION "ST JEAN"
0 10 20 30 40 50
60 STATION "BETHUNE"
PM
2.5
, µ
g/m
3
PM
2.5
, µ
g/m
3
PM
2.5
, µ
g/m
3
42 43 44 45 46 47 48 49 50 51 52
-7 -2 3 8
STATION "BETHUNE"
PARIS - LHVP STATION "ST JEAN"
N. Latitude
Longitude
(A)
(B)
I
II
III
Fig. 7. (A)Location of 3 ground stations with PM2.5
(TEOM-FDMS) measurements in the neighboring regions of Paris.(B) Tem-poral variation of PM2.5at these 3 stations. Periods noted I, II, and
III correspond to those reported in Sect. 4.1.
(Paris-LHVP and St Jean, located at about 100 km distance). A relatively good agreement is observed for these 2 datasets (r2=0.68) when a time lag of 3 h is applied for the St Jean PM2.5dataset.
inventories which show large emission areas over North-Western Europe for the gas precursors of ion species (NH3,
NOx, SO2). It is also consistent with the fact that ion
produc-tion requires atmospheric ageing to occur and subsequently is expected to show higher values downwind of the emission sources of their gas precursors.
4.5 Comparison with co-located VOC source apportionment results
It is interesting to note here that the influence of air masses origin on ion concentration levels is also observed for oxy-genated VOCs such as acetone and methanol which show much higher baseline levels in continentally influenced than in oceanic air (Gros et al., 2010) (data not shown here). Ace-tone has an intermediate lifetime of about one month with primary sources mainly of biogenic origin but has also an important contribution from secondary sources (namely oxi-dation of non methane hydrocarbon, NMHC). The good ac-cordance between ion species and oxygenated VOCs points to the fact that both fractions are photochemically produced. As shown in Fig. 5, the fact that carbonaceous aerosols are much less dependent on air mass origin suggests that the main sources of these particles may be more local (i.e. within the Greater Paris agglomeration). This is consistent with the diurnal variation of BC and OC (Fig. 6). This is also in line with the results obtained from NMHC measurements (e.g. benzene, toluene, C8- and C9-aromatics) performed in par-allel showing a weak influence of air mass origin, and a major local source (vehicle exhaust) (Gaimoz et al., 2010).
5 Model comparison and simulation of continental versus local contributions
A preliminary interpretation of the temporal variability of experimental data (PM2.5, ion species, and carbonaceous
aerosols) has been proposed in the previous section and has shown that the maxima of PM2.5observed during our study
were mainly due to ion species that could originate from North-Western Europe, spreading over large areas during their transport. The role of local and continental emissions is still difficult to evaluate with our present dataset. Although there are some indications that long range transport may sig-nificantly contribute to the levels of ions in Paris, regional pollution build-up and its contribution to the levels of ions (and carbonaceous aerosols) cannot be ruled out. Changes in meteorological conditions (ventilation, boundary height, thermodynamic equilibrium) and in photochemistry that oc-cur between marine and continental air masses may also sig-nificantly affect the levels and composition of PM2.5in a way
that is hardly predictable using solely experimental dataset. The apparent weak contribution of European carbonaceous aerosols compared to local emissions requires also more at-tention. Discrimination between primary and secondary
or-ganic aerosol may be needed here to better identify the origin of this carbonaceous matter.
In order to better distinguish the local from the con-tinental contribution to PM2.5 concentrations and
chemi-cal composition, a comprehensive chemichemi-cal transport model (CHIMERE) is used here and its results are compared with experimental data. A first qualitative approach of local/continental influences is presented for two consec-utive pollution events. Model outputs are then tested against observations for PM2.5, ions, and carbonaceous
aerosols (EC+POM). Different scenarios are investigated us-ing CHIMERE, “switchus-ing” OFF consecutively the local and EU sources of gas precursors of ions and carbonaceous aerosols. At last, a focus is put on carbonaceous aerosols; different experimental methods are used to discriminate be-tween primary and secondary organic aerosols and are then compared with model output in order to depict their local-to-continental contribution.
5.1 Plume case study
Two consecutive (partly overlapping) pollution events mod-eled by CHIMERE for 4 June are displayed in Fig. 8; a first one for fine nitrate (3 June 20:00 LT–4 June 12:00 LT) and a second for fine sulfate (4 June 04:00 LT–5 June 01:00 LT).
The first episode (Fig. 8a) shows a nitrate plume progress-ing from Benelux to the Paris region. It corresponds to the period noted with a black star in Fig. 5. Inspection of gaseous precursor emissions suggests that ammonium nitrate forma-tion occurs as a result of strong NOx emissions over the
Rhine-Ruhr region oxidizing to HNO3, and mixing with air
masses having encountered strong ammonia emissions over the Netherlands and Belgium.
The second episode (Fig. 8b) occurs a day later and shows a burst in concentration of fine sulfate over a large area (Rhine-Rhur region, North of France, Central England) within few hours (4 June in the morning). Most of this burst corresponds to intense in-situ photochemical oxidation of SO2. It should be noted that the region of Paris is located
at the limit of the geographic zone where these two events occurred which may partly explain the time-limited duration of these episodes over the region (Fig. 5). Note also that these two events simulated by CHIMERE highlight the ma-jor role of gas precursors (NOx, SO2) and their potential to
be transported and converted into fine nitrate and sulfate far from their emission sources.
5.2 Temporal variation of experimental and modelled fine aerosol constituents
Comparison between modelled and experimentally deter-mined concentrations of PM2.5, ions and carbonaceous
0 10 20 30 40 50 60
23/05 25/05 27/05 29/05 31/05 02/06 04/06 06/06 08/06 10/06
io
ns
ex
pe
ri
m
e
nt
a
l, µ
g
/m
3
ions model ions experimental
0 10 20 30 40 50 60 70 80 90 100
23/05 25/05 27/05 29/05 31/05 02/06 04/06 06/06 08/06 10/06
PM
2.
5
, µ
g
/m
3
PM2.5 model PM2.5 experimental
FIGURE 9
I
II
III
(A)
(B)
(C)
0 10 20 30 40 50
23/05 25/05 27/05 29/05 31/05 02/06 04/06 06/06 08/06 10/06
E
C
+
P
O
M
, µ
g
/m
3
EC+POM model EC+POM experimental
ions
, µ
g/m3
Fig. 9.Comparison between modeled and measured concentrations of PM2.5(A), ion species (ammonium nitrate + ammonium sulfate)
(B), and carbonaceous matter (EC+POM)(C). Periods noted I, II, and III correspond to those reported in Sect. 4.1.
time-resolved (hourly) experimental determination of ions and carbonaceous matter.
Measured and modelled PM2.5 have shown to be
cor-related (r2=0.63; N =354) with a slope of 1.10 (i.e. ∼10% underestimation of model results) and intercept of 3.4 µg m−3. First, the general good agreement observed in
this Figure for all the chemical constituents of fine aerosols demonstrates the capability of the model to account for most of their variability and concentrations observed in Paris. As previously reported from experimental data (Sect. 4), the model results clearly show that all the temporal variability of PM2.5is due to a similar one in ions. The poor temporal
vari-ability of carbonaceous matter is also properly reproduced by the model.
“EU” grid domain
“IDF” grid domain
TOTAL grid domain “EU” grid domain
“IDF” grid domain
TOTAL grid domain
Fig. 10.Grid domain of the chemistry transport model CHIMERE. In blue the “IDF” domain comprises the Ile-de-France region sur-rounding Paris; in red the “EU” domain comprises part of North-Western and Central Europe.
Few discrepancies are observed between experimental and modelled results and concern mainly a simulated – but not observed – peak of carbonaceous aerosols (25 May) and, second, a peak of ions observed for the period (7–9 June) not seen by the model. On 25 May, simulated carbona-ceous aerosol is largely overestimated (as well as NOx).
This is due to an underestimated boundary layer height, sim-ulated at below 200 m at 08:00 UTC, as compared to an observed one at about 500 m (from aerosol backscatter li-dar measurements at the SIRTA site 20 km in SW of Paris centre, http://sirta.ipsl.polytechnique.fr/data-search/2.html). The non-reproduction by the model of a peak of ions ob-served for the period (7–9 June) may be due to several rea-sons: a weak model capability to properly reproduce in time and space rain events which has been made evident for this episode by comparing simulated precipitation fields with ob-served ones (from rain radar). In general, errors in humid-ity and cloud water content could also affect ion formation. Last, a fraction of ions is simulated to appear in the coarse mode, which is probably due to numerical diffusion either in the coagulation or condensation scheme.
5.3 Model evaluation of the local-to-continental contribution to PM2.5levels in Paris
I II III
(A)
(B)
0 5 10 15 20
23/05 25/05 27/05 29/05 31/05 02/06 04/06 06/06 08/06 10/06
NO
3
, µ
g
/m
3
NO3 model 'all emissions'
NO3 model 'zero local emissions'
NO3 model 'zero EU emissions'
0 5 10 15
23/05 25/05 27/05 29/05 31/05 02/06 04/06 06/06 08/06 10/06
SO
4
, µ
g
/m
3
SO4 model 'all emissions'
SO4 model 'zero local emissions'
SO4 model 'zero EU emissions'
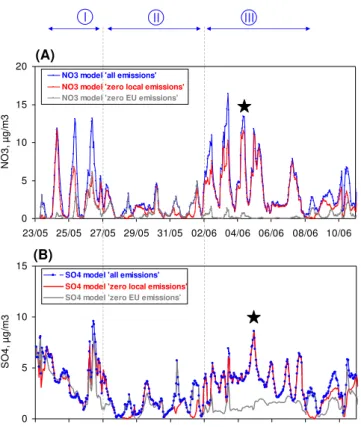
Fig. 11. Model scenarios for fine nitrate(A)and fine sulfate(B) for the reference run (“all emissions” in blue); the scenario with no local (IDF) emissions (“zero local emissions” in red); and the scenario with no European (EU) emissions (“zero EU emissions” in grey). The black star corresponds to the pollution episode (plume case study) depicted in Sect. 5.1.
domain labelled “IDF” (standing for Ile-de-France region) comprises the region of Paris; the second region (labelled “EU”) comprises a part of North-Western and Central Eu-rope. Two different scenarios are then evaluated in the fol-lowing, based on these two grid domains:
– A first scenario labelled “zero local emissions” in which all anthropogenic and biogenic gas and particulate mat-ter emissions from the Ile-de-France region have been removed.
– A second scenario labelled “zero EU emissions” in which all emissions from the EU domain have been re-moved.
Fine nitrate and fine sulfate simulated with these different scenarios are reported in Fig. 11. The reference run is la-belled as “all emissions” in this Figure. Note that the sum of the red (zero local emissions) and grey lines (zero EU emis-sions) can exceed the blue line (reference) in Fig. 8, due to non-additive effects (thermodynamic equilibrium, impact of emissions on OH...) and emissions for the rest of Europe (out of the two domains defined in Fig. 10).
Model scenarios for nitrate:as shown in Fig. 11a, the ni-trate “zero local emissions” curve is often close to the one of the nitrate reference run (“all emissions”). This indicates that local emissions (NOx, NH3) do not contribute significantly
to the observed nitrate concentrations. On few occasions, lo-cal emissions can contribute significantly to nitrate as it can be seen for the mornings of 26 May, 27 May, 2 June, 3 June, and 10 June. Nevertheless, most of the sharp maxima ob-served in nitrate concentrations cannot be explained by local emissions and necessarily involve a significant contribution from abroad. For the second scenario (zero EU emissions), modelled nitrate concentrations modelled are very low which clearly shows that the EU domain defined in Fig. 10 is the major contributor to nitrate concentrations observed in Paris during periods with continental air masses. A raw calcula-tion shows that the EU domain contributes here as much as 75% of the nitrate concentrations modelled over Paris, local emissions contributing to the remaining 25%.
Model scenarios for sulfate:as shown in Fig. 11b, the sul-fate “zero local emissions” curve is almost entirely related to the one of the sulfate reference run (“all emissions”). This clearly indicates that local emissions cannot be considered as a significant source of sulfate in Paris. It is very interesting to note here that the scenario “zero EU emissions” still shows significant modelled sulfate concentrations. This indicates that sulfate concentrations observed in Paris may originate from a larger European domain that the EU domain defined in Fig. 10. A raw calculation shows that the EU domain con-tributes here to about 40% of the sulfate concentrations mod-elled over Paris, local emissions contributing only to 15%.
All these results on nitrate and sulfate unambiguously show the major contribution of emissions from the North-Western/Central Europe, especially during the periods with high PM2.5concentrations, pointing out the need for larger
scale abatement strategies to reduce PM2.5 in the Paris
re-gion. These results are consistent with literature which has reported a major contribution of regional (trans-boundary) origin for secondary inorganic salts in selected European cities (Querol et al., 2004; Abdalmogith and Harisson, 2005; Salvador et al., 2008).
5.4 Experimental evaluation of primary and secondary organic aerosols
It has been shown previously, that a dominant fraction of car-bonaceous aerosols (EC+POM) was of local origin. How-ever, this does not necessarily imply that all these particles are of primary origin. As shown in Fig. 6 the increase of OC in the afternoon is observed at the maximum of so-lar radiation and may correspond to a secondary production mechanism of organic aerosol, probably induced by photo-chemistry. This result is consistent with the photochemical production of organics reported and discussed in details by Favez et al. (2007) for the Paris region during summer. Two different methods are applied hereafter to estimate experi-mentally the fraction of secondary organic aerosols.
The “WSOC” method:the first one is based on the use of WSOC as a proxy for oxygenated secondary organics. There are many known sources for organic compounds that are sol-uble in water. These include both primary emissions and secondary products from both biogenic sources and anthro-pogenic sources (e.g. Forstner et al., 1997; Seinfeld and Pan-dis, 1998; Kroll et al., 2005). Many of the biomass burning compounds are also watersoluble (Novakov and Corrigan, 1996; Narukawa et al., 1999; Graham et al., 2002; Mayol-Bracero et al., 2002). During our study, the biomass burn-ing contribution to carbonaceous aerosols is considered as negligible. This is supported by co-located VOC measure-ments showing a very low contribution (2%) of the wood burning source (Gaimoz et al., 2010). This is also supported by an averaged angstrom exponent value (deduced from the 7-wavelenght aethalometer) close to 1.0, a value which is characteristic for fossil fuel absorbing aerosols (Sandradewi et al., 2008). In the absence of biomass burning, the major WSOC source is thought to be from SOA formation from semi-volatile VOC (Saxena and Hildemann, 1996). A large amount of studies have reported the strong connection be-tween WSOC and secondary organics – possibly of biogenic origin – and have concluded that SOA could be approximated by WSOC (Sullivan et al., 2004; Heald et al., 2006; Myazaki et al., 2006; Kondo et al., 2007; Sullivan et al., 2006; Weber et al., 2007; Hennigan et al., 2008a, b). Based on these stud-ies and the weak contribution of biomass burning aerosols, our WSOC data have been considered as a good surrogate for SOA. Primary organic aerosols (POA) are then assumed to correspond to water insoluble organic matter (WIOM). WSOM and WIOM are calculated here using WSOC and WIOC data from filter sampling. WSOC-to-WSOM and WIOC-to-WIOM conversion factors of 2.1 and 1.3, respec-tively, are taken here (Turpin and Lim, 2001; Zhang et al., 2005).
The “EC-tracer” method: this method is often used in literature to derive SOA (e.g. Turpin and Huntzicker, 1991; Turpin and Huntzicker, 1995; Strader et al., 1999; Lim and Turpin, 2002; Cabada et al., 2004). It is based on the use of a minimum in the OC/EC ratio which can be related to primary
emissions and which is used to calculate POA; any increase of the OC/EC above this minimum is considered to be re-lated to a secondary production of organic aerosols. One of the critical issues in using this method is the proper choice of OC/EC ratio of primary origin. Our lowest OC/EC ra-tios (∼0.7) were taken as the one characteristic for primary emissions. These ratios were observed at the morning peak of EC (traffic) and for the period II which is characterized by air masses originating from the ocean (i.e. minimizing continental emissions of gas and particulate organic mate-rial). These ratios of 0.7 are in good agreement with those reported by Lonati et al. (2007) and El Haddad et al. (2009) for measurements performed in tunnels in Italy and France, respectively. Primary organic carbon (POC) was then calcu-lated using the equation [POC]/[EC]=0.7. Secondary Or-ganic Carbon (SOC) was then calculated as the difference between OC and POC. SOA and POA from the EC-tracer method were calculated using a SOC to SOA and POC to POA conversion factors of 2.1 and 1.3, respectively (Turpin and Lim, 2001; Zhang et al., 2005).
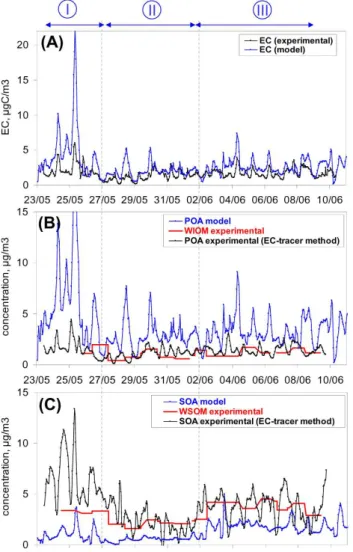
Fig. 12.Comparison of EC(A), POA(B), and SOA(C)determined from the CHIMERE model (in blue); the “EC-tracer” method (in black); and the “WSOC” method (in red).
5.5 Comparison between modelled and experimentally determined primary and secondary organic aerosols
Measured and modeled concentration of carbonaceous aerosols (EC+POM) has shown previously quite similar con-centration levels (Fig. 9c). Comparison of the different car-bonaceous fractions (EC, POA, SOA) is much less satisfac-tory (Fig. 12). Although averaged measured and modeled EC concentrations are quite similar, they present a poor cor-relation coefficient (r2=0.52). Modeled POA is a factor of two higher than the EC-tracer derived POA. By contrast, model derived SOA is a factor of two lower compared to the one estimated with the EC-tracer method. Consequently, the concordance between modeled and measured concentration of carbonaceous aerosols (EC+POM) observed in Fig. 9c is mainly due to compensating errors resulting in an over-estimation (respectively underover-estimation) of POA
(respec-tively SOA). Overestimation of modeled POA may be due to the fact that POA is considered as non-volatile in the model while it has been recognized recently of being volatile (Robinson et al., 2007). Understimation of simulated SOA is not unexpected, because several potentially important SOA sources (evaporation and aging of POA, oligomerisation) are not considered here. In the model, EC and POA are clearly of local origin, which is consistent with the disconnected vari-ations of carbonaceous aerosol and ions observed in experi-mental data. However, due to the underestimation of SOA, the model cannot be used at this stage to further conclude on the local/continental origin of experimentally derived SOA.
6 Conclusions
Time-resolved measurements of the chemical composition of fine aerosols were performed in Paris (France) during spring-time and used to calculate hourly concentrations of ions (ammonium nitrate + ammonium sulfate) and carbonaceous aerosols (EC+POM) in PM2.5. These two components have
been shown to be the main contributors to PM2.5in Paris,
al-though their fraction appeared to be highly variable, ranging from 25 to 75%.
Periods with high levels of PM2.5(>10–15 µg m−3) were
shown to be associated with continental air masses regimes and were mainly composed of ions. During these periods, diurnal variations of ions in Paris were dependent on lo-cal thermodynamic conditions responsible for the conden-sation/evaporation of semi-volatile ammonium nitrate. The comparison of our PM2.5 dataset with others obtained in
the North of France during the same period has shown that these intense pollution episodes were not a local pattern of the region of Paris but corresponded to spatially extended phenomena originating from continental Europe. Compari-son with VOC measurements performed in parallel has re-vealed a close relationship between ions and oxygenated VOCs (methanol, acetone) with higher concentrations dur-ing periods influenced by continental air masses. Both frac-tions being produced through photochemical processes, their apparent concordance suggested that Paris region was under the influence of continental photochemically aged air masses during the episodes with elevated PM2.5 levels. In contrast
with ion species, concentrations of carbonaceous aerosols observed during this study were less variable (weakly influ-enced by air masses origin), suggesting a more local pattern, at least for the primary fraction of this fraction.
In order to determine local and continental contributions to the concentration levels and composition of fine aerosols over the Paris region, chemistry transport model simulations were performed with the CHIMERE model. The comparison appeared to be satisfactory, the model being able to predict most of the occurrences of observed PM2.5and ion species
Different scenarios were evaluated with this model, switching OFF local and continental emissions, respectively. Results obtained for ions clearly showed a major influence of continental emissions (North-Western and Central Europe), with a contribution of about 75% and 40% for nitrate and sulfate, respectively. Although these results clearly need to be extended for larger time periods, they suggest that EU emissions may play a significant role during periods with high PM2.5 levels over the Paris region. This result is
rel-evant for local policy makers who have to propose efficient abatement strategies aiming at reducing PM2.5concentration
levels in the context of an EU limit value of 25 µg m−3 in 2015 (20 µg m−3in 2020). On the other hand, implications of our results for health issues are less evident since the PM2.5
peak values of fine aerosols observed during our study were mainly composed of ions, which present a poor toxicity in comparison to other trace elements in fine aerosols (metals, PAH, . . . ).
Finally, the local/continental contribution to secondary or-ganic aerosols measured over Paris has been investigated. Two different methods were used to experimentally estimate the secondary fraction of organic aerosols and showed that SOA were likely to play a major role in Paris during spring-time, representing about 75% of the total mass concentra-tion of organic aerosols. As expected, periods influenced by photochemically processed continental air masses showed the highest concentrations of SOA. Surprisingly, our results suggest that the abundance of SOA (relatively to OA) did not exhibit significant changes between the periods influenced by clean marine and photochemically processed continental air masses, respectively. Although this work has provided lim-ited information on (S)OA, these results suggest that regional emissions may have been quite important and/or have reacted quite rapidly, bringing the relative abundance of SOA at simi-lar levels compared to continental aged air masses. Compar-ison between modeled and measured primary (respectively secondary) organic aerosols has shown significant discrepan-cies with overestimation (respectively underestimation) by a factor of 2 for model calculation, pointing out the need for a better model evaluation of processes leading to SOA.
Acknowledgements. This work was supported by the Agence Na-tionale de la Recherche (ANR) through the AEROCOV project, ADEME, CNRS, and CEA. Authors want to acknowledge LHVP (A. Person, Y. Le Moullec) for having hosted this field exper-iment. Contribution of local air quality networks (AIRPARIF, LIGAIR, ATMO NORD PAS-DE-CALAIS, AIR NORMAND, ATMO CHAMPAGNE-ARDENNE, and ATMO PICARDIE) are also acknowledged here through the access of PM2.5data at Paris,
Bethune, and St Jean and emission data. Modeling results have been obtained under Ph-D grant funding by CIFRE (ANRT) attributed to ARIA Technologies and LISA. The authors gratefully acknowledge the NOAA Air Resources Laboratory (ARL) for the provision of the HYSPLIT transport and dispersion model and/or READY website (http://www.arl.noaa.gov/ready.php) used in this publication.
Edited by: M. Kanakidou
The publication of this article is financed by CNRS-INSU.
References
Abdalmogith, S. S. and Harrison, R. M.: The use of trajectory clus-ter analysis to examine the long-range transport of secondary inorganic aerosol in the UK, Atmos. Environ., 39, 6686–6695, 2005.
Ansari, A. S. and Pandis, S. N.: An analysis of four models pre-dicting the partitioning of semi-volatile inorganic aerosol com-ponents, Aerosol Sci. Tech., 31, 129–153, 1999.
Arhami, M., Kuhn, T., Fine, P. M., Delfino, R. J., and Sioutas, C.: Effects of sampling artifacts and operating parameters on the performance of a semicontinuous particulate elemental car-bon/organic carbon monitor, Environ. Sci. Technol., 40, 945– 954, 2006.
Arnold, S. R., Spracklen, D. V., Williams, J., Yassaa, N., Sciare, J., Bonsang, B., Gros, V., Peeken, I., Lewis, A. C., Alvain, S., and Moulin, C.: Evaluation of the global oceanic isoprene source and its impacts on marine organic carbon aerosol, Atmos. Chem. Phys., 9, 1253–1262, doi:10.5194/acp-9-1253-2009, 2009. Bae, M. S., Schauer, J. J., DeMinter, J. T., Turner, J. R., Smith,
D., and Cary, R. A.: Validation of a semi-continuous instrument for elemental carbon and organic carbon using a thermal-optical method, Atmos. Environ., 38, 2885–2893, 2004.
Beekmann, M. and Derognat, C.: Monte Carlo uncertainty analy-sis of a regional scale transport chemistry model constrained by Measurements from the Esquif campaign, J. Geophys. Res., 108, 8559, doi:10.1029/2003JD003391, 2003.
Bessagnet, B., Hodzic, A., Vautard, R., Beekmann, M., Cheinet, S., Honor´e, C., Liousse, C., and Rouil, L.: Aerosol modelling with Chimere – Preliminary evaluation at the continental scale, Atmos. Environ., 38, 2803–2817, 2004.
Bessagnet, B., Hodzic, A., Blanchard, O., Lattuati, M., Le Bihan, O., Marfaing, H., and Rouil, L.: Origin of particulate matter pol-lution episodes in wintertime over the Paris basin, Atmos. Envi-ron., 39, 6159–6174, 2005.
Bessagnet, B., Menut, L., Curci, G., Hodzic, A., Guillaume, B., Liousse, C., Moukhtar, S., Pun, B., Seigneur, C., and Schulz, M.: Regional modeling of carbonaceous aerosols over Europe – focus on secondary organic aerosols, J. Atmos. Chem., 61, 175– 202, 2008.
Birch, M. E. and Cary, R. A., Elemental carbon-based method for monitoring occupational exposures to particulate diesel exhaust, Aerosol Sci. Tech., 25, 221–241, 1996.
Charron, A., Harrison, R. M., Moorcroft, S., and Booker, J.: Quan-titative interpretation of divergence between PM10 and PM2.5
mass measurement by TEOM and gravimetric (Partisol) instru-ments, Atmos. Environ., 38, 415–423, 2004.
Curci, G., Beekmann, M., Vautard, R., Smiatek, G., Steinbrecher, R., Theloke, J., and Friedrich, R.: Modelling study of the impact of isoprene and terpene biogenic emissions on European ozone levels, Atmos. Environ., 43, 1444–1455, 2009.
Derognat, D., Beekmann, M., Baeumle, M., Martin, D., and Schmidt, H.: Effect of biogenic VOC emissions on the tropo-spheric chemistry during elevated ozone periods in Ile de France, J. Geophys. Res., 108, 8560, doi:10.1029/2001JD001421, 2003. Deguillaume, L., Beekmann, M., and Menut, L.: Bayesian Monte Carlo analysis applied to regional scale inverse emission mod-elling for reactive trace gases, J. Geophys. Res., 112, D02307, doi:10.1029/2006JD007518, 2007.
Deguillaume, L., Beekmann, M., and Derognat, C.: Uncertainty evaluation of ozone production and its sensitivity to emission changes over the Ile-de-France region during summer periods, J. Geophys. Res., 113, D02304, doi:10.1029/2007JD009081, 2008. Draxler, R. R. and Rolph, G. D.: HYSPLIT (HYbrid Single-Particle Lagrangian Integrated Trajectory) Model access via NOAA ARL READY Website (http://www.arl.noaa.gov/ HYSPLIT.php), NOAA Air Resources Laboratory, Silver Spring, MD, 2003.
Dudhia, J.: A nonhydrostatic version of the Penn State/NCAR mesoscale model: validation tests and simulation of an Atlantic cyclone and cold front, Mon. Weather Rev., 121, 1493–1513, 1993.
El Haddad, I., Marchand, N., Dron, J., Temime-Roussel, B., Quivet, E., Wortham, H., Jaffrezo, J. L., Baduel, C., Voisin, D., Be-sombes, J. L., and Gille, G.: Comprehensive primary particu-late organic characterization of vehicular exhaust emissions in France, Atmos. Environ., 43(39), 6190–6198, 2009.
Fan, X., Lee, P. K. H., Brook, J. R., and Mabury, S. A.: Improved measurement of seasonal and diurnal differences in the carbona-ceous components of urban particulate matter using a denuder-based air sampler, Aerosol Sci. Technol., 38, 63–69, 2004. Favez, O., Cachier, H., Sciare, J., and Le Moullec, Y.:
Characteriza-tion and contribuCharacteriza-tion to PM2.5of semi-volatile aerosols in Paris
(France), Atmos. Environ., 41, 7969–7976, 2007.
Favez, O., Sciare, J., Cachier, H., Alfaro, S. C., and Abdelwahab, M. M.: Significant formation of water-insoluble secondary or-ganic aerosols in semi-arid urban environment, Geophys. Res. Lett., 35, L15801, doi:10.1029/2008GL034446, 2008.
Forstner, H. J. L., Seinfeld, J. H., and Flagan, R. C.: Secondary or-ganic aerosol from the photooxidation of aromatic hydrocarbons: Molecular composition, Environ. Sci. Technol., 31, 1345–1358, 1997.
Friedrich, R.: GENEMIS: assessment, improvement, temporal and spatial disaggregation of European emission data, in: Tropo-spheric Modelling and Emission Estimation, Part 2., edited by: Ebel, A., Friedrich, R., and Rhode, H., Springer, New York, 181– 214, 1997.
Gaimoz, C., Sauvage, S., Gros, V., Herrmann, F., Williams, J., Locoge, N., Perrussel, O., Bonsang, B., d’Argouges, O., Sarda-Est`eve, R., and Sciare, J.: Volatile organic compounds sources in Paris in spring 2007. Part II: source apportionment using positive matrix factorization, Environ. Chem., in press, 2010.
Graham, B., Mayol-Bracero, O. L., Guyon, P., Roberts, G. C., Decesari, S., Facchini, M. C., Artaxo, P., Maenhaut, W., K¨oll, P., and Andreae, M. O.: Water-soluble organic compounds in biomass burning aerosols over Amazonia: 1. Characteriza-tion by NMR and GC-MS, J. Geophys. Res., 107(D20), 8047, doi:10.1029/2001JD000336, 2002.
Gros, V., Sciare, J., and Yu, T.: Air Quality Air-quality measure-ments in megacities: Focus on gaseous organic and particulate pollutants and comparison between two contrasted cities, Paris and Beijing, C. R. Geosci., 339, 764–774, 2007.
Gros, V., Gaimoz, C., Herrmann, F., Custer, T., Williams, J., Bon-sang, B., Sauvage, S., Locoge, N., d’Argouges, O., Sarda-Est`eve, R., and Sciare, J.: Volatile organic compounds sources in Paris in spring 2007. Part I: qualitative analysis, Environ. Chem., in press, 2010.
Grover, B. D., Kleinman, M., Eatough, N. L., Eatough, D. J., Hopke, P. K., Long, R. W., Wilson, W. E., Meyer, M. B., and Ambs, J. L.: Measurement of total PM2.5 mass (nonvolatile
plus semivolatile) with the Filter Dynamic Measurement System tapered element oscillating microbalance monitor, J. Geophys. Res., 110, D07S03, doi:10.1029/2004JD004995, 2005. Guenther, A., Karl, T., Harley, P., Wiedinmyer, C., Palmer, P. I.,
and Geron, C.: Estimates of global terrestrial isoprene emissions using MEGAN (Model of Emissions of Gases and Aerosols from Nature), Atmos. Chem. Phys., 6, 3181–3210, doi:10.5194/acp-6-3181-2006, 2006.
Guinot, B., Cachier, H., and Oikonomou, K.: Geochemical perspec-tives from a new aerosol chemical mass closure, Atmos. Chem. Phys., 7, 1657–1670, doi:10.5194/acp-7-1657-2007, 2007. Gurjar, B. R., Butler, T. M., Lawrence, M. G., and Lelieveld, J.:
Evaluation of emissions and air quality in megacities, Atmos. Environ., 42, 1593–1606, 2008.
Hauglustaine, D. A., Hourdin, F., Jourdain, L., Filiberti, M.-A., Walters, S., Lamarque, J.-F., and Holland, E. A.: Interac-tive chemistry in the Laboratoire de M´et´eorologie Dynamique general circulation model: Description and background tropo-spheric chemistry evaluation, J. Geophys. Res., 109, D04314, doi:10.1029/2003JD003957, 2004.
Heald, C. L., Jacob, D. J., Turquety, S., Hudman, R. C., Weber, R. J., Sullivan, A. P., Peltier, R. E., Atlas, E. L., de Gouw, J. A., Warneke, C., Holloway, J. S., Neuman, J. A., Flocke, F. M., and Seinfeld, J. H.: Concentrations and sources of organic carbon aerosols in the free troposphere over North America, J. Geophys. Res., 111, D23S47, doi:10.1029/2006JD007705, 2006. Hennigan, C. J., Bergin, M. H., Dibb, J. E., and Weber, R.
J.: Enhanced secondary organic aerosol formation due to wa-ter uptake by fine particles, Geophys. Res. Lett., 35, L18801, doi:10.1029/2008GL035046, 2008a.
Hennigan, C. J., Sullivan, A. P., Fountoukis, C. I., Nenes, A., Heco-bian, A., Vargas, O., Peltier, R. E., Case Hanks, A. T., Huey, L. G., Lefer, B. L., Russell, A. G., and Weber, R. J.: On the volatil-ity and production mechanisms of newly formed nitrate and wa-ter soluble organic aerosol in Mexico City, Atmos. Chem. Phys., 8, 3761–3768, doi:10.5194/acp-8-3761-2008, 2008b.
Hodzic, A., Vautard, R., Chazette, P., Menut, L., and Bessagnet, B.: Aerosol chemical and optical properties over the Paris area within ESQUIF project, Atmos. Chem. Phys., 6, 3257–3280, doi:10.5194/acp-6-3257-2006, 2006.