The use of CBERS (China-Brazil Earth Resources Satellite) to trace the
dynamics of total suspended matter at an urbanized coastal area
The distribution of organic and inorganic particles
in the water column, or the total suspended matter
(TSM), responds to local and remote oceanographic
and meteorological processes, potentially impacting
biogeochemical cycles. In shallow coastal areas,
where particles have distinct origins and compositions
and vary in diferent time scales, the use of remote
sensing tools for monitoring and tracing this material
is highly encouraged due to the high temporal and
spatial data resolution. The objective of this work
was to understand the variability of
in situ
TSM at
Santos Bay (Southeastern Brazil) and its response
to oceanographic and meteorological conditions. We
also aimed to verify the applicability of the satellite
data from CBERS-2 sensor in order to map the
dynamics of TSM in this region. Our results have
shown that the distribution of TSM in Santos Bay
varied consistently with winds, currents and tidal
cycles, with signiicant relationships emphasizing
the role of south-western winds and spring tides.
Neap tides and eastern winds, along with rainfall,
play an important role in the input of organic matter
into the bay. In conclusion, our analyses showed
that the main patterns observed
in situ
regarding
the responses of TSM to the ocean-meteorological
processes could be reproduced in the CBERS-2
satellite data, after simple and standard methods
of images processing. TSM data retrieval from
CBERS-2 or other satellite sensors were shown to
be feasible, becoming an essential tool for synoptic
observations of the composition and quality of water,
especially at urbanized and impacted coastal areas.
AbstrAct
Maria Fernanda Colo Giannini
1,2*, Joseph Harari
3, Aurea Maria Ciotti
11 Centro de Biologia Marinha - USP (CEBIMar/USP)
(Rod. Dr. Manoel Hipólito do Rêgo, S/N - Praia do Cabelo Gordo, São Sebastião - SP, 11600-000) 2 Universidade Estadual Paulista - Campus do Litoral Paulista (Unesp-CLP)
(Praça Infante Dom Henrique, s/n - Parque Bitaru, São Vicente - SP, 11330-900) 3 Instituto Oceanográico da Universidade de São Paulo (IO-USP)
(Praça do Oceanográico, 191, Butantã - São Paulo - 05508-120)
*Corresponding author: [email protected]
Descriptors:
CBERS program, Santos Bay, Remote
sensing, Suspended matter.
A distribuição de partículas orgânicas e inorgânicas na
coluna d'água, ou o material em suspensão total (MST),
responde a processos oceanográicos e meteorológicos
locais e remotos, que potencialmente impactam
proces-sos biogeoquímicos. Em áreas costeiras, onde partículas
possuem diferentes origens e composições e variam em
diferentes escalas de tempo, o uso de ferramentas de
sen-soriamento remoto para monitoramento e mapeamento
desse material é altamente indicado devido à alta
resolu-ção temporal e espacial dos dados. O objetivo desse
tra-balho foi compreender a variabilidade do MST
in situ
na
Baía de Santos (sudeste brasileiro) e sua resposta a
con-dições oceanográicas e meteorológicas. Buscou-se tam
-bém veriicar a aplicabilidade dos dados de satélite do
sensor CBERS-2 a im de mapear a dinâmica do MST na
região. Nossos resultados mostraram que a distribuição
do MST na Baía de Santos variou consistentemente com
os ventos, correntes e ciclos de maré, com correlações
signiicantes que enfatizam o papel de ventos de sudoes
-te e da maré de sizígia. Marés de quadratura e ventos de
leste, somados à precipitação, possuem papel importante
na entrada de matéria orgânica na baía. Como
conclu-são, nossas análises mostraram que os principais padrões
observados
in situ
em relação às respostas do MST aos
processos meteorológicos e oceanográicos poderiam
ser reproduzidas nos dados do satélite CBERS-2, após
métodos padrões de processamento de imagens. A
ob-tenção de dados de MST a partir do CBERS-2 ou outros
sensores satelitais mostrou-se viável, tornando-se uma
ferramenta essencial para observações sinóticas da
com-posição e qualidade da água, especialmente em áreas
costeiras urbanizadas e impactadas.
resumo
Descritores:
Programa CBERS, Baía de Santos,
Sensoriamento remoto, Material em suspensão.
INTRODUCTION
Understanding the sources, sinks and transport of materials in aquatic environments is important, especially in regions that have been substantially altered by human occupation. In coastal and estuarine regions, water quality may be inferred from optical properties such as turbidity and surface relectance (BUKATA et al., 1995), both of which are afected by the concentration and quality of particulate and dissolved materials and their respective spectral interaction with the solar irradiance (see IOCCG, 2000). The color of water can be measured either in situ or through remote sensing techniques and this information can be used for water quality studies and management once appropriate models are applied (GREEN et al., 2000; PHINN et al. 2005). In coastal waters, the total particulate suspended matter has fundamental importance in light scattering and relectance (DEKKER et al., 2001), and consequently water transparency and its consequence for local primary productivity rates. Nonetheless, speciically in the green and blue portions within the visible bands, the colored dissolved organic matter, known as CDOM, tends to dominate water optical properties via light absorption (e.g. BOWERS et al., 2004). It is expected, therefore, that remote sensing techniques can provide information regarding the relative proportion of particulate and dissolved constituents afecting the optical signal of water bodies.
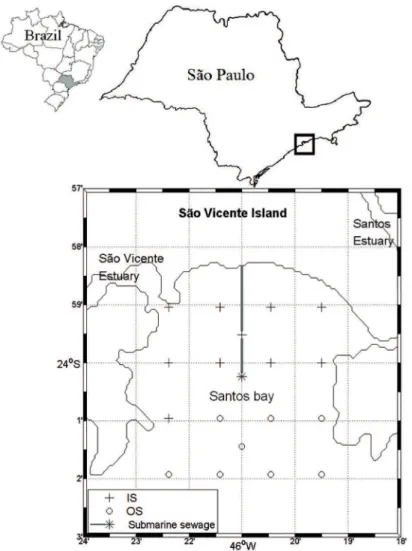
Santos Bay (Figure 1; 24.01°S and 46.35°W) is located on the southern coast of São Paulo state (SE Brazil) and comprises an urbanized estuarine complex where extensive tourism, industrial and ishing activities take place. It occupies an area of 30 km², with average depth of 15 m, and faces S-SE (DHN, 2003). The largest Brazilian commercial port and a number of plants are situated adjacent to the main estuarine channel. Because of that, Santos Bay receives organic and inorganic materials from several sources, which include estuarine outlows, sewage runof (e.g. BUCCI et al., 2012) and a submarine sewage outlow (ABESSA et al., 2005), as well as adjacent coastal and continental shelf waters.
Meteorological conditions are expected to afect the TSM (total suspended matter) dynamics in Santos Bay and adjacent waters. At this region, mesoscale atmospheric circulation is modulated by the South Atlantic Subtropical High Pressure Center and its interaction with the Sub Polar Low Pressures (HARARI et al., 2008). Typically, moderate Easterly winds predominate year-round in the
study area, but the passage of cold fronts leads to stronger Southern winds. The intensity and duration of these instabilities vary throughout the year, but they tend to be more frequent and stronger during winter (HARARI et al., 2006). A study during the period of 2 years have shown that the normal monthly mean sea levels have a maximum in April - May and a secondary maximum in August - September, which are related to steric efects in summer (volume increase) and cold fronts in winter, respectively (HARARI et al., 2008). During summer, precipitation rates tend to be higher at the coast of São Paulo (CPTEC/ INPE, 1999; 2000), afecting TSM dynamics in this region (MOSER et al., 2005), as TSM is partially driven by discharge from two main estuarine channels, the São Vicente and Santos channels, to Santos Bay (see Figure 1). At timescales of hours and days, resuspension of bottom sediments may also become important during strong current tides or wind-driven currents (e.g., ALFREDINI et al., 2008). Nonetheless, the inluence of local and remote meteorological events on the distribution and resuspension of TSM remains unknown at Santos Bay.
Figure 1. Santos Bay (São Paulo State, Brazil) and the oceanographic stations occupied during the study. The IS (inner portion, crosses) and OS (outer portion, circles) stations were separated according to the 10m isobaths. The oceanographic stations were repeated in all sampling campaigns (details in the text).
CBERS’s CCD (Charge Coupled Device) sensors have ive spectral bands, with spatial resolution of 20 m and overpasses every 26 days.
Due to the importance of remote sensing techniques for the management of coastal waters, the goal of the present work was to characterize patterns of TSM distribution in Santos Bay in relation to tides, precipitation and wind-driven currents. We also investigated the feasibility of remotely sensed estimates of TSM from the CBERS satellite to reproduce patterns observed in situ. Rather than a ground truth validation, due to the lack of simultaneous in situ and satellite data, our approach was to compute a TSM index for each available image, based on published algorithms, in order to detect robust spatial patterns of TSM.
MATERIAL AND METHODS
In situ
data
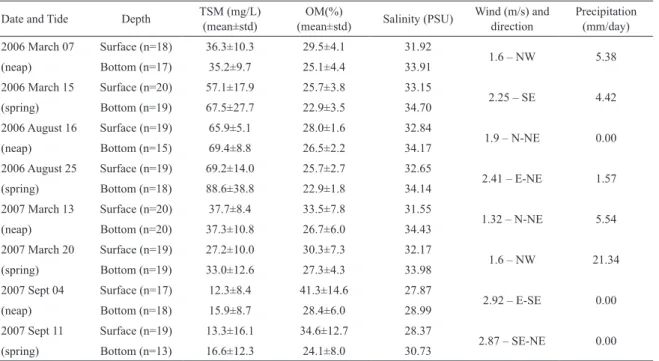
Table 1. In situ data of TSM (Total suspended matter), OM (Organic Matter), Salinity, Wind velocity and direction (four days average, including sample day) and precipitation (six days average) in Santos Bay.
Date and Tide Depth TSM (mg/L) (mean±std)
OM(%)
(mean±std) Salinity (PSU)
Wind (m/s) and direction
Precipitation (mm/day)
2006 March 07 Surface (n=18) 36.3±10.3 29.5±4.1 31.92
1.6 – NW 5.38
(neap) Bottom (n=17) 35.2±9.7 25.1±4.4 33.91
2006 March 15 Surface (n=20) 57.1±17.9 25.7±3.8 33.15
2.25 – SE 4.42
(spring) Bottom (n=19) 67.5±27.7 22.9±3.5 34.70
2006 August 16 Surface (n=19) 65.9±5.1 28.0±1.6 32.84
1.9 – N-NE 0.00
(neap) Bottom (n=15) 69.4±8.8 26.5±2.2 34.17
2006 August 25 Surface (n=19) 69.2±14.0 25.7±2.7 32.65
2.41 – E-NE 1.57
(spring) Bottom (n=18) 88.6±38.8 22.9±1.8 34.14
2007 March 13 Surface (n=20) 37.7±8.4 33.5±7.8 31.55
1.32 – N-NE 5.54
(neap) Bottom (n=20) 37.3±10.8 26.7±6.0 34.43
2007 March 20 Surface (n=19) 27.2±10.0 30.3±7.3 32.17
1.6 – NW 21.34
(spring) Bottom (n=19) 33.0±12.6 27.3±4.3 33.98
2007 Sept 04 Surface (n=17) 12.3±8.4 41.3±14.6 27.87
2.92 – E-SE 0.00
(neap) Bottom (n=18) 15.9±8.7 28.4±6.0 28.99
2007 Sept 11 Surface (n=19) 13.3±16.1 34.6±12.7 28.37
2.87 – SE-NE 0.00
(spring) Bottom (n=13) 16.6±12.3 24.1±8.0 30.73
laboratory using an Autosal salinometer (BECKMAN model RS10) and CTD casts were performed at the OS stations.
A total of 290 samples were analyzed by gravimetric methods to measure TSM concentration (APHA 1985). Between 100 and 500 ml of water were iltered through numbered GF/F ilters, previously dried at 60°C overnight and weighted. Filtrations were performed immediately after sampling, using a vacuum system and low pressure. In the laboratory, samples were dried at 60°C for 24 h, and then weighed using an analytical scale (0.001g precision); this procedure was repeated at least three times. The organic contents of each ilter were combusted during 6 hours, at 500°C, and the ilters were re-weighed at least three times. Among repeated weightings, the ilters were stored in tightly closed containers with silica gel pellets, and reported values are means. TSM was computed as the diference between the weight of dried material and the initial weight for the unused ilter, while the percentage of organic matter (%OM) was computed from the ratio between the combusted and the dried weight. Several clean ilters were also processed to detect possible contamination.
Relationships between TSM and %OM variations and environmental and meteorological conditions were derived for sixteen groups of both surface and near-bottom
data (i.e., 8 sampling dates and two sampling depths). A three-way ANOVA was performed to verify the diferences of TSM and %OM distribution between the factors: sampling date, tidal condition during sampling date (neap and spring) and sampling depth (surface and near bottom). The homogeneity of variances was tested with the Bartlett method and Tukey’s test was used a posteriori to verify the signiicance of the diferences and interactions found between factors, with a conidence limit of 95%.
Meteorological data and modeled currents
and 46°18’09.6”W). This rain gauge station provides daily average rainfall data, and to relate the rainfall with in situ variables, data from 5 days were averaged (4 days preceding the campaigns plus the sampling day).
Current speed and direction were estimated by the hydrodynamic numerical model developed by HARARI et al. (2006), using the meteorological data from NCEP/ NCAR as input, and also the mean sea level oscillations derived from observations at a local tidal station (Torre Grande; 23o56.95’S 46o18.50’W). Local tidal records
(2005 and 2006) were used to compute mean sea levels using a low-pass ilter based on running means (GODIN, 1972). Sea level harmonic decomposition (FRANCO, 1988) yielded components M2 and S2 with ranges of 0.37 m and 0.24 m, respectively. The hydrodynamic model computed hourly currents speed and direction (E-W and N-S components) for 2006 and 2007, for a grid inside Santos Bay. Modeled currents and measured TSM were compared with the smallest time lag for each station.
Satellite image acquisition, processing and
quality control
A total of 14 images from the CBERS-2 CCD sensor, containing the entire Santos estuarine complex and the adjacent inner continental shelf, were acquired at http://www. dgi.inpe.br/CDSR/. The initial quality control consisted of inspections for cloud coverage, geographical displacement ofset or acquisition failures among diferent spectral bands, which eliminated seven images. Geographical and atmospheric corrections, using the Simulation of the Satellite Signal at Solar Spectrum atmospheric correction code (5S, see TANRÉ et al., 1990), via SCORADIS were performed to convert digital numbers to physical units of Bidirectional Relectance Factors (BRF). These corrections eliminated 5 additional images, thus only the remaining 2 images could be fully processed (see steps at Figure 2). All steps were performed with Spring 4.3.3 software and packages, freely available at http://www.dpi.inpe.br/spring.
Spatial variability of surface TSM from remote
sensing data
Initially, we estimated surface TSM concentration through the model proposed by DEKKER et al. (2001). This algorithm (Equation 1) was developed for a coastal environment with similar characteristics to the study area, regarding TSM concentrations and sources, and is an exponential function of the average between bands 2
and 3 (x, red BRFs) of the TM-sensor (Landsat satellite), following:
TSM = 0.7581 e 61.683x (1)
Although Equation 1 provided realistic results (see below), we chose to study the spatial heterogeneity of TSM at Santos Bay on maps of the natural logarithm value of the average between bands 2 (0.52-0.59µm) and 3 (0.63-0.69µm) from CBERS (hereafter denominated TSM index) in order to keep the fundamentals proposed by DEKKER et al. (2001), without relying on their regional coeicients. TSM indexes were computed with LEGAL, a program language available at the Spring software, and the resulting images were then segmented and classiied using a non-supervised classiication, obtained through the algorithm called as Isoseg, that uses the Mahalanobis distance to identify regions of similarity (SANTOS et al., 2010). Segmentation yielded regions with continuous pixels showing spectral uniformity. In other words, distinct regions of the estuarine complex and Santos Bay were thus classiied according with their similar TSM index values, which varied with the surface relectance in the bands 2 and 3 of the CBERS-2 CCD sensor. It is important to note that the classiication step is used for spatial comparisons in a particular image and not among distinct images.
RESULTS
In situ
data
Average values of total suspended matter (TSM) were higher near the bottom, while the percentage of organic matter (%OM) showed an inverse trend, probably due to the combination of inorganic matter resuspension and surface inputs of organic estuarine material (Table 1). Contrary to previous observations (MOSER et al., 2005; SCHMIEGELOW et al., 2008), we found no clear relationship between %OM and 5-day averages local precipitation.
Figure 2. Diagram of the main procedures used during the quality control and images processing from CBERS satellite. The number of images analyzed in each processing steps are in brackets. The arrows indicate the software used in the processing stages.
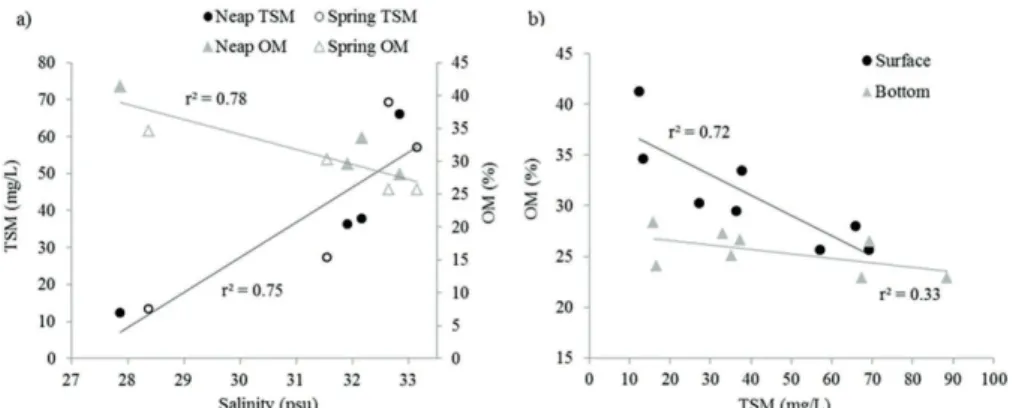
Figure 3. a. Linear regressions between the surface salinity and the percentage of organic matter (%OM) and total suspended matter concentration (TSM) (N=8). b. Linear regression between %OM and TSM for both depth layers.
Table 2. Three-way ANOVA for diferences in TSM concentration and the %OM regarding three ixed factors: sampling
date, tides and depth layer.
Efect TSM OM
F p F p
Date 208.6 < 0.0001 14.52 < 0.0001
Tide 17.5 < 0.0001 16.42 < 0.0001
Depth 7.8 0.006 50.27 < 0.0001
Date*Tide 20.7 < 0.0001 1.15 0.329
Date*Depth 0.4 0.754 6.69 < 0.0001
Tide*Depth 3.8 0.053 1.12 0.291
Date*Tide*Depth 0.6 0.637 0.49 0.693
*values in bold indicate signiicance to α=0.95. F is the critical value of statistic and p is the error probability.
higher mean values at the surface than near-bottom, although only signiicantly in September 2007. An inverse relationship between the mean %OM and the TSM concentration at the surface was also observed (Figure 3b; r² = 0.72).
Salinity ranged from 27.8 to 34.7 (Table 1), with the lowest values observed during September 2007, suggesting a high continental runof, although no precipitation was registered for the period. Diferences between near-bottom and surface salinity values (hereafter called ΔSal) were
likely driven by tides and the continental runof. Higher ΔSal values were found at the shallow stations during the neap tide campaigns of March 2006 and 2007, following high rainfall events. During spring tides, ΔSal was lower due to intensiication of local currents and vertical mixing.
Modeled meteorological and physical data
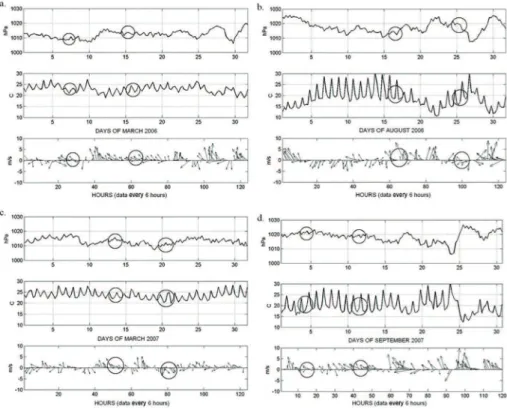
trends, from 17.4°C (± 3.8) in July to 22.6°C (± 1.9) in February (Figure 4). In March 2006, neap and spring tide cruises followed distinct degrees of atmospheric instabilities: previously to the spring tide campaign, atmospheric instability was observed on days 11 to 13 (Figure 4a), resulting in stronger and longstanding winds from the southern quadrant. In August 2006, both surveys also had contrasting atmospheric conditions, with rising air temperatures and Northern winds at neap tide sampling, while the spring tide campaign occurred after the passage of a cold front, with lower temperatures and intense Southern winds (Figure 4b). In March 2007, a number of weak frontal systems afected the study area (Figure 4c), generating low intensity Southern winds, while in September 2007, both sampling cruises occurred after stable conditions (Figure 4d).
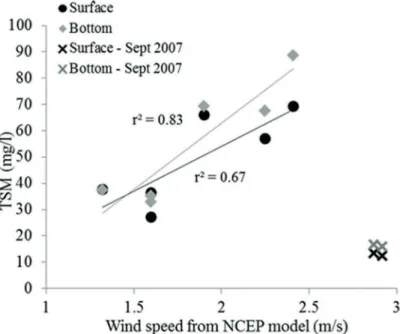
The magnitudes of wind velocities were compared to the mean TSM concentrations. When data from September 2007 are excluded, mean TSM showed a clear and direct relationship with the wind speed data, which were averaged over the NCEP model outputs for four days preceding the sampling campaigns, plus the sampling day (Figure 5). Indeed, the dataset from both campaigns
in September 2007 were unique: TSM concentrations, as well as the salinity values were noticeable low, while the %OM was high. Low salinity waters in the Santos Bay can occur during high estuarine discharges, but the relationships between salinity and the precipitation rates, both estimated by the NCEP model or observed at the local weather station, were negligible. The unexpected results from September 2007 do not seem to be related to the precipitation rates within the ive-day interval considered in our analyses. Nonetheless, an intense estuarine contribution is unquestionable, that could be a result of persistent Eastern winds or a response from heavy rainfall rates registered in August, either locally or from surrounding areas (e.g. São Paulo city) that is drained to the estuarine complex.
Sea level and tidal records for 2005 and 2006 used as boundary conditions on the hydrodynamic model, showed mean sea levels varying from 0.49 m to 0.61 m. Model estimates of tidal currents, at the central point of Santos Bay, resulted in mean values of 0.07±0.04 m/s along the water column, with relatively small and typical estuarine residual currents: towards the open sea at surface and towards the continent close to the bottom.
Figure 5. Linear regression between the modeled wind speed and the surface and near bottom averages of TSM concentrations (N=8). Data from September 2007 are neglected.
TSM concentration was related to the North-South components of the surface currents (Figure 6), with no signiicant relationship with the East-West component. Note that data from September 2007 were excluded from these regressions, and were performed separately for inner and outer sectors (IS and OS stations) to emphasize the role of bathymetry and the possible inluence of sediment resuspension. Indeed, the shallower stations (IS) showed a stronger correlation between TSM and N-S wind velocities.
TSM satellite images
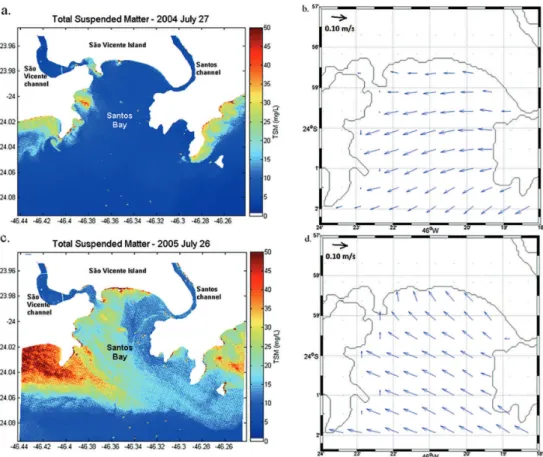
The processed images are from winter periods, 07/27/04 and 07/26/05 and the overpass time was around 10:00am. The 2004 and 2005 images are from neap and spring tides, respectively. Inside Santos Bay, mean red BRF (Bidirectional Relectance Factors) varied between 3.3 and 5.7% (07/27/04 image), and between 4.1 and 6.3% (07/26/05 image), which yielded TSM concentrations from 5.91 to 36.3 mg/L, according to equation 1 (Figures 7a and 7c). The TSM in situ estimates had the same order of magnitude.
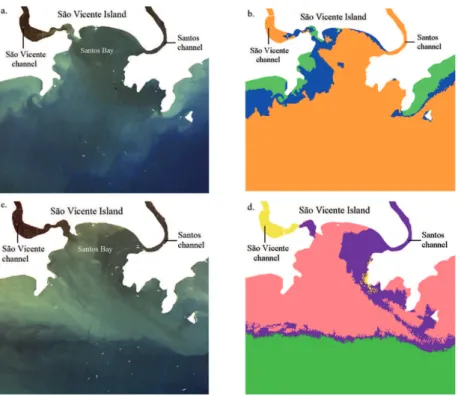
The non-supervised classiication showed a high degree of heterogeneity for TSM indices within Santos Bay. In the 2004 image, three diferent classes were distinguished, while four groups were observed in the 2005 image
(Figures 8b and 8d, respectively). True color composites are also presented to complement and aid the interpretation of the diferent classes obtained.
For the 2004 image, high TSM indexes were observed for shallow waters, probably driven by sediment resuspension, generating the irst group (Table 4 and Figure 8b). The second group, including the northern edge of São Vicente estuary and the center of the bay, above the main submarine sewage outlet, showed intermediate TSM indexes. The third and larger group presented lower TSM index and included the main portion of the bay, adjacent coastal waters and the estuarine channels.
Distinct TSM distribution was observed in the 2005 image, where larger areas with high TSM indexes were observed extending to deeper portions of the bay, consistent with a more intense vertical mixing, that will be further discussed. A sharp contrast between the central portion of the bay and the adjacent coastal water with lower TSM indexes was also observed, suggesting the presence of a frontal zone. TSM indexes in this frontal region were similar to those found in the estuarine plumes. The last group was located in the São Vicente estuarine channel. This image was acquired during spring tide, with intense S-SW winds preceding the CBERS’s overpass (Table 3).
Figure 6. Linear regression between surface TSM averages and the North-South surface current velocity. September 2007 data are excluded of the linear trends, as in igure 05. IS and OS refer to Inner and Outer portion of the bay, respectively.
Figure 8. True color (BGR) composites for July 27 2004 (a) and July 26 2005 (c) CBERS satellite images. Non-supervised classiication of the TSM index was applied for the same images (b, d). Colors are arbitrary and represent the groups from Table 4 (images must be individually analyzed, considering that the colors are not comparable). For July 27 2004: green, blue and orange – groups 1, 2 and 3, respectively. For July 26 2005: pink, green, purple and yellow – groups 4, 5, 6 and 7, respectively.
Table 3. Wind velocity and direction four days before the images acquisition.
Date Velocity (m/s) Direction
07/24/04 2.35 SE
07/25/04 2.44 SE
07/26/04 1.84 E
07/27/04 (overpass) 2.36 E
07/23/05 1.59 N-NE
07/24/05 2.14 N-NE
07/25/05 1.93 W-S
07/26/05 (overpass) 2.46 SE
(Table 4). Major current and wind components were in the E-W quadrant (Figure 7b and Table 3, respectively), favoring Santos estuary outlow and localized resuspension over the western margin of the bay. Although wind and current magnitudes were similar to those of the previous year, the 2005 image was acquired during spring tide, and both the NW-lowing current and wind from S-SE origin were the most signiicant (Figure 7d and Table 3, respectively), suggesting intense vertical mixing.
DISCUSSION
Dynamics of TSM in Santos Bay and its
adjacent estuarine complex
Water quality management in coastal waters can beneit from synoptic descriptions of spatial distributions of suspended and dissolved matter. In aquatic environments with complex circulation and various sources of materials, remote sensing techniques become an essential tool for monitoring programs (e.g. FISCHER; DOERFFER, 1987; DOERFFER et al., 1989). Our results showed that the in situ distribution of total suspended matter (TSM) at Santos Bay varied consistently with winds, currents and tidal cycles. Additionally, our analyses showed that the main features and dynamic patterns observed in situ were reproduced in two CBERS satellite images, after the application of simple and standard processing procedures.
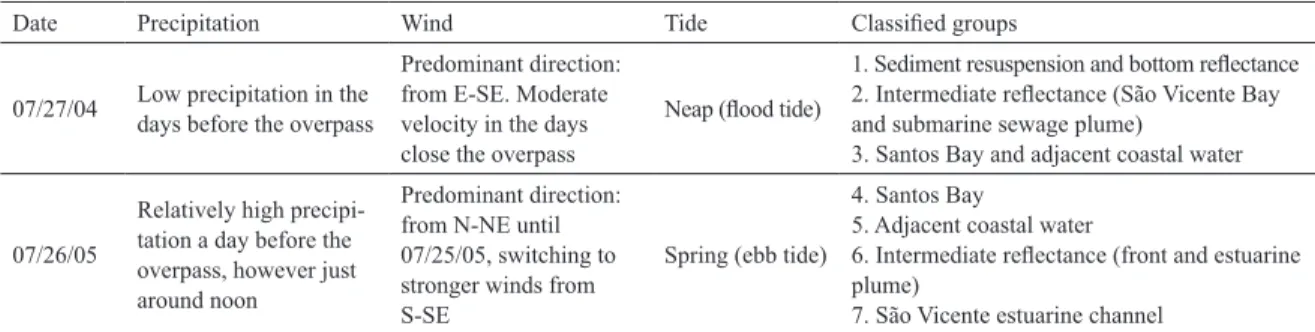
Table 4. Classiied groups and the environmental conditions close to the overpass.
Date Precipitation Wind Tide Classiied groups
07/27/04 Low precipitation in the days before the overpass
Predominant direction: from E-SE. Moderate velocity in the days close the overpass
Neap (lood tide)
1. Sediment resuspension and bottom relectance 2. Intermediate relectance (São Vicente Bay and submarine sewage plume)
3. Santos Bay and adjacent coastal water
07/26/05
Relatively high precipi-tation a day before the overpass, however just around noon
Predominant direction: from N-NE until 07/25/05, switching to stronger winds from S-SE
Spring (ebb tide)
4. Santos Bay
5. Adjacent coastal water
6. Intermediate relectance (front and estuarine plume)
7. São Vicente estuarine channel
resuspend bottom sediments (MOSER et al., 2005) and additionally, since 2002, the Santos estuarine channel has been continuously dredged to allow commercial ship access to the port of Santos, which also promotes resuspension. On some occasions, the inluence of the submarine sewage outlow at the central portion of the bay was evident as higher TSM and %OM values.
The statistical analyses have shown that local tidal dynamics played a great role in the TSM and %OM distribution in Santos Bay. During spring tides, enhanced water column turbulence likely caused resuspension of bottom sediments rich in inorganic compounds, while during more stable conditions at neap tides, TSM concentration decreased and %OM increased. Hence, the very low TSM values registered in September 2007 could also result from a process that avoids bottom sediment resuspension reaching the surface, such as a likely decrease in wave height, or the presence of a strong, persistent and deep halocline.
Wind dynamics are a major factor afecting the physical structure and lushing characteristics of estuaries (GEYER, 1997). Wind direction and velocity inluences both the extension of estuarine plumes and their constituent loads, including TSM (SIEGEL et al., 1999). Ofshore winds can spread estuarine plumes (DURAND et al., 2002), and the combination of wind, river low and tides will control plume dynamics. In Santos Bay, we found strong relationships between wind speed and TSM distribution, with rainfall apparently playing a secondary role. The efects of waves can be another important factor determining TSM concentration in shallow areas (PULS et al., 1994) and as Santos Bay is oriented southward (Figure 1), the importance of wave action during southern winds becomes important, however, no information about wave ields is available for the studied period. Especially during winter, the frequency and intensity of cold frontal systems signiicantly increases wave activity
inside the bay (e.g. CASSIANO et al., 2012); thus, TSM concentration in Santos Bay can also be related to remote wind ields. Further in situ observations and modeling exercises focusing on the relative importance of waves to TSM transport are still necessary.
In general, in situ TSM concentrations were strongly related to the wind ields only when data from September 2007 were excluded. In these cases, salinity and TSM concentrations in Santos Bay waters were not only the lowest of all campaigns, but were also lower than previously published values. Both the mesoscale model estimates and the local in situ results of precipitation rates were low or absent and thus unable to explain the observed decrease in salinity. One possible explanation for this salinity anomaly is an increase in freshwater contributions from the Henry Borden hydroelectric power plant, located in the city of Cubatão, 14 km uphill from Santos. The power plant captures water from reservoirs in the area of São Paulo city, and deposits it in the Santos estuary (GASPARRO et al., 2008). Since a high precipitation event was registered in the city of São Paulo two days before the neap tide sampling (CPTEC/INPE 2007), outlows from the power plant to the estuary could explain the anomalous data. Unfortunately, no oicial discharge data from Henry Borden were available for this period; however, the importance of the Henry Border plant in the study area is discussed in BUCCI et al. (2012). Regardless the source of freshwater, our results showed a signiicant estuarine contribution in both September 2007 campaigns. Chlorophyll concentrations were low during these periods (MOSER et al., 2012), which also corroborate the increase in the lushing volume.
how the TSM distribution patterns in the Mediterranean varied according to wind-driven currents. Also, the combination of satellite images and numerical models during a period of dredging in a port in Finland indicated that TSM patterns depend not only on the dredging itself, but also on wind-driven currents (SIPELGAS et al., 2006). In addition, TSM concentration in Santos Bay seems to vary with wind direction as well: winds from southern quadrant tend to increase overall turbulence and sediment resuspension to the water column, while winds form E-N quadrant tend to increase estuarine contributions and decrease TSM concentrations.
The use of CBERS satellite data to remotely
assess the TSM dynamics
Data validation and spatiotemporal resolution are major obstacles for satellite-derived data in coastal waters. Often, the spatial resolution of remotely-sensed data is too low to describe important horizontal gradients of TSM in coastal areas and the temporal resolution is not high enough to follow short-time scale variability driven by tides, waves and atmospheric instabilities (NITTROUER; WRIGHT, 1994). AVHRR (Advanced Very High Resolution Radiometer), Landsat TM (Thematic Mapper), SeaWiFS (Sea-viewing Wide Field-of-view Sensor) and MODIS have all been used to map suspended sediment distribution in diferent environments. Both AVHRR and SeaWiFS have almost daily global coverage but their spatial resolution is low (1.1 km). Landsat has a 30m spatial resolution but low temporal scale (16 days cycle). MODIS sensors ofer high acquisition frequency (almost daily) and better spatial resolution (250m to bands 1-2 and 500m to bands 3-7, respectively) and are therefore more suitable for monitoring smaller water bodies such as bays and estuaries (MILLER; MCKEE, 2004; MILLER et al., 2005). However, Santos Bay requires iner spatial scale data due to its reduced size. This data is available in Landsat and CBERS images and in a number of other sensors such as Quickbird, IKONOS and SPOT. In our work, CBERS data was used for convenience, and also to illustrate its potential to generate TSM products. Our results, however, are relevant for all sensors mentioned above.
The algorithm proposed by DEKKER et al. (2001), used to estimate TSM surface concentration from water leaving relectance at red wavebands, is a semi-analytical formulation easily applicable for a number of available sensors. It is also based on well-known physical and optical
theories. Simpler approaches are also possible, such as the one from MILLER and MCKEE (2004), also using red spectral bands (620-670 nm from MODIS/Aqua), which proposed empirical TSM algorithms for the Gulf of Mexico. The authors assumed that an increase in TSM concentration linearly increases water-leaving relectance in the red band, an approach also used by SIPELGAS et al. (2006) for TSM determination in the Gulf of Finland. At Santos Bay, averaged TSM values estimated from DEKKER’s algorithm were slightly lower than the in situ dataset presented here. This result is somewhat expected, once our maximum TSM concentrations were beyond the range used in their algorithm formulation (igure 7 in DEKKER et al., 2001). Nonetheless, estimated TSM values were within the same order of magnitude of our in situ data set, thus the development of regional algorithms using similar principles would be highly encouraged.
The classiication process applied to the CBERS images showed a heterogeneity for our TSM indexes. The groups generated within a particular image were based on values of TSM indexes, with similar regions observed at Santos Bay, in the estuarine channels and the adjacent continental shelf waters. In the 2004 image, the waters inside the bay and the adjacent coastal waters were grouped into a unique class, suggesting low turbulence conditions and higher transparency (Figure 8b); these features were corroborated by the meteorological conditions in a scale of days preceding the overpass. On the other hand, the true-color composite (Figure 8a) suggests that the water with low TSM indexes found in the center of the bay were associated with a brownish water color forming a plume from the main estuarine channel towards the bay. This is probably a result of a very high contribution of Colored Dissolved Organic Matter (CDOM), which has been previously reported in this region (BUCCI et al., 2012; FERRARI et al., 2014), and could trace the estuarine discharge. In estuarine plumes, the decrease in TSM, or CDOM, towards ofshore is not a simple process of dilution (OUBELKHEIR et al., 2006), particles size and their chemical composition will also change, leading to biogeochemical and optical changes (BUKATA, 2005; BURD; JACKSON, 2009; CHEN et al., 2005; FETTWEIS et al., 2006).
OUILLON, 1998). Two more features were observed in this image: irst, the water inlet from Santos Bay through one side of the São Vicente estuarine channel, resulting from lood tide (blue patches), which generated a strong longitudinal TSM gradient across this small bay; the second feature is the clear localized plume over the underwater sewage outlow, where a difuser launches the eluent to the surface. This plume was also detected in our in situ data, showing high TSM and %OM at surface for stations located near the outlet. Note that the sewage outlet is located near the bottom, where there is a difuser, and it is expected that the discharge varies as a function of the rainfall. For these reasons, it is not expected that a visible surface plume will be always present.
The TSM classes formed in the 2005 image were distinct from 2004 image but were consistent with meteorological and tidal conditions during this satellite overpass. Waters in the center of the bay showed distinct TSM indices from those in the adjacent coastal waters, suggesting a more turbulent pattern in the bay (Figure 8d). The overpass on 07/26/05 occurred during spring tide, when higher turbulence and sediment resuspension are expected, as observed in the in situ dataset. Strong S-SE winds were recorded before the overpass (Table 3) and could increase turbulence. Due to the orientation of the Santos Bay mouth southwards, winds from the southern quadrant raise the sea level, piling water inside the bay, promoting increasing waves. Modeled surface currents (Figure 7d), predominantly to northwest, reinforced this hypothesis. As a result, a plume in the 2005 image can be clearly detected adjacent to Santos Bay by the strong TSM index gradient. Indeed, the detection of frontal zones has been a major achievement in studies using satellite images in estuaries (e.g., FORGET; OUILLON, 1998; MILLER; MCKEE, 2004).
The combination of ebb tide at the time of the overpass of the satellite and high precipitation rates the day before suggest that the class formed by intermediate TSM indices values in the 07/26/05 image probably originated from Santos estuarine channel discharge. It is interesting to note that waters from São Vicente and Santos estuaries show distinct colors in the RBG composite, suggesting distinct optical properties. The darker waters found in São Vicente estuary indicate higher amounts of CDOM. This constituent, usually estimated by its coeicients for light absorption, will have magnitudes inversely proportional to salinity, so that CDOM absorption coeicients are sometimes used as a tracer for freshwater input (e.g.,
FERRARI; DOWELL, 1998). CDOM is an optical component important in both the Santos and São Vicente estuarine channels (FERRARI et al., 2014). However, the true color composite (Figure 8c, d) suggests that their overall CDOM exports are optically distinct. The Santos channel receives a larger amount of industrial eluents (BRAGA et al., 2000) than the São Vicente channel, which receives larger proportion of domestic waste. The dynamics of both estuaries (low, length and depth) are also diferent, which signiicantly impacts the origin and the distribution of TSM and CDOM in the entire estuarine complex.
FINAL CONSIDERATIONS
Our goal was to investigate the relationships between winds, tides and precipitation on TSM distribution and their organic matter content in Santos Bay. Statistical analyses have indicated that the surface TSM concentration seemed to be mainly driven by wind and tidal currents, probably due to resuspension of bottom sediments. The inluence of tides and winds will be more signiicant during the passage of meteorological instabilities, when southerly winds promote higher turbulence inside the bay. Ultimately, estuarine discharges and waves can also inluence the TSM dynamics due to the persistent E-W winds and currents, which can pile water inside the bay, increasing the estuarine outlows independently of the local rainfall rates. The patterns observed in situ regarding the dynamics of TSM controlled by oceanographic-meteorological conditions could be similarly reproduced through remote sensing analysis.
and the dissolved organic matter, is highly encouraged as an important step for a better description of the optically active components in the water at this important urban coastal area. The analysis and interpretation shown in the present work can be extended to other satellite sensors, with higher spatial and temporal resolution, contributing to the studies in aquatic systems management and environmental monitoring programs.
ACKNOWLEDGEMENTS
The authors thank FAPESP by funding MFCG (project number 05/60602-8) and the entire CIRSAN project (Fapesp 03/13747-5) personal, especially Dr Sonia Gianesela and Dr Flávia Saldanha Correa from IO-USP. We particularly thank Dr. Flavio Ponzoni for the important contribution with some satellite images analysis. We thank Renato de Traglia Tonini and Fabiana Pestana Barbosa for their assistance during sampling campaigns and laboratorial analyses and we appreciate the detailed comments provide by Dr. J.V. Guerra in our manuscript. This research is a contribution of the NP-BioMar, CEBIMar, University of São Paulo.
REFERENCES
ABESSA, D. M. S.; CARR, R. S.; RACHID, B. R. F.; SOUSA, E. C. P. M.; HORTELANI, M. A.; SARKIS, J. E. Inluence of a Brazilian sewage outfall on the toxicity and contamination of adjacent sediments. Mar. Pollut. Bull., v. 50, n. 8, p.
875-885, 2005.
ALFREDINI, P.; ARASAKI, E.; AMARAL, R. F. Mean sea-level rise impacts on Santos Bay, Southeastern Brazil – physical modelling study. Environ. Monit. Assess., 144, n. 1, 377-387,
2008.
APHA (AMERICAN PUBLIC HEALTH ASSOCIATION, inc.). Standard Methods for the Examination of Water and Wastewater. 16th ed. Washington: APHA, 1985.
BOWERS, D. G.; EVANS, D.; THOMAS, D. N.; ELLIS, K.; WILLIAMS, P. J. le B. Interpreting the color of an estuary.
Estuar. Coast. Shelf Sci., v. 59, n. 1, p. 13-20, 2004.
BRAGA, E. S.; BONETTI, C. V. D. H.; BURONE, L.; BONETTI FILHO, J. Eutrophication and Bacterial Pollution Caused by Industrial and Domestic Wastes at the Baixada Santista Estuarine System – Brazil. Mar. Pollut. Bull., v. 40, n. 2, p. 165-173, 2000.
BUCCI, A. F.; CIOTTI, A. M.; POLLERY, R. C. G.; CARVALHO, R.; ALBUQUERQUE, H. C.; SIMÕES, L. T. S. Temporal variability of chlorophyll-a in the São Vicente estuary. Braz. J. Oceanogr., v. 60, n. 4, p. 485-499, 2012.
BUKATA, R. P. J. H.; KONDRATYEV, K. Y.; POZDNYAKOV, D. V. Optical Properties and Remote Sensing of Inland and Coastal Waters. Boca Raton: CRC Press, 1995. 362 p.
BUKATA, R. P. Satellite monitoring of inland and coastal water quality: retrospection, introspection, future directions. Boca Raton: Taylor & Francis, 2005. 246 p.
BURD, A. B.; JACKSON, G. A. Particle Aggregation. Ann. Rev. Mar. Sci., v. 1, p. 65-90, 2009.
CASSIANO, G. F.; RIBEIRO, R. B.; YASSUDA, E. A. Acquisition of wave data and modeling in Santos Bay, São Paulo, Brazil. In: Proceedings of the 10th International
Conference on Hydroscience & Engineering. Orlando, 2012. CHEN, M. S.; WARTEL, S.; TEMMERMAN, S. Seasonal
variation of loc characteristics on tidal lats, the Scheldt estuary. Hydrobiologia, v. 540, p. 181-195, 2005.
CPTEC/INPE. Climanálise. Boletim de Monitoramento e Análise Climática, 1999, v. 14, n. 1-8. Available: <http://www.cptec.
inpe.br/products/climanalise/capa1.html>.
CPTEC/INPE. Climanálise. Boletim de Monitoramento e Análise Climática. 2000, v. 15, n. 1-8. Available: <http://www.cptec.
inpe.br/products/climanalise/capa1.html>.
CPTEC/INPE. Resumo de eventos signiicativos em setembro de
2007, 2007. Available: <http://www7.cptec.inpe.br/~rupload/
figcartas/resumo_mensal/set07/cas_sig_setembro07.pdf>. Accessed: 07 mar. 2017.
DEKKER, A. G.; VOS, R. J.; PETERS, S. W. M. Comparison of remote sensing data, model results and in situ data for total suspended matter (TSM) in the southern Frisian lakes.Sci. Total Environ., v. 268, n. 1-3, p. 197-214, 2001.
DHN – Diretoria de Hidrograia e Navegação. Port of Santos Nautical Charts (Carta Náutica do Porto de Santos). Rio de Janeiro: Marinha do Brasil, Divisão de Hidrograia e Navegação, 2003.
DOERFFER, R.; FISCHER J.; STÖSSEL, M.; BROCKMANN, C.; GRASSL, H. Analysis of thematic mapper data for studying the suspended matter distribution in the coastal area of the German Bight (North Sea). Remote Sens. Environ., v. 28, p. 61-73, 1989.
DURAND, N.; FIANDRINO, A.; FRAUNIÉ, P.; OUILLON, S.; FORGET, P.; NAUDIN, J. J. Suspended matter dispersion in the Ebro ROFI: an integrated approach. Cont. Shelf Res., v. 22, n. 2, p. 267-284, 2002.
FERRARI, G. M.; DOWELL, M. D. CDOM Absorption Characteristics with Relation to Fluorescence and Salinity in Coastal Areas of the Southern Baltic Sea. Estuar. Coast. Shelf Sci., v. 47, n. 1, p. 91-105, 1998.
FERRARI, A.; CIOTTI, A. M.; GIANNINI, M. F. C. Variability in the light absorption coeicients of phytoplankton, non-algal particles, and colored dissolved organic matter in a subtropical bay (Brazil). Estuar. Coast. Shelf Sci., v. 139, p. 127-136, 2014.
FETTWEIS, M.; FRANCKEN, F.; PISON, V.; VAN DEN EYNDE, D. Suspended particulate matter dynamics and aggregate sizes in a high turbidity area. Mar. Geol., v. 235, n.
1-4, p. 63-74, 2006.
FISCHER, J.; DOERFFER, R. An inverse technique for remote detection of suspended matter, phytoplankton and yellow substance from CZCS measurements. Adv. Space Res., v. 7,
n. 2, p. 21-26, 1987.
FRANCO, A. S. Tides - fundamentals, analysis and prediction. 2nd ed. São Paulo: FCTH, 1988. 249 p.
GASPARRO, M. R.; SOUSA, E. C. P. M.; GIORDANO, F.; ARGENTINO-SANTOS, R. C. Occupation history of the Santos estuary. In: RAMIRO NEVES, R.; BARETTA, J.; MATEUS, M. (Eds.). Perspectives on Integrated Coastal Zone Management in South America. Lisbon: IST Press, 2008. 603 p.
GEYER, W. R. Inluence of Wind on Dynamics and Flushing of Shallow Estuaries. Estuar. Coast. Shelf Sci., v. 44, n. 6, p. 713-722, 1997.
GODIN, G. (1972) The analysis of tides. Liverpool: Liverpool University Press, 246 p.
GREEN, E. P.; MUMBY, P. J.; EDWARDS, A. J.; CLARK, C. D.; EDWARDS A. J. (Ed). Remote Sensing Handbook for Tropical Coastal Management. Coastal Management Sourcebooks 3. Paris: UNESCO, 2000. 316 p.
HARARI, J.; CAMARGO, R.; FRANÇA, C. A. S.; MESQUITA, A. R.; PICARELLI, S. S. Numerical Modeling of the Hydrodynamics in the Coastal Area of Sao Paulo State Brazil.
J. Coast. Res., v. 3, n.si. 39, p. 1560-1563, 2006.
HARARI, J.; FRANÇA, C. A. S.; CAMARGO, R. Climatology and Hydrography of Santos Estuary. In: RAMIRO, N. R.; BARETTA, J.; MATEUS, M. (Eds.). Perspectives on Integrated Coastal Zone Management in South America. Lisbon: IST Press, 2008. 603 p.
INPE. CBERS – Satélite Sino-Brasileiro de Recursos Terrestres. 2011. Available: <http://www.cbers.inpe.br>. Accessed: 07 mar. 2017.
INTERNATIONAL OCEAN-COLOUR COORDINATING GROUP (IOCCG). Remote Sensing of Ocean Colour in Coastal, and Other Optically-Complex, Waters. In: SATHYENDRANATH, S. (Ed.). Reports of the International Ocean-Colour Coordinating Group, n. 3. Dartmouth: IOCCG, 2000.
KALNAY, E.; KNAMITSU, M.; KLISTER, R.; COLLINS, W.; DEAVEN, D.; GANDIN, I.; IREDELL, M.; SAHA, S.; WHITE, G.; WOOLLEN, J.; ZHU, Y.; CHELLIAH, M.; EBISUZAKI, W.; HIGGINS, W.; JANOWISK, J.; MO, K. C.; ROPELEWSKI, C.; WANG, J.; LEETMAA, A.; REYNOLDS, R.; JENNE, R.; JOSEPH, D. The ncep/ncar 40-year reanalysis project. Bull. Am. Meteorol. Soc., v. 77, n.
3, p. 437-470, 1996.
MILLER, R. L.; MCKEE, B. A. Using MODIS Terra 250 m imagery to map concentrations of total suspended matter in coastal waters. Remote Sens. Environ., v. 93, n. 1-2, p. 259-266, 2004.
MILLER, R. L.; DEL CASTILLO, C. E.; CHILMAKURI, C.; MCCORQUODALE, J. A.; GEORGIOU, I.; MCKEE, B. A.; D’SA, E. J. Using multi-temporal MODIS 250 m data to calibrate and validate a sediment transport model for environmental monitoring of coastal waters. In: Analysis of Multi-Temporal Remote Sensing Images. International Workshop on the Analysis of Multi-Temporal Remote Sensing Images, 2005. p. 200-204. Available:<http://ieeexplore. ieee.org/stamp/stamp.jsp?arnumber=1469872&isnumb er=31478>. Accessed: 07 mar. 2017.
MILLER, R. L.; LIU, C. C.; BUONASSISSI, C. J.; WU, A. M. A Multi-Sensor Approach to Examining the Distribution of Total Suspended Matter (TSM) in the Albemarle-Pamlico Estuarine System, NC, USA. Remote Sens., v. 3, n. 5,
962-974, 2011.
MOSER, G. A. O.; GIANESELLA, S. M. F.; ALBA, J. J. B.; BÉRGAMO, A. L.; SALDANHA-CORRÊA, F. M. P.; MIRANDA, L. B.; HARARI, J. Instantaneous transport of salt, nutrients, suspended matter and clorophyll-a in the tropical estuarine system of Santos. Braz. J. Oceanogr., v. 53,
n. 3/4, p. 115-127, 2005.
MOSER, G. A. O.; CIOTTI, A. M.; GIANNINI, M. F. C.; TONINI, R. T.; HARARI, J. Changes in phytoplankton composition in response to tides, wind-induced mixing conditions and freshwater outlows in an urbanized estuarine complex. Braz. J. Biol., v. 72, n. 1, p. 97-111, 2012.
NITTROUER, C. A.; WRIGHT, L. D. Transport of particles across continental shelves. Rev. Geophys., v. 32, n. 1, p.
85-113, 1994.
ONDRUSEK, M.; STENGEL, E.; KINKADE, C. S.; VOGEL, R. L.; KEEGSTRA, P.; HUNTER, C.; KIM, C. The development of a new optical total suspended matter algorithm for the Chesapeake Bay. Remote Sens. Environ., v. 119, p. 243-254,
2012.
OUBELKHEIR, K.; CLEMENTSON, L. A.; WEBSTER, I. T.; FORD, P. W.; DEKKER, A. G.; RADKE, L. C.; DANIEL, P. Using inherent optical properties to investigate biogeochemical dynamics in a tropical macrotidal coastal system. J. Geophys. Res., v. 111, n. C7, p. 1-15, 2006.
PHINN, S. R.; DEKKER, A. G.; BRANDO, V. E.; ROELFSEMA, C. M. Mapping water quality and substrate cover in optically complex coastal and reef waters: an integrated approach. Mar. Pollut. Bull., v. 51, n. 4-1, p. 459-469, 2005.
PULS, W.; DOERFFER, R.; SUNDERMANN, J. Numerical simulation and satellite observations of suspended matter in the North Sea. IEEE J. Ocean Engineer., v. 19, n. 1, p. 3-9, 1994. SANTOS, J. R.; MALDONADO, F. D.; GRAÇA, P. M. L. A.
Integração de imagens LANDSAT/ETM+ e CBERS-2/ CCD para detecção de mudanças em área da Amazônia sob domínio da loresta de transição. Rev. Bras. Cartogr., v. 57, n.
1, p. 15-21, 2005.
SANTOS, A. R.; PELUZIO, T. M. O.; SAITO, N. S. Spring 5.1.2: Passo a passo: Aplicações práticas. Alegre: CAUFES, 2010. 153 p.
SCHMIEGELOW, J. M. M.; GIANESELLA, S. M. F.; SIMONETTI, C.; SALDANHA-CORREA, F. M. P.; FEOLI, E.; SANTOS, J. A. P.; SANTOS, M. P.; RIBEIRO, R. B.; SAMPAIO, A. F. P. Primary Producers In Santos Estuarine System. In: NEVES, R.; BARETTA, J.; MATEUS, M. (Eds.).
Perspectives on Integrated Coastal Zone Management in South America. Lisbon: IST Press, 2008. 603 p.
SHI, W.; WANG, M. Satellite observations of lood-driven Mississippi River plume in the spring of 2008. Geophys. Res. Lett., v. 36, n. 7, 2009.
SIEGEL, H.; GERTH, M.; MUTZKE, A. Dynamics of the Oder river plume in the Southern Baltic Sea: satellite data and numerical modeling. Cont. Shelf Res., v. 19, n. 9, p. 1143-1159, 1999.
SIPELGAS, L.; RAUDSEPP, U.; KÕUTS, T. Operational monitoring of suspended matter distribution using MODIS images and numerical modelling. Adv. Space Res., v. 38, n.
10, p. 2182-2188, 2006.