Il Farmaco 54 (1999) 573 – 578
UVA
/
UVB sunscreen determination by second-order derivative
ultraviolet spectrophotometry
Jacqueline S. Azevedo, Nilton S. Viana Jr., Cristina D. Vianna Soares *
Departamento de Produtos Farmaceˆuticos,Faculdade de Farma´cia,Uni6ersidade Federal de Minas Gerais,A6enue Olega´rio Maciel2360,
30180-112Belo Horizonte,MG,Brazil Received 5 January 1999; accepted 14 June 1999
Abstract
UVA/UVB protective agents are important constituents in many cosmetics and sunscreen preparations. Analytical methodolo-gies which enable the determination of combined substances with different spectrophotometric characteristics are therefore useful and cost-effective. To this end, the following substances in a sunscreen gel were analyzed: the UVB and UVA protective substances, 2-hydroxy-4-methoxy-benzophenone-5-sulphonic acid (BZP) and 2-phenylbenzymidazole-5-sulphonic acid (PBS), respectively, were evaluated by second-order derivative ultraviolet spectrophotometry in distinct solvents and wavelengths. The method used for determination of BZP in 95% ethanol was the zero-peak (ZP) at 356.0 nm. For PBS, the solvent used was 0.1 mol l−1triethanolamine, and the methods were the ZP at 317.5 nm and the peak-peak (PP) at 317.5 – 323.0 nm. Statistical results for the methods showed linearity of 0.9999 and an average precision of 1.12% (ZP) for BZP, and 0.55% (ZP) and 0.63% (PP) for PBS. The average recovery for BZP and PBS were 97.28% (ZP), 103.13% (ZP) and 103.71% (PP), respectively. © 1999 Elsevier Science S.A. All rights reserved.
Keywords:UVA/UVB sunscreen; Ultraviolet spectrophotometry; Second-order derivative; Cosmetics determination
1. Introduction
Sun radiation is necessary for all living organisms, although it presents a threat to the overall health of human skin. It can cause detrimental effects not only to the external skin layer but the inner layers as well. Effects of solar ultraviolet (UV) radiation include: ery-thema, (sun burn), pigmentation (tan), carcinogenesis (skin cancer), photo aging (wrinkling, blotchy skin, telangiectasia, liver spots), modulation of immune func-tion, and photosensitivity. For this reason, the employ-ment of sunscreens in cosmetic preparations has been increasing [1].
UV radiation is divided into UVA (320 – 400 nm), UVB (280 – 320 nm) and UVC (190 – 280 nm). UVC is filtered by the atmosphere before reaching earth and,
therefore, plays a minor role in natural photochemical reactions. UVB is not completely filtered out by the ozone layer and has greater biological importance. It is UVB that is responsible for the damage incurred by sunburn. UVA reaches the deeper layers of the epider-mis and derepider-mis and comes primarily from the sun, but is also emitted from artificial lamps. In order to provide an adequate solar protection factor (SPF) it is necessary to combine agents with a wide range of UV absorption properties.
UVA rays are beneficial since they increase vitamin D3 production through the irradiation of
7-dihydro-cholesterol. They intensify the darkening of pre-formed melanin pigment favoring tanning. On the other hand, it has been demonstrated that these rays are responsible for photosensitivity which result in several types of allergic reactions and actinic lesions [2]. Therefore, cos-metics should be composed of compounds which have a selective radiation profile.
UVB radiation, however, is more dangerous than UVA, since it results in acute erythema and conse-quently early aging. Its most serious effect is skin * Corresponding author. Present address: Temple University,
School of Pharmacy, 3307 N. Broad St., Philadelphia, PA 19140, USA. Tel.: +1-215-707 7342; fax: +1-215-707 3678.
E-mail address: [email protected] (C.D. Vianna Soares)
sunburn and dermal cancer. UVA rays have recently been implicated as a causative factor in skin cancer. All of the above justify the modifications that cosmetic preparations have recently been subjected to regarding levels of UVA sunscreen substances. Because of this, cosmetics should be formulated with a combination of sunscreens, which filter both UVA as well as UVB radiation in order to afford sufficient protection [3].
Biological assays for SPF determination have been employed for many years and although useful and precise they are time-consuming, complex, expensive and increasingly socially objectionable.
Vilar et al. [2] have proposed an in vitro method which determines single sunscreen efficacy. The authors evaluated comparatively the percentage transmittance data obtained via a zero-order UV spectrophotometric method. This mono-component determination, how-ever, is not satisfactory for products formulated with a combination of sunscreens due to the overlapping of their absorption bands. In addition, the employment of a zero-order UV spectrophotometric method is of little value in the quantitative analysis of cosmetic formula-tions. They contain excipients and other active ingredi-ents, which can also produce UV absorption bands and interfere with those of UVA and UVB sunscreen pro-tectives. For this reason, analytical determination of combination products has always been a problem for quality control in pharmaceutical and cosmetic industries.
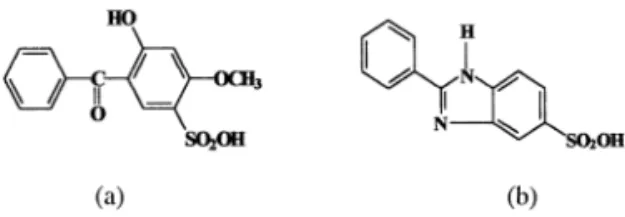
The UVA sunscreen, 2-hydroxy-4-methoxybenzophe-none-5-sulphonic acid (BZP) and the UVB sunscreen, 2-phenylbenzymidazole-5-sulphonic acid (PBS) are shown in Fig. 1(a) and (b), respectively. These particu-lar agents were selected for the present study by second-order derivative UV spectrophotometric method [4 – 7] for the following reasons. First, they are typically found in combination in gel cosmetic preparations and sec-ond, they exhibit an overlapping interference in the zero-order UV spectrophotometry.
2. Experimental
2.1. Reagents and materials
Chemical reference standards were of pharmaceutical grade and reagents were of analytical grade. All sub-stances were employed without subsequent purification.
Solvent reagents used were 0.1 mol l−1
tri-ethanolamine and ethanol 95%, all supplied by E. Merck S.A., Industrias Quimicas, Rio de Janeiro, RJ, Brazil.
BZP was supplied by Rhone-Poulenc Rorer Pharma-ceuticals, Inc., Cranbury, NJ, USA and PBS was pur-chased from Haarman and Reimer GmbH, Holzminden, Germany.
The label for the sunscreen gel sample employed claimed 1% w/w BZP and 3% w/w PBS. The label for the control sample claimed all excipients only, but neither BZP nor PBS. Both sunscreen gel and control samples were provided by the cosmetic manufacturer, FANAPE — Fabrica Nacional de Perfumes, Belo Horizonte, MG, Brazil, a local cosmetic company that is well-known nationally.
2.2. Apparatus
A Shimadzu 160-A double-beam UV – Vis spec-trophotometer equipped with 1-cm quartz cuvettes and built-in derivative software was used. Derivative scan speed range was 480 – 3600 nm min−1with a constant 2
nm slit width. The wavelength interval and the ordinate scale employed are indicated on each spectrum figure. A Sartorius analytical balance 2842 model, with 0.05 mg accuracy was employed.
3. Method
3.1. Quantification
To develop the derivative UV spectrophotometric method, the chemical reference standard spectra were obtained following the establishment of the following parameters: choice of the solvent, peak amplitude max-ima absorption, linear concentration range, differential wavelength, scan speed, and ordinate scale ranges.
3.2. Preparation of calibration graphs
A stock solution was prepared by accurately weigh-ing 75.0 mg BZF and transferrweigh-ing to a 100.0 ml cali-brated flask. Solubilization was proceeded and volume completed with ethanol 95%. An aliquot of 10.0 ml was diluted to 200.0 ml in a calibrated flask and completed to volume with ethanol 95%. Appropriate aliquots of the diluted standard solution were transferred to a 25.0 ml calibrated flask to yield the linear concentration range of 4.5 – 19.5 mg ml−1. A concentration increment
of 1.5mg ml−1 for BZP was fixed. The zero-peak (ZP)
method at 356.0 nm in the wavelength interval of 300.0 – 400.0 nm, and ordinate scale of 90.10 ab-sorbance nm−2 were utilized.
Accurately weighed 70.0 mg PBS were solubilized in 0.1 mol l−1triethanolamine and diluted to volume in a
100.0 ml calibrated flask, to yield a stock solution. Standard diluted solution I was prepared drawing 25.0 ml of the previous concentrated solution to a 100.0 ml calibrated flask. Thereafter, standard solution II was prepared by withdrawing a 20.0 ml aliquot of standard solution I and transferring it to a 200.0 ml calibrated flask. Adequate aliquots of standard solution II were transferred to a 25.0 ml calibrated flask to yield the linear concentration range of 0.7 – 7.0 mg ml−1 and
fixed interval of 0.7 mg ml−1. All PBS standard
solu-tions were diluted to volume with 0.1 mol l−1
triethanolamine.
Amplitude measurements at 317.0 nm and at 317.0 – 323.0 nm were taken for ZP and peak-peak (PP) meth-ods, respectively. The wavelength interval of 200.0 – 400.0 nm and ordinate scale of 90.60 ab-sorbance nm−2 were defined. Differential wavelength,
4.2 nm and scan speed, 480 nm were utilized for both sunscreen determinations. Calibration curves for sec-ond-order derivative UV spectrophotometry (D2) [8,9]
were achieved using 11 duplicate standard determina-tions for both sunscreeens.
3.3. Preparation of sample solutions
An accurately weighed amount (750.0 mg) of the sunscreen gel sample was transferred to a 200.0 ml calibrated flask and the volume was completed with ethanol 95%. From this solution, aliquots of 7.0 ml were diluted into a 25.0 ml calibrated flask and the volume was completed with the same solvent. The solutions containing BZF at an analytical concentration of 10.5 mg ml−1 were scanned in the range of 300.0 –
400.0 nm and measured at 356.0 nm, using the ZP method.
In the preparation of the sunscreen sample contain-ing PBS, an accurately weighed amount (150.0 mg) of the gel was transferred to a 200.0 ml calibrated flask and diluted to volume with 0.1 mol l−1
triethanol amine. Aliquots of 5.0 ml were transferred to a 25.0 ml calibrated flask and completed to volume with the same solvent, yielding a nominal concentration for analysis of 4.5 mg ml−1. Measurements of the peak amplitude
were done at 317.5 nm using the ZP method and at 317.5 – 323.0 nm using the PP method.
The precision of the methods in the described condi-tions was evaluated through the intra-day and inter-day coefficients of variation. The former, represented by the repeatability test and the latter, by the reproducibility test of determinations on 3 different days. These tests were performed with ten determinations of a duplicate sample of sunscreen gel in the obtained optimal concen-trations of 10.5mg ml−1for BZP, and 4.5mg ml−1for
PBS.
The accuracy of the method was determined through the standards addition method according to the United States Pharmacopoeia [10]. The addition of standard diluted BZP or PBS solutions to control diluted solu-tions was evaluated in duplicate.
4. Results and discussion
In attempting to achieve feasibility in this study, our purpose was to use only one solvent for both suns-creens determinations. However, solubility as a major concern, was a problem in the tentative unifying of the solvents for UV measurements. The first solvent tested, ethanol 95%, was selected upon work previously re-ported by Shaath in 1989 [11]. Nonetheless, only BZF yielded good solubility in ethanol 95%, while PBS was slightly soluble. Other solvents were thus investigated to solubilize larger amounts of PBS. Triethanolamine was found to solubilize both substances, however, the verifi-cation of a bathochromic effect regarding BZP solubi-lization was the main reason for eliminating this solvent from the determination of the particular sunscreen. The yellowish solution derived led to wavelength displace-ment to a higher UV spectrum region. On the other hand, the PBS spectrum was not influenced by such behavior, therefore, triethanolamine was selected for PBS determinations only.
The UV spectrum of small quantities of BZP in ethanol 95% depicted absorption maxima at 205.0, 225.0, 242.0, 286.0, and 324.0 nm. PBS UV spectrum in ethanol 95% showed absorption bands at 207.0, 242.5 and 306.0 nm. These values compared favorably with previously reported data [6].
Calibration curves ranges established for BZP, from 4.5 to 19.5 mg ml−1, and for PBS, from 0.7 to 7.7 mg
ml−1, were verified to yield the lower photometric
errors through Ringbom curves [12,13]. The BZP zero-order UV absorption maxima are shown in Fig. 2(a) spectrum, curve 1. The maximum absorption at wave-length 286.0 nm was chosen for BZP evaluation instead of that highest band at 205.0 nm. This selection was envisioned due to its location in the upper region of UV spectrum thus resulting in less general background in-terferences. The maximum absorption selected for PBS at 303.0 nm did correspond to its summit in the zero-order UV absorption.
Statistical evaluation of the standard second-order UV absorbance readings resulted in satisfactory preci-sion (sr) below 2% and linearity near unity, as
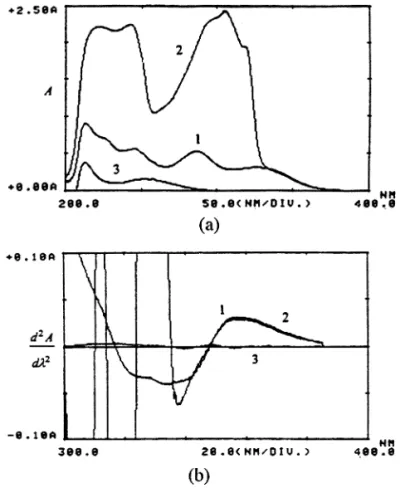
Fig. 2. Superimposed spectra in zero-order (a) at the wavelength range 200.0 – 400.0 nm and, in second-order (b) at the wavelength range 300.0 – 400.0 nm of 10.5mg ml−1BZP standard solution (1), sunscreen gel solution containing 10.5mg ml−1BZP (2) and control sample solution (3) in equivalent dilution. Solvent used was ethanol 95%.
Following standardization of the second-order UV derivative method, the sunscreens were assayed in a gel pharmaceutical dosage form. Measurements of peak amplitudes from baseline to peak at 356.0 (ZP) for BZP in ethanol 95%, and from baseline to peak at 317.5 nm (ZP) and peak to peak at 317.5 – 323.0 nm (PP) for PBS, in 0.1 mol l−1 triethanolamine, were carried out.
Fig. 2 represents the spectra scanned for BZP deter-mination. The 200.0 – 400.0 nm range zero-order spectra (a) shows the absorption curves of the standard BZP (1), and the sunscreen gel sample (2) solutions, both prepared to contain 10.5 mg ml−1 in ethanol 95%. The
control sample solution (3), which contains no BZP, was prepared in the same manner, i.e. in equivalent dilution. It is clear from these overlaid spectra that the large absorption increment in the sunscreen gel sample is mostly due to PBS interference and also, to a lesser extent, due to the formulation excipients. For this principal reason the zero-order UV method is not suit-able for BZP determination. After spectra differentia-tion through second-order derivative (b), the background interferences [16] mainly from PBS were still not eliminated in the region between 200.0 and 340.0 nm. However, these interferences appear to be readily eliminated in the wavelength interval of 350.0 – 400.0 nm. Hence, this region was considered for suit-able clear measurements of BZP alone in the presence of PBS and excipients. Such observations can be promptly verified in Fig. 2(b) through the coincident spectra of chemical reference substance (1) and sun-screen gel sample (2) in the region of 300.0 – 350.0 nm. The control sample curve, desirably, does not show any interference at all in this same region, as demonstrated by the flat baseline curve after differentiation. The differentiated spectra, therefore, permitted quantitative determination of BZP in the absorption maximum at 356.0 nm.
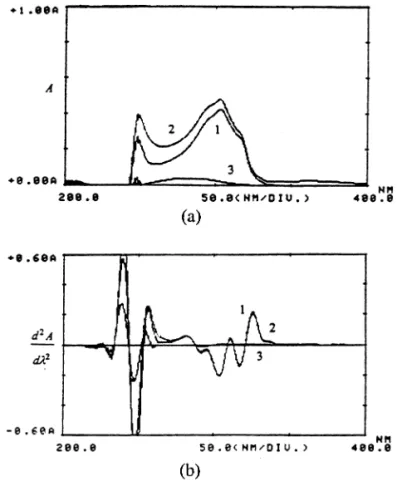
Fig. 3 spectra were scanned to determine PBS sun-screen in the combined gel sunsun-screen sample. It shows the zero-order (a) and the second-order spectra (b) in the wavelength range of 200.0 – 400.0 nm. They account for the absorptions of PBS chemical reference substance (1), sunscreen gel sample (2), both containing 4.5 mg
ml−1 in 0.1 mol l−1 triethanolamine as well as for the
control sample (3), prepared in an exactly equivalent dilution.
Similarly to BZP determination in sunscreen gel sam-ple, standard PBS absorption (1) in zero-order spectra (a) is also affected by the gel sunscreen sample interfer-ences. The presence of BZP as well as the presence of the excipients, although to a far lesser extent, still biases PBS analysis.
Examining the second-order differentiated spectra (b), it is difficult to distinguish between the superim-posed absorption curves of PBS chemical reference substance (1), and sunscreen gel sample (2) in the The analysis did not show any statistically significant
difference between the ZP and PP precision methods for PBS determination. Nevertheless, the employment of the ZP method, represents a faster, simpler and more feasible method for routine quality control analysis of sunscreens, while the PP method requires the summa-tion of two amplitude readings.
Table 1
Statistical resultsafor BZP and PBS second derivative UV spectro-photometric calibration graphsb
Parameter BZP PBS
PP ZP
ZP Method
0.04191
b 0.00280 0.02282
−0.00042
a −0.00025 0.00080
r 0.9999 0.9999 0.9999
1.12 0.55
sr (%) 0.63
1.109
t 1.376 0.745
0.04206 0.00277
b% 0.02278
aAverage of two determinations.
Fig. 3. Superimposed spectra in zero- (a) and second- (b) orders of 4.5
mg ml−1PBS standard solution (1), sunscreen gel solution containing
4.5mg ml−1PBS (2) and of control sample solution (3) in equivalent
dilution in 0.1 mol l−1 triethanolamine. Wavelength range 200.0 – 400.0 nm.
Application of the second-order derivative UV spec-trophotometric method in the sunscreen gel sample employing ten determinations resulted in low values of coefficient of variation, an indication of good precision in the repeatability test. The 10.5 mg ml−1 BZP
stan-dard solution prepared in ethanol 95%, and the 4.5 mg
ml−1 PBS standard solution prepared in 0.1 mol l−1
triethanolamine were used to obtain the sunscreen sam-plede terminations. For both substances the least photo-metric error was verified at these standard concentra-tions points.
The reproducibility test was performed on 3 different days to check inter-day variability. Response factors, represented by the second-order derivative absorbances to concentration ratios, were submitted to statistical analysis to evaluate the coefficient of variation.
Concentration results, calculated based upon the la-bel claim values were found to be 0.990% w/w for BZP (ZP method), and 3.070 and 3.134% w/w for PBS (ZP and PP methods), respectively. These figures account for 99.0, 102.33 and 104.46% of the gel labeled amounts, respectively.
The recovery test for evaluation of the accuracy of the method through the standards addition method is presented in Table 2 in percentage values for BZP and PBS. It can be observed that after BZP standard addi-tion to control sample, the formulaaddi-tion excipients do not influence reading absorbances at D2. BZP was
determined with recovery results between 96.27 and 98.46%. For the PBS recovery test, values varied from 102.65 to 104.08%, representing satisfactory results for a cosmetic formulation.
5. Conclusions
The proposed methodology, second order derivative UV spectrophotometry, permitted identification and interval of 300.0 – 400.0 nm. However, this feature does
not present a problem since the elimination of interfer-ences in this region is evident, as curve (3) shows a flat even baseline with no absorption. The absorption mea-surements within this interval can easily be determined for PBS analysis, for it is free from interferences.
Table 2
Recovery resultsaobtained for BZP determination through D2, ZP at 356.0 nm, and for PBS through D2, ZP at 317.5 nm and PP at 317.5–323.0 nm
Sample/method Added amount (mg ml−1) Recovered amount (mg ml−1) % Recovery 10.5
BZP/ZP 10.11 96.27
96.27 13.00
13.5
16.5 16.25 98.46
19.5 19.13 98.12
103.40
PBS/ZP 4.5 4.65
5.5 5.68 103.36
6.5 6.67 102.65
103.10 7.73
7.5
104.08
PBS/PP 4.5 4.68
5.5 5.71 103.75
6.5 6.72 103.33
7.5 7.77 103.66
quantification of the combined sunscreens, BZP and PBS, in the gel preparation when evaluated compara-tively with their respective references in the stated conditions.
The method employs low cost reagents and requires a relatively short time for analysis despite the use of sophisticated derivative software. It proved to be effec-tive in eliminating interferences from excipients and overlaid bands [17 – 19], and it may be applied to many types of pharmaceutical preparations (e.g. oil in water, o/w and water in oil, w/o emulsions), as long as sample preparation is adequate. Finally, it is especially useful in quality control for cosmetics and pharmaceuticals in laboratories and related companies.
Acknowledgements
This work was supported by PRPq/UFMG, FANAPE, and CAPES. The authors are grateful to Dr M.R. Borenstein for advice and translation assistance.
References
[1] P.A. Viglioglia, J. Rubin, Cosmiatria II, A.P. Americana, Buenos Aires, 1989, p. 414.
[2] E.C. Vilar, A. Pinho, R.R. Morgado, Analise comparativa da eficacia de protecao de cosmeticos solares comercializados, Rev. Port. Farm. 39 (1989) 50 – 55.
[3] M. Stockdale, Cosmet. Toiletries 3 (1991) 26 – 30.
[4] E.R.M. Hackmann, S.A. Beneton, M.I.R.M Santoro, Espectro-fotometria derivada na analise de farmacos em medicamentos, Rev. Port. Farm. 51 (1990) 7 – 12.
[5] P. Levillain, D. Fompeydie, Derivative spectrometry. Principles, advantages and limitations, applications, Analusis 14 (1986) 1 – 20.
[6] F.R. Sanches, C.O. Bosch, J.M.P. Cano, Derivative ultraviolet – visible region absorption spectrophotometry and its analytical applications, Talanta 35 (1988) 753 – 761.
[7] M.M. Abdel-Khalek, M.E. Abel-Hamid, M.S. Mahrous, M.A. Abdel-Salam, Second-derivative spectrophotometry determina-tion of some benzenoid drugs, Anal. Lett. 18 (1985) 781 – 792. [8] T.C. O’Haver, Potential clinical applications of derivative and
wavelength-modulation spectrometry, Clin. Chem. 25 (1979) 1548 – 1553.
[9] G. Talsky, L. Mayring, H. Kreuzer, High-resolution, higher-or-der UV/VIS derivative spectrophotometry, Angew. Chem., Int. Ed. Engl. 17 (1978) 785 – 799.
[10] United States Pharmacopeia, 23rd ed., United States Pharma-copeial Convention, Rockville, MD, 1990, p. 1710 – 1712. [11] N.A. Shaath, Cosmet. Toiletries 1 (1989) 12 – 27.
[12] A.I.T. Sua´rez, M.A.C. Sa´nchez, Validation of two analytical methods applied to two new cytostatic drugs, S.T.P. Pharma Pratiques 2 (1992) 93 – 99.
[13] Clarke’s Isolation and Identification of Drugs, Pharmaceutical Press London, second ed., 1989, p. 221 – 239.
[14] R.B. Davis, J.E. Thompson, H.L. Pardue, Characteristics of statistical parameters used to interpret least-squares results, Clin. Chem. 24 (1978) 611 – 620.
[15] A.L.I. Wilson, The performance-characteristics of analytical methods — I, Talanta 17 (1970) 21 – 29.
[16] F.A. El-Yazbi, M.A. Korany, O. Abdel-Razak, M.A. Elsayed, Derivative spectrophotometry determination of some cortico-steroids in combinations with other drugs, J. Assoc. Off. Anal. Chem. 69 (1986) 614 – 618.
[17] I. Dol, M. Knochen, C. Altesor, Enhancement of precision and accuracy in derivative spectrophotometry of highly absorbing samples, Analyst 116 (1991) 69 – 75.
[18] A.F. Fell, Analysis of pharmaceutical dosage forms by second derivative ultraviolet – visible spectrophotometry, Proc. Anal. Div. Chem. Soc. 15 (1978) 260 – 267.
[19] C.D. Vianna-Soares, J.L.S. Martins, Derivative ultraviolet spec-trophotometric determination of saccharin in artificial sweeten-ers, Analyst 120 (1995) 193 – 195.