Article
J. Braz. Chem. Soc., Vol. 25, No. 11, 1993-1999, 2014. Printed in Brazil - ©2014 Sociedade Brasileira de Química 0103 - 5053 $6.00+0.00
A
*e-mail: [email protected]
Evaluation of the Bioaccessability of Ca, Fe, Mg and Mn in Ground Coffee Infusions
by
in vitro
Gastrointestinal Digestion
Ewelina Stelmach, Pawel Pohl* and Anna Szymczycha-Madeja
Department of Analytical Chemistry, Faculty of Chemistry, Wroclaw University of Technology, Wybrzeze Stanislawa Wyspianskiego 27, 50-370 Wroclaw, Poland
Determinou-se a bioacessibilidade de Ca, Mg, Mn e Fe em infusões de café em pó através de digestão gastrointestinal in vitro com soluções de suco estomacal e intestinal (pepsina, pancreatina e sais biliares). A absorção de metais nas vilosidades intestinais foi simulada por ultrafiltração com uma membrana semi-permeável de 3 kDa de massa molar de corte. As concentrações de Ca, Fe, Mg e Mn em infusões de café e permeados de incubados gastrointestinais foram medidas por espectrometria de absorção atômica com chama. Estabeleceu-se que Mg, com uma contribuição de 62% à fração bioacessível, foi o elemento mais bioacessível. As bioacessibilidades de Ca (42%) e Fe (43%) foram similares, mas os resultados individuais de ambos os metais variaram amplamente. O metal menos bioacessível foi o Mn, com uma contribuição média de 27%. Beber uma xícara de café diariamente cobre minimamente os valores diários de referência de Ca, Fe, Mg e Mn (menos que 3%).
The bioaccessibility of Ca, Mg, Mn and Fe in ground coffee brews was assessed through in vitro gastrointestinal digestion with stomach and intestinal juice solutions (pepsin, pancreatin and bile salts). Absorption of metals in the intestinal villi was simulated by ultrafiltration over a 3 kDa molecular weight cut-off semi-permeable membrane. Concentrations of Ca, Fe, Mg and Mn in coffee infusions and permeates of gastrointestinal incubates were measured by flame atomic absorption spectrometry. It was established that Mg, with a 62% contribution to the bioaccessible fraction, was the most bioaccessible. The bioaccessibilities of Ca (42%) and Fe (43%) were similar but individual results for both metals varied widely. The least bioaccessible metal was Mn, with an average contribution of 27%. Drinking one cup of coffee daily covers dietary reference intakes of Ca, Fe, Mg and Mn to a small degree (less than 3%).
Keywords: ground coffee, bioaccessibility, in vitro gastro-intestinal digestion, calcium, iron, magnesium, manganese, FAAS
Introduction
A great many people are habitual consumers of ground coffee.1 Information about total concentrations of different
elements, i.e., minerals, micronutrients and trace elements, in ground coffee is commonly used to evaluate its quality and safety.2-4 Total concentrations of elements in ground
coffees are considered in evaluating their nutritional value and the ability of coffee brews to cover daily dietary intake requirements of various elements.5-7 However, this
is not entirely justified when considering the real uptake of elements from coffee or its role in human nutrition. Elements, especially metals, may exist in ground coffee infusions as either simple or complexing ions of different
stability. Various low, moderate and high molecular mass endogenous bioligands, e.g., phenolic acids and flavonoids, may willingly bind metal ions through hydroxyl, carboxylate and phenolate O-donor groups.8 In particular,
the presence of the latter species can affect the extent of transfer of metals from coffee powder into infusions during brewing because they have different solubilities.9
Having different bioavailabilities, these species may also modify the uptake of elements from coffee by the human body. Surprisingly, the issue of the bioavailability and the bioaccessibility of elements from coffee and the extent of their absorption through the gastrointestinal tract is not firmly established in Polish and foreign literature.
and sometimes questionable.10 More frequently, in vitro
simulations of processes occurring in the gastrointestinal tract, i.e., the digestion of food product and beverage components and absorption of the species released by intestinal villi, are preferred. Several approaches to such in vitro simulations have been described in the literature.11,12
The most popular is a two-step incubation that simulates stomach and intestinal digestions using enzyme-based solutions including amylase, pepsin, pancreatin, bile salts and inorganic compounds,13 or, if accessible, normal gastric
juices.14 Samples are incubated under conditions selected to
mimic gastric and intestinal peristalsis, e.g., a temperature of 37 °C with gentle shaking. After in vitro digestion, absorption of elements in the villi is simulated by ultrafiltration over membranes having molecular weight cut-offs (MWCOs) of 1.3 or 5 kDa.14 The process can also be mimicked by
extraction with cell culture biomembranes13,15 or dialysis.16-18
To date, the bioaccessibility of essential elements has been assessed in a number of different food products, beverages and stimulants, including fruit juices,15,19 tea,14 herbal
decoctions,13 different milks,16-18,20 baby foods,21 wines,22
cereals,12 seafood and fishes,12 cocoa powders,12 wheat,23
white cheese and bread,24 fruits and vegetables,12,24 whole
meals and fast-foods,25 different kinds of meat,23 and honey.26
It is recognized that coffee constituents, mostly phenolics and melanoidins, chelate some nutrients, particularly Fe and Zn, and are responsible for an increased inhibition of the absorption of these metals from diet in which coffee is included.27,28 On the other hand, coffee
brews represent an important source of dietary Mg.28
A statistically significant association between coffee consumption and a lower risk of type 2 diabetes mellitus reinforces the role of coffee and an intake of Mg with this beverage.29 However, it is difficult to opine that the total
amount of Mg determined in the coffee brew is entirely available to the human body as no such research has been carried out so far.
For all reasons stated above, the information on the bioaccessibility of physiologically important nutrients in coffee infusions seems to be important. The objective of this study was to determine the contributions of the bioaccessible fractions of four important micronutrients, i.e., Ca, Fe, Mg and Mn, in brews of 13 roasted and ground coffees commercially available in the Lower Silesia region of Poland under gastrointestinal conditions. Towards this aim, a two-step extraction procedure simulating digestion by gastric and intestinal juices followed by separation of the smallest molecular weight fraction (< 3 kDa) of elemental species by filtration of the gastrointestinal digests of coffee infusions through a semi-permeable membrane with a 3 kDa MWCO was used.
Experimental
Reagents and samples
ACS grade solutions of 30% (m/m) H2O2, 37% HCl and
65% (m/m) HNO3 were supplied by J. T. Baker (Deventer,
the Netherlands). Pepsin from porcine gastric mucosa (800-2500 units mg-1 of protein), pancreatin from porcine
pancrease, bile salts, NaHCO3,as well as TraceCERT®
single-element 1000 mg L-1 stock standard solutions of
Ca, Fe, Mg and Mn were provided by Sigma-Aldrich Chemie GmbH (Steinheim, Germany). For gastrointestinal digestion, solutions of simulated gastric (SGJ) and intestinal (SIJ) juices were prepared using solid reagents. They contained 0.20 g L-1 of pepsin in a 0.10 mol L-1 HCl solution
(SGJ) and 0.15 g L-1 of pancreatin with 1.50 g L-1 of bile
salts in a 0.10 mol L-1 NaHCO
3 solution (SIJ). The content
of the simulated gastrointestinal juices was selected based on procedures previously used for bioaccessibility assays of selected metals in milk,20 wines,22 and honey.26 Because
coffee is consumed as a fluid, which is not broken down in the oral cavity, it was decided to omit any simulation of digestion in the mouth by saliva, as proposed by other authors in the case of fruit juices.19
Stock standard solutions of Ca, Fe, Mg and Mn were used to prepare and matrix-match (in reference to levels in SGJ and SIJ solutions) four-element standard solutions for calibration. Re-distilled water was used in all preparations.
Eleven of the most popular ground roasted coffees (C1-C11) and two roasted bean coffees (C12 and C13) commercially available in Poland were selected for the study.
Instrumentation
integration time and averaged. Five multi-element standard solutions were used for calibration. The concentrations of metals in these solutions were in the following ranges: 0.05-2.00 mg L-1 (Ca, Fe), 0.01-2.00 mg L-1 (Mg), and
0.05-1.00 mg L-1. Instrumental detection limits (IDLs) of
0.012, 0.018, 0.001 and 0.006 mg L-1 were assessed for Ca,
Fe, Mg and Mn, respectively.
A Sartorius AG Vivaflow 50 (Goettingen, Germany) disposable plug and play laboratory cross-flow cassette equipped with a polyethersulfone (PES) membrane with a 3 kDa MWCO was used to separate the bioaccessible fractions (< 3 kDa) of Ca, Fe, Mg and Mn from incubates of coffee infusions by ultrafiltration. A standard Cole-Parmer (Vernon Hill, IL, USA) 2-channel MasterFlex L/S peristaltic pump was used to maintain a flow rate of 200-400 mL min-1
(max. 4 bars) through the cassette.
An Elpin (Lubawa, Poland) thermostatic water bath shaker (type 357) was used in incubation experiments. An MPW-350 centrifuge (MPW Medical Instruments, Warsaw, Poland) was used to separate incubates of ground coffees treated with SGJ and SIJ solutions.
Preparation of coffee brews
To prepare brews of ground roasted coffees, 7.2 g samples (two spoons on average) were placed in 400 mL Pyrex glass beakers, on which were poured 200 mL of boiling re-distilled water with stirring. After 10 min of brewing, the infusions were separated from the settled grounds by filtrating them through qualitative cellulose filter papers (thickness 150 mm). In the case of roasted bean coffees (C12 and C13), the beans were ground first in a manual coffee mill. Three independent infusions were prepared from each coffee brand. In addition, procedural/reagent blanks were prepared. The infusions were split; 20 mL portions were analysed by FAAS for total concentrations of Ca, Fe, Mg and Mn, another 40 mL aliquots were subjected to in vitro simulated gastrointestinal digestion prior to evaluating the contribution of the bioaccessible fraction of each studied metal.
Total concentrations in ground coffees and coffee brews
Total concentrations of Ca, Fe, Mg and Mn in analysed ground coffees were determined as described elsewhere with a small modification.30 Accordingly, samples of ground
coffees (1.0 g) were placed in 250 mL Pyrex glass beakers
to which were added 5.0 mL of a concentrated HNO3
solution for predigestion (12 h). Then, 5.0 mL of HNO3
were added and the samples were digested at 80-90 oC on
a temperature-controlled hot plate. After evaporating half
the volume of each sample solution, 5.0 mL of a 30% H2O2
solution were added and digestion was continued. Finally, the sample solutions were evaporated to near dryness, after which the digests were reconstituted with 10 mL of water, transferred quantitatively to 25 mL Pyrex glass volumetric flasks and topped with water to the mark.
Concentrations of Ca, Fe, Mg and Mn in the coffee infusions were determined using a recently developed simplified method of analysis.30 Ten millilitre samples
of coffee infusions were acidified with 1.0 mL of a concentrated HNO3 solution and directly analysed by
FAAS. For each coffee brand, three independently prepared solutions of digested ground coffee samples and infusions of this coffee were analysed by FAAS. Simple standard solutions and reagent blanks were used for calibration. Concentrations of Fe and Mn were measured in undiluted sample solutions. In the case of Ca and Mg, the sample solutions were diluted either 10 and 20 fold (Ca) or 50 and 100 fold (Mg) prior to measurements.
In vitro gastrointestinal digestion of coffee brews
Aliquots of coffee infusions (40 mL) were placed in 100 mL polypropylene (PP) sample tubes and 5.0 mL of an SGJ solution were added for in vitro simulation of gastric digestion. Sample tubes were capped with polyethylene (PE) screw caps and placed in a temperature-controlled shaking water bath. Incubation of coffee infusions was carried out at 37 oC with agitation (250 rpm) and lasted
2 h. After that, the enzymatic reaction was stopped by placing the sample tubes in an ice bath. To mimic intestinal conditions, the pH of gastric digests was increased to 7.0 (close to intestinal pH) by adding few drops of a 0.10 mol L-1
NaHCO3 solution. Then, 5.0 mL of an SIJ solution were
added. The sample tubes were capped and incubation was continued at 37 oC with agitation (250 rpm) for the next 2 h.
When the incubation was over, the enzymatic reaction was stopped by placing the sample tubes in an ice bath. The final incubates were filtered over 0.45 µm cellulose membrane filters and then through 3 kDa Vivaflow 50 cross-flow ultrafiltration cassettes. The initial portions of the permeates (about 5 mL), corresponding to the dead volumes of the ultrafiltration cassettes and delivery tubes, were discarded. Next, three 5.0 mL portions of permeates were collected. This is schematically shown in Figure 1. Concentrations of Ca, Fe, Mg and Mn were measured in these permeates after subsequent acidification with a concentrated HNO3
solution (0.5 mL of acid per 5.0 mL of permeate). The bioaccessible fraction contribution was calculated as 100 × B / T, where B is the concentration of element (in
permeate resulting from passing gastrointestinal digests through 3 kDa ultrafiltration cassettes) and T is the concentration of element (in mg L-1) in the infusion. In a
similar way, the bioaccessibility of the selected elements was previously assessed for other beverages, i.e., tea infusion14 and orange juice,19 where concentrations of
elements found in the 3 kDa ultrafiltrates were related to their total concentrations determined in both beverages.
For each coffee brand, gastrointestinal extraction was repeated twice using freshly prepared coffee infusions. The collected portions (n = 6) of permeates (the “< 3 kDa” fraction) were analysed by FAAS. As before, the concentrations of Fe and Mn were measured in undiluted portions of the permeates using matrix-matched standard solutions. The concentrations of Ca and Mg were measured in diluted permeates, and simple standard solutions were used for the calibration. The results were averaged and corrected for values of procedural blanks. The contributions by the bioaccessible fractions of Ca, Fe, Mg and Mn were calculated as ratios of the concentration of each metal that passed through the 3 kDa ultrafiltration membrane (the “< 3 kDa” fraction) to its concentration in the infusion.
Results and Discussion
Optimisation of in vitro gastrointestinal digestion of coffee
brews
At the outset, we tried to find minimal concentrations of reagents in the solutions of simulated gastric and intestinal juices that would provide the best performance in both digestion steps and reduce the risk of contamination and possible interference during measurements of Ca, Fe, Mg and Mn by FAAS. In addition, the effect of incubation time was studied. Accordingly, three different SGJ and SIJ
solutions were used, i.e., 0.20, 0.40 and 1.0 g L-1 pepsin
in 0.10 mol L-1 HCl (SGJ1, SGJ2 and SGJ3, respectively),
0.15 g L-1 pancreatin with 1.5 g L-1 bile salts in 0.10 mol L-1
NaHCO3 (SIJ1), 0.30 g L
-1 pancreatin with 3.0 g L-1
bile salts in 0.10 mol L-1 NaHCO
3 (SIJ2) and 0.75 g L-1
pancreatin with 7.5 g L-1 bile salts in 0.10 mol L-1 NaHCO 3
(SIJ3). Incubations with each digestion step lasted 1, 2 or 3 h. All experiments were carried out using a single ground coffee, i.e., C10. Infusions of this coffee were prepared and subjected to gastrointestinal digestion. Concentrations of Ca, Fe, Mg and Mn were determined by FAAS in permeates (the “< 3 kDa fraction”) obtained after ultrafiltration of incubates and were referred to as the bioaccessible fraction.
It was found that except for Ca, differences in the contributions of the bioaccessible fractions of Ca, Fe, Mg and Mn assessed using SGJ and SIJ solutions containing different concentrations of enzymes and bile salts were all within the range from –7.5 to +6.7%. Accordingly, contributions of the bioaccessible fraction of studied elements were varied in the following ranges: 33.2-46.9% (Fe), 55.1-62.6% (Mg) and 27.0-37.7% (Mn). In the case of Ca, it was observed that the most concentrated SGJ and SIJ solutions decreased the contribution by the bioaccessible fraction of this metal by about 28%. This was possibly related to complexation of Ca by enzymes. The precision of the results (expressed as relative standard deviation, RSD) was fair, and varied from 8.6 to 22% for Ca, from 21 to 62% for Fe, from 1.3 to 21% for Mg and from 19 to 59% for Mn. This could be associated with the low concentrations of the measured metals, particularly Fe and Mn, in the collected permeates. The effect of different particle sizes of coffee powder may also contribute to the noted variations in the concentrations of metals in the prepared infusions. However, to imitate domestic conditions, all ground coffees were analysed as consumed; they were not additionally ground and sieved to select a uniform narrower mass fraction. Taking into account the precision of the determinations of Ca, Fe, Mg and Mn, it was concluded that increasing the concentrations of reagents in the SGJ and SIJ solutions was practically insignificant for extraction of these metals. It was further established that a shorter incubation time (1 h) for each digestion step was insufficient to extract Fe and Mn. Contributions of the bioaccessible fractions of these metals were about 20% lower compared to those obtained during 2 h incubations, i.e., 40.2% for Fe and 34.1% for Mn. When each digestion step was longer, i.e., 3 h, it was found that bioaccessibilities of Ca, Fe and Mn are slightly changed (respectively by –9, +6 and –7%), but the bioaccessibility of Mg is diminished by 41%.
For all these reasons, the solutions of lowest concentration, i.e., SGJ1 (0.20 g L-1 pepsin in 0.10 mol L-1
HCl) and SIJ1 (0.15 g L-1 pancreatin and 1.5 g L-1 bile Figure 1. A scheme of the in vitro gastrointestinal digestion of coffee
salts in 0.10 mol L-1 NaHCO
3), were used for enzymatic
digestion. An incubation time of 2 h seemed to be the most optimal, as previously reported by Hur et al..31 In addition,
the validity of the results obtained with the aforementioned in vitro gastrointestinal digestion was confirmed. Standard solutions of Ca, Fe, Mg and Mn (all at 1.0 mg L-1) were
subjected to the complete procedure and the collected permeates were analysed by FAAS. It was found that average recoveries (n = 3) of Ca, Fe, Mg and Mn were 97.8 ± 5.0, 101 ± 1, 108 ± 12 and 96.7 ± 4.1%, respectively.
Bioaccessibility of Ca, Fe, Mg and Mn from coffee brews
As a plant-origin product, coffee has a complex biological matrix. It contains phenolic compounds,1
high and low molecular weight melanoids,32,33 caffeine,
trigonelline, nicotic, acetic, formic, malic, citric, lactic and quinic acids, soluble fibres, pectins and small amounts of phytic acid.1 Hence, the possibility of release of these
compounds during gastrointestinal digestion of a coffee brew is great; the aforementioned groups of compounds may also alter the uptake of metals, e.g., render them unavailable for absorption.34,35
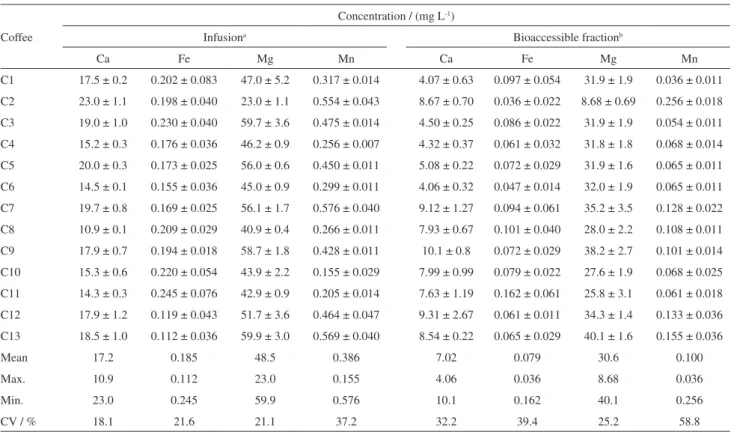
Table 1 presents concentrations of Ca, Fe, Mg and Mn in infusions of ground coffees and bioaccessible fractions
(“< 3 kDa”) as determined by gastrointestinal digestion. This is the first time such data have been presented. The outcomes achieved were compared to those reported for other beverages (milk, tea) and dietary products. In general, considering the sum of the contributions by the bioaccessible fractions of Ca, Fe, Mg and Mn in each case, it appears that these metals are the least bioaccessible in coffee C3 and the most available in coffee C12.
The average concentration of Ca in the coffee infusions was 17.2 mg L-1 with a coefficient of variation (CV) of
18%. The contribution of the bioaccessible fraction of Ca varied from 23.3% (coffee C1) to 72.8% (coffee C8). The average contribution of this fraction of Ca was moderate, i.e., 42.0% with a CV of 37%. Although Ca is soluble at pH 1-8,12 there are possible inhibitors of oral bioaccessibility of
this metal in coffee, i.e., oxalic and phytic acids.1 Similar
results for Ca were obtained in the case of tea infusions, i.e., 48% bioaccessibility.14 It is worth noting that the
bioaccessibility of Ca from coffee infusions is about two fold higher than from milk, dairy products and infant formulas.18 Nevertheless, concentrations of Ca in the latter
food products are much higher compared to coffee brews, and they are better sources of this metal.
The concentration of Fe in the coffee infusions varied over a small range, i.e., from 0.11 to 0.24 mg L-1 with a CV
Table 1. Concentrations of Ca, Fe, Mg and Mn in coffee infusions and in the bioaccessible fraction resulted from the gastrointestinal digestion
Coffee
Concentration / (mg L-1)
Infusiona Bioaccessible fractionb
Ca Fe Mg Mn Ca Fe Mg Mn
C1 17.5 ± 0.2 0.202 ± 0.083 47.0 ± 5.2 0.317 ± 0.014 4.07 ± 0.63 0.097 ± 0.054 31.9 ± 1.9 0.036 ± 0.011
C2 23.0 ± 1.1 0.198 ± 0.040 23.0 ± 1.1 0.554 ± 0.043 8.67 ± 0.70 0.036 ± 0.022 8.68 ± 0.69 0.256 ± 0.018
C3 19.0 ± 1.0 0.230 ± 0.040 59.7 ± 3.6 0.475 ± 0.014 4.50 ± 0.25 0.086 ± 0.022 31.9 ± 1.9 0.054 ± 0.011
C4 15.2 ± 0.3 0.176 ± 0.036 46.2 ± 0.9 0.256 ± 0.007 4.32 ± 0.37 0.061 ± 0.032 31.8 ± 1.8 0.068 ± 0.014
C5 20.0 ± 0.3 0.173 ± 0.025 56.0 ± 0.6 0.450 ± 0.011 5.08 ± 0.22 0.072 ± 0.029 31.9 ± 1.6 0.065 ± 0.011
C6 14.5 ± 0.1 0.155 ± 0.036 45.0 ± 0.9 0.299 ± 0.011 4.06 ± 0.32 0.047 ± 0.014 32.0 ± 1.9 0.065 ± 0.011
C7 19.7 ± 0.8 0.169 ± 0.025 56.1 ± 1.7 0.576 ± 0.040 9.12 ± 1.27 0.094 ± 0.061 35.2 ± 3.5 0.128 ± 0.022
C8 10.9 ± 0.1 0.209 ± 0.029 40.9 ± 0.4 0.266 ± 0.011 7.93 ± 0.67 0.101 ± 0.040 28.0 ± 2.2 0.108 ± 0.011
C9 17.9 ± 0.7 0.194 ± 0.018 58.7 ± 1.8 0.428 ± 0.011 10.1 ± 0.8 0.072 ± 0.029 38.2 ± 2.7 0.101 ± 0.014
C10 15.3 ± 0.6 0.220 ± 0.054 43.9 ± 2.2 0.155 ± 0.029 7.99 ± 0.99 0.079 ± 0.022 27.6 ± 1.9 0.068 ± 0.025
C11 14.3 ± 0.3 0.245 ± 0.076 42.9 ± 0.9 0.205 ± 0.014 7.63 ± 1.19 0.162 ± 0.061 25.8 ± 3.1 0.061 ± 0.018
C12 17.9 ± 1.2 0.119 ± 0.043 51.7 ± 3.6 0.464 ± 0.047 9.31 ± 2.67 0.061 ± 0.011 34.3 ± 1.4 0.133 ± 0.036
C13 18.5 ± 1.0 0.112 ± 0.036 59.9 ± 3.0 0.569 ± 0.040 8.54 ± 0.22 0.065 ± 0.029 40.1 ± 1.6 0.155 ± 0.036
Mean 17.2 0.185 48.5 0.386 7.02 0.079 30.6 0.100
Max. 10.9 0.112 23.0 0.155 4.06 0.036 8.68 0.036
Min. 23.0 0.245 59.9 0.576 10.1 0.162 40.1 0.256
CV / % 18.1 21.6 21.1 37.2 32.2 39.4 25.2 58.8
of 22%. The variation in the concentration of this metal in the bioaccessible fraction was higher, i.e., between 0.04 and 0.16 mg L-1 with a CV of 39%. The average contribution of
this fraction of Fe was 43.3%, with low and high values of 18.2% (coffee C2) and 66.2% (coffee C11), respectively. It could be presumed that the main inhibitors of Fe in coffee infusions are phytic acid and polyphenols,36 which are
abundant in coffee. In the case of phytic acid, the formation of insoluble Fe complexes occurs when large quantities of phytates are consumed.36 As reported by Powell et al.14
for tea infusions, polyphenols readily bind trivalent Fe ions, inhibiting absorption of this metal. The presence of Ca may also reduce the absorption of Fe.1 On the other
hand, there are substances that may enhance its uptake, e.g., ascorbic acid due to its reduction of Fe(III) to Fe(II).37
Other organic acids with OH groups, i.e., citric, lactic and tartaric, may increase absorption of Fe as well.38 Hence, the
great variability in the bioaccessibility of Fe observed here for coffee infusions is likely associated with differences in the composition of the coffees.
Magnesium was established as the most bioaccessible among studied metals in the brewed coffees. The average concentration of Mg in the coffee infusions was 48.5 mg L-1
with a CV of 21%, while the average contribution of the bioaccessible fraction of this metal was 62.2%, with the lowest CV value, i.e., 18%. This suggests that the bioaccessibility of Mg in coffee is not strongly affected by matrix constituents, although this metal may be willingly bound by melanoids.35 The lowest bioaccessibility of Mg
was found in coffee C2 (37.8%), the highest in coffee C6 (70.8%). In all coffees, the bioaccessibility of Mg from infusions was relatively high and quite comparable. These results were in good agreement with those previously described for black tea by Powell et al.,14 where a 66.4%
contribution of the bioaccessible fraction of Mg to its concentration was reported for its brew.
Data about the absorption and excretion of Mn has revealed that uptake of this metal in the gastrointestinal track is low.39 Indeed, compared to the results obtained for
Ca, Fe and Mg, Mn was the least bioaccessible in the coffee infusions. The average concentration of this microelement in the analysed coffee infusions was 0.39 mg L-1 (with a CV
of 37%), about twice as high as the average concentration of Fe. However, the average contribution of the bioaccessible fraction of this metal was low, i.e., 26.8%. In addition, the bioaccessibility of Mn from infusions of different coffees varied over a high range, i.e., from 11.4% (coffee C1) to 46.1% (coffee C2). Its CV of 43% reflected this fact. It can be supposed that such variability in the results achieved for Mn could be related to differences in the compositions of the analysed coffees and the chemical nature of this metal.
Accordingly, the bioaccessibility of Mn could be affected by the presence of phytic and ascorbic acids as well as pectins.34 These compounds may bind Mn and impair its
uptake. In addition, being an acid-soluble metal like Fe, Mn could form insoluble hydroxide precipitates under conditions of gastrointestinal digestion.14
Dietary reference intakes (DRIs) of Ca, Fe, Mg and Mn through coffee brews
The extent of coverage of adequate intakes (AIs) and recommended dietary allowances (RDAs) of the studied metals was evaluated considering their normative values established by the National Research Council for 10-30 year life stage group,40 i.e., 1000 mg day-1 of Ca (AI for
males and females), 8 and 18 mg day-1 of Fe (RDAs for
males and females, respectively), 400 and 310 mg day-1
of Mg (RDAs for males and females, respectively), and 2.3 and 1.8 mg day-1 of Mn (AIs for males and females,
respectively) Considering that one cup of the different coffees (7.2 g of ground coffee brewed in 200 mL of boiling water) is drunk per day, it appears that the respective DRIs of Ca, Fe, Mg and Mn are marginally covered, i.e., 0.08-0.20% (Ca), 0.04-0.41% (Fe), 0.4-2.6% (Mg) and 0.3-2.8% (Mn). These findings may be compared with previous results6,41 reporting that one cup of coffee may
contribute about 0.3% to RDIs of Ca and Fe, about 1.0-5.0% to the RDI of Mg and 2.2-3.4% to the RDI of Mn. The cited values are more than 2-3 fold higher than those assessed in the present study. It should be noted, however, that they were based on the total concentrations of Ca, Fe, Mg and Mn determined in coffee infusions without considering the bioaccessibility of these metals.
Conclusions
The present study reports for the first time on the bioaccessibility of selected macro- and microelements, i.e., Ca, Fe, Mg and Mn, in brews of ground coffees. It was found that the most bioaccessible metal in coffee is Mg, with the bioaccessible fraction contributing on average 62% in reference to the Mg content in the infusions. The least bioaccessible is Mn, with an average contribution of 27% in reference to the Mn content in the infusions. The bioaccessibility of Ca and Fe were comparable; the bioaccessible fractions of these metals contributed on average 42 and 43%, respectively.
or both and may accompany eating a meal. This makes the bioaccessibility of metals much more complicated, as can be expected.
Acknowledgments
The National Science Centre founded this work (decision No. 2013/09/B/NZ9/00122). The work was also financed by a statutory activity subsidy from the Polish Ministry of Science and Higher Education for the Faculty of Chemistry, Wroclaw University of Technology. The company 92Coffee is acknowledged for supplying roasted coffee samples.
References
1. Farah, A. In Coffee. Emerging Health Effects and Disease Prevention; Chu, Y. F., ed.; John Wiley & Sons: Oxford, UK, 2012, pp. 21-58.
2. Pohl, P.; Stelmach, E.; Welna, M.; Szymczycha-Madeja, A.; Food Anal. Methods 2013, 66, 598.
3. Amorim Filho, V. R.; Polito, W. L.; Gomes Neto, J. A.; J. Braz. Chem. Soc. 2007, 18, 47.
4. Martin, M. J.; Pablos, F.; Gonzalez, A. G.; Food Chem. 1999, 66, 365.
5. Ashu, R.; Chandravanshi, B. S.; Bull. Chem. Soc. Ethiop. 2011, 25, 11.
6. Grembecka, M.; Malinowska, E.; Szefer, P.; Sci. Total Environ. 2007, 383, 59.
7. Suseela, B.; Bhalke, S.; Vinod Kumar, A.; Tripathi, R. M.; Sastry, V. N.; Food Addit. Contam., Part A 2001, 18, 115. 8. Cornelis, R.; Crews, H.; Caruso, J.; Heumann, K.; Handbook
of Elemental Speciation. Techniques and Methodology; John Wiley & Sons: Chichester, UK, 2003.
9. Jaganyi, D.; Madlala, S. P.; J. Sci. Food Agric. 2000, 80, 85. 10. Ekmekcioglu, C.; Food Chem. 2002, 76, 225.
11. Powell, J. J.; Jugdaohsingh, R.; Thompson, R. P. H.; Proc. Nutr. Soc. 1999, 58, 147.
12. Intawongse, M.; Dean, J. R.; TrAC, Trends Anal. Chem. 2006, 25, 876.
13. Shun-xing, L.; Lu-xiu, L.; Jing, L.; Feng-ying, Z.; Qing-xiang, W.; Wen, W.; Phytochem. Anal. 2010, 21, 590. 14. Powell, J. J.; Burden, T. J.; Thompson, R. P. H.; Analyst 1998,
123, 1721.
15. Cilla, A.; Lagarda, M. J.; Alegria, A.; de Ancos, B.; Cano, M. P.; Sanchez-Moreno, C.; Plaza, L.; Barbera, R.; Food Res. Int. 2011, 44, 3030.
16. Perales, S.; Barbera, R. M.; Lagarda, M. J.; Farrea, R.; J. Agric. Food Chem. 2005, 53, 3721.
17. Shen, L.; Robberecht, H.; Van Dael, P.; Deelstra, H.; Biol. Trace Elem. Res. 1995, 49, 107.
18. Unal, G.; Nehir-El, S.; Kilic, S.; Int. J. Food Sci. Nutr. 2005, 56, 13.
19. Cautela, D.; Santelli, F.; Boscaino, F.; Laratta, B.; Servillo, L.; Castaldo, D.; J. Sci. Food Agric. 2009, 89, 2283.
20. Bermejo, P.; Pena, E. M.; Dominguez, R.; Bermejo, A.; Cocho, J. A.; Fraga, J. M.; Food Chem. 2002, 77, 361.
21. Silva, E. N.; Leme, A. B. P.; Cidade, M.; Cadore, S.; Talanta 2013, 117, 184.
22. Azenha, M.; Vasconcelos, M.; Food Chem. Toxicol. 2000, 38, 899.
23. Govasmark, E.; Brandt-Kjelsen, A.; Szpunar, J.; Bierla, K.; Vegarud, G.; Salbu, B.; Pure Appl. Chem. 2010, 82, 461. 24. Khouzam, R. B.; Pohl, P.; Lobinski, R.; Talanta 2011, 86, 425. 25. Camara, F.; Amaro, M. A.; Barbera, R.; Clemente, G.; Food
Chem. 2005, 92, 481.
26. Pohl, P.; Stecka, H.; Greda, K.; Jamroz, P.; Food Chem. 2012, 134, 392.
27. Wen, X.; Enokizo, A.; Hattori, H.; J. Agric. Food Chem. 2005, 53, 2684.
28. Higdon, J. V.; Frei, B.; Crit. Rev. Food Sci. Nutr. 2006, 46, 101. 29. Salazar-Martinez, E.; Willett, W. C.; Ascherio, A.; Ann. Intern.
Med. 2004, 140, 1.
30. Stelmach, E.; Pohl, P.; Szymczycha-Madeja, A.; Food Chem. 2013, 141, 1956.
31. Hur, S. J.; Lim, B. O.; Eric, A. D.; McClements, J.; Food Chem. 2011, 125, 1.
32. Bekedam, E. K.; Loots, M. J.; Schols, H. A.; Van Boekel, M.; Smit, G.; J. Agric. Food Chem. 2008, 56, 7138.
33. Bekedam, E. K.; Roos, E.; Schols, H. A.; Van Boekel, M.; Smit, G.; J. Agric. Food Chem. 2008, 56, 4060.
34. Gibson, R. S.; Am. J. Clin. Nutr. 1994, 59, l223S.
35. Rufian-Henares, J. A.; De La Cueva, S. P.; J. Agric. Food Chem. 2009, 57, 432.
36. Dendougni, F.; Schwedt, G.; Eur. Food Res. Technol. 2004, 219, 409.
37. Nair, M.; Iyengar, V.; Indian J. Med. Res. 2009, 130, 634. 38. Salovaara, S.; Sandberg, A. S.; Andlid, T.; J. Agric. Food Chem.
2002, 50, 6233.
39. Santamaria, A. B.; Indian J. Med. Res. 2008, 128, 484. 40. Otten, J. J.; Hellwig, J. P.; Meyers, L. D.; Dietary Reference
Intakes. The Essential Guide to Nutrient Requirements; The National Academies Press: Washington, USA, 2006.
41. United States Department of Agriculture (USDA) and Agricultural Research Service (ARS); USDA Nutrient Database for Standard Reference, Release 17, 2004.
Submitted: May 23, 2014