Quim. Nova, Vol. 30, No. 4, 768-773, 2007
Artigo
*e-mail: geowass@vm.uff.br
MERCURY IN SOILS AND SEDIMENTS FROM GOLD MINING LIABILITIES IN SOUTHERN AMAZONIA
Julio Cesar Wasserman*
Instituto de Geociências, Universidade Federal Fluminense, Av. Litorânea, s/n, 24210-340 Niterói - RJ, Brasil Reinaldo Calixto Campos
Departamento de Química, Pontifícia Universidade Católica do Rio de Janeiro, Rio de Janeiro – RJ, Brasil Sandra de Souza Hacon
Escola Nacional de Saúde Pública, Fundação Instituto Oswaldo Cruz, Rio de Janeiro – RJ, Brasil Renato A. Farias
Centro de Aqüicultura, Universidade Estadual Paulista, Jaboticabal – SP, Brasil Sandro M. Caires
Departamento de Solos e Nutrição de Plantas, Universidade Federal de Viçosa, Viçosa – MG, Brasil
Recebido em 8/11/05; aceito em 24/8/06; publicado na web em 26/3/07
The 1980–1990 Amazonian gold rush left an enormous liability that increasingly has been substituted by developing fish aquaculture. This work aimed at the identification of the mercury levels in the environment, associated with fish farms located in the North of Mato Grosso State, Southern Amazon. Sediment and soil samples were analyzed for total organic carbon and total mercury. Results indicate that the chemical characteristics of the sediment largely depend on the management procedures of the fish pond (liming, fish food used and fish population). The soils presented relatively low concentrations when compared with other data from the literature.
Keywords: mercury; fish farm; Amazon.
INTRODUCTION
Due to the drop of the gold prices in the international market, alongside the exhaustion of the more accessible sources, its mining has decreased from 100 tons a year in the eighties, to less than 30 tons a year in the late nineties1 in the Amazon Region. If gold yielded
large incomes for the gold dealers, only a few miners got rich, while nothing was left for the small land owners other than to attend the wild occupation and destruction of their agricultural areas. One of the most conspicuous scenarios left by gold mining is the crater-like landscape, completely devoided of vegetation where nothing can grow. After 10 years of the “gold rush”, the land owners inherited a considerable liability, since mining was carried out with no environmental concern, and now they are confronted with the challenge of recovering the economic use of their lands.
Among the activities that have shown to be suitable for the mined areas, the most successful was aquaculture. In the states of Pará and Mato Grosso there has been a significant increase in the number of aquaculture farms. The last Brazilian census2 (year 2000)
reports a total of 307 and 378 Artisan fish farms in Pará and Mato Grosso, respectively. In the North of Mato Grosso, Hacon and colleagues3 identified 255 areas of fish farming. In these farms, the
most cultivated species are Tambaqui (Colossoma macropomum), Tambacú (Colossoma macropomum) and Pacú (Piaractus mesopotamicus), that are very well accepted by the local community and have also been exported and sold in other Brazilian regions.
Although aquaculture has already shown to present very high income for the local communities, the fact that fish farms are mostly being carried out into mercury liabilities3 may engender a serious
treat to humans4. A brief budget of the anthropogenic inputs to the
Amazonian environment leads to a worrying picture. The amount
of mercury released during the 1980’s gold rush is estimated to be greater than two thousand tones5-7. Furthermore, this liability is
only a small contribution to the amount released by the Spanish and Portuguese, during over 200 years of gold and silver mining during the colonial times in South America8. On the other hand,
there are now evidences that Amazonian soils should present naturally elevated and widespread concentrations of mercury9-12.
These naturally elevated concentrations reflect on mercury contents of fishes, which are living in areas distant from any anthropogenic source of the metal13,14.
Wasserman et al.1 presented a detailed discussion of the sources
of mercury in soils of the Amazonian environment in a review of the cycling of this pollutant. Briefly, these authors refute the possibility of geologic origin, since no mercury bearing rock has ever been observed in the region. Nonetheless, they suggest that the sources for mercury in the Amazonian environment are mainly anthropogenic, but, due to the chemical characteristics of some soils (ferralytic soils15), the element would be retained for longer
periods, therefore increasing their concentrations. Once only localized soils have been studied and the concentrations of mercury in the whole Amazonian soils are still barely known, any of the former assumptions can not be taken as definitive.
understanding of the mercury behavior in the soils, sediments and possible transfer processes in fish of the entire Amazon Region.
METHODS
Sampling sites and collection
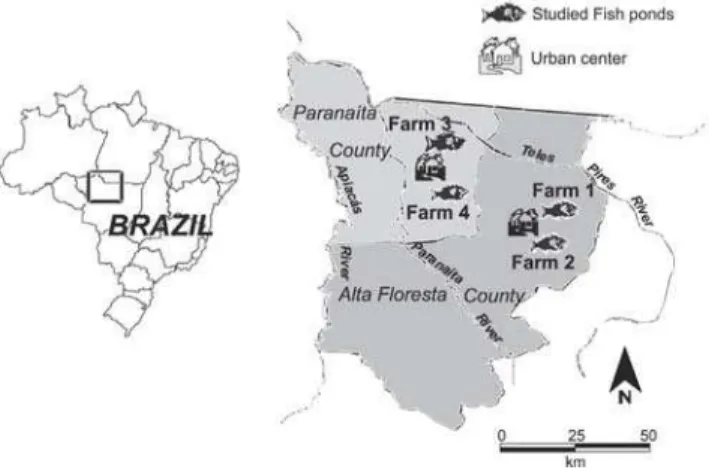
The studied area is presented in Figure 1. Their soils have already been described by Barbosa e Neves16, who pointed out the general
homogeneity of the pedological units of the region. The most common pedological unit is known as Machado Unity and is constituted of red-yellow podzolic soil with low nutrient loads. Although the soils were originally covered with thick and tall Amazonian forest, the whole region has suffered from intensive deforestation, carried out mainly with forest fires. In many places, carbonized trunks of tall trees can still be observed emerging from very extensive grasslands. Most of the remaining vegetation can be observed in the margin of the rivers, which are constituted of hydromorphous soils and can be flooded for six months during rainy season.
Soil samples were collected from areas that were close to the fish ponds in four farms (Figure 1). As displayed in Table 1, some of the fish farms have been subject to gold mining (farms 2 and 3) while others not. Although farms 1 and 4 were never subject to contamination, indirect sources such as atmospheric deposition can not be discarded17. Horizons (as described in Table 1) were sampled
with a manual inox drill and each level was placed in plastic bags, that was immediately ice refrigerated for transportation to the UNEMAT laboratory, at the Alta Floresta city, where they were kept in freezer (-20 oC), transported to our laboratories in Rio de Janeiro
and then analyzed. Sediment samples were collected from the fish ponds with a box corer (15 cm depth). Layers of 4 cm were separated and placed in plastic bags, ice refrigerated and transported to the laboratory where they were kept in freezer (-20 oC) until analysis.
Five sediment cores were collected from farms 2, 3 and 4 (Figure 1). Unfortunately, farm 1 sediments were lost during transportation and no results could be presented. Sediment samples from farm2 were
collected from two neighboring ponds that had roughly the same characteristics, but 2B (1.45 m) was shallower than 2A (1.70 m). Sediment sample 3A, which was located in farm 3, was too sandy and a complete core could not be drawn, therefore, only the superfi-cial (5 cm) sediment was collected. Another sediment core was drawn from a neighboring pond in farm 3 (sample 3B). A brief description of the water column characteristics is presented in Table 2.
Various fish species were collected from the ponds where sediments were collected. A list of the sampled species is presented in Table 3.
Analytical procedures
The analyses were performed at the PUC and UFF laboratories in Rio de Janeiro. Both sediments and soils were prepared and analyzed the same way: The samples were oven dried at 50 °C for three days and finely ground in an agate mortar. The moisture content was determined, by weighting the samples before and after drying. Fifty milligrams of soils samples and ten milligrams of sediment sample were weighted for the total organic carbon (TOC)
Table 1. Description of the soil samples collected in the neighborhood of the fish ponds
Sample Geographic Soil Location Presence of Type of Sampled horizons
code coordinates (UTM) classification gold mining vegetation
WPS1 X 603171 Ultisol Alta Floresta Never Grassland A1 (0 – 20 cm), A2 (20 – 30 cm),
Y 8904876 Farm 1 B1 (30 – 50 cm), B2 (50 – 60 cm),
B3 (60 – 70 cm)
WPS2 X 603337 Ultisol Alta Floresta Never Fruit tree A1 (0 – 20 cm), A2 (20 – 30 cm),
Y 8904913 Farm 1 wood B1 (30 – 40 cm), B2 (40 – 60 cm),
B3 (60 – 80 cm), B4 (80 – 100 cm)
WPS3 X 0603604 Very leached Alta Floresta Previous Grassland A1 (0 – 20 cm), A2 (20 – 30 cm),
Y 8915192 Podzolic Farm 2 B1 (30 – 40 cm), B2 (40 – 60 cm),
B3 (60 – 80 cm)
WPS4 X 0603649 Ultisol Paranaita Previous Forest A1 (0 – 20 cm), A2 (20 – 30 cm),
Y 8915375 Farm 3 B1 (30 – 40 cm), B2 (40 – 60 cm)
WPS6 X 0561861 Ultilsol Paranaita Never Forest A1 (0 – 20 cm), A2 (20 – 30 cm),
Y 8926179 Farm 4 B1 (30 – 40 cm), B2 (50 – 60 cm),
B3 (60 – 70 cm), B4 (70 – 80 cm), B5 (80 – 90 cm), B6 (200 – 220 cm)
WPS7 X 0561977 Euthrophic Paranaita Never Cocoa wood A1 (0 – 20 cm), A2 (20 – 30 cm),
Y 8926468 Podzolic Farm 4 B1 (30 – 40 cm), B2 (40 – 50 cm),
determination. The TOC procedure described in Strickland and Parsons18 was originally developed for the analysis of suspended
matter, but it was adapted for sediments and soils and has been largely used for this purpose7,19,20. The procedure is based on the chemical
(wet) oxidation of the carbon compounds with a sulfuric-chromic acid solution. The chromium excess is titrated with ammonium ferrous sulfate. The results are given on a dry weight basis.
Total mercury determination was carried out in triplicate wet sediment and soil samples, in order to avoid contamination or losses. The procedure described by Malm et al.21 applies wet leaching with
aqua regia (HCl + HNO3, 1:3) to one gram of wet sediment. The leaching was carried out for one hour at 50 °C in erlenmeyer glass flasks, equipped with special condensers (cold finger). Samples were cooled down to the ambient temperature transferred to 50 mL disposable centrifuge plastic tubes made up to 30 mL and centrifuged at 4000 rpm for 15 min. An aliquot of the supernatant was separated for immediate analysis by cold vapor atomic absorption spectrometry (CVAAS). Stannous chloride was used as reducing agent. The results were calculated on a dry weight basis, correcting the results for moisture. A detection limit (3 × SD) of 30
ng g-1was estimated from ten blank analyses. Quality assurance
was attained by the repeated parallel analysis of soil and sediment certified reference materials (Table 4). Results were always within the ± 10% range in relation to the certified values.
The total mercury determination in fish was performed by cold vapor atomic absorption spectrometry, after acid digestion (1:1 sulfuric+nitric acids, in the presence of 0.1% vanadium pentoxide) of wet samples, followed by potassium permanganate oxidation,
Table 4. Results of quality assurance/quality control of the mer-cury analyses
Hg (ng g-1)
Obtained Certified
BCR 320, river sediment 1,024 ± 6 1,030 ± 160
NRCC - MESS-3, 87 ± 4 91 ± 9
marine sediment
NRCC – TORT-1, 280 ± 20 330 ± 60
Lobster hepatopancreas Table 3. Fish characteristics and concentrations of mercury in the studied farms
Location species Trophic level Weight (kg)* Hg(mg kg-1)*
Farm 2B Trairão (Hoplias lacerdae) Carnivorous 5.5 1.30
Tucunaré (Chichia ocellaris) Carnivorous 0.9 0.30
Tambaqui (Colossoma macropomum) Herbivorous 1.6 0.02
Tambacú (Colossoma macropomum) Herbivorous. 1.9 0.02
Cará (Geophagus brasiliensis) Herbivorous. 0.1 0.09
Farm 3A Trairão (Hoplias lacerdae) Carnivorous. 5.5 1.30
Tucunaré (Chichia ocellaris) Carnivorous 1.1 0.30
Tambaqui (Colossoma macropomum) Herbivorous. 1.6 0.02
Tambacú (Colossoma macropomum) Herbivorous. 1.8 0.03
Farm 2A Traira (Hoplias malabaricus) Carnivorous. 0.2 0.31
Tucunaré (Chichia ocellaris) Carnivorous 1.1 0.22
Farm 4 Traira (Hoplias malabaricus) Carnivorous. 0.2 0.15
Tucunaré (Chichia ocellaris) Carnivorous 1.0 0.14
Tambaqui (Colossoma macropomum) Herbivorous. 1.5 0.07
Tambacú (Colossoma macropomum) Herbivorous. 0.8 0.02
Various Amazonian rivers Piscivorous fishes24 Carnivorous 0.01 – 5.00 (range)
Northern Mato Grosso Fishes from over 250 sampling sites, Herbivorous 0.02 – 3.50 (range) including rivers and reservoirs3 and carnivorous
*Average values
Table 2. Water column characteristics pf the ponds where sediments were collected Fish-farms
2A 2B 3A 3B 4
UTM X 603604 603649 557814 558685 561935
UTM Y 8915192 8915375 8944647 8944791 8926243
Age of the pond (years) 4 4 12 6 10
Surface (m2) 2.000 1.800 70.000 10.000 15.000
Fish production (kg year-1) 1.000 900 35.000 5.000 7.500
Depth (m) 1.70 1.45 2.20 1.70 2.00
O2(mg L-1) 3.59 4.63 1.70 4.63 0.65
Temperature (°C) 31.2 31.6 28.4 31.6 27.7
pH 6.2 7.1 5.9 7.1 6.1
Conductivity (µS) 40 64 27 64 30
Turbidity (NTU) 8.6 4.0 0.2 4.0 0.7
Alcalinity 35 30 25 30 30
Secchi (m) 0.75 1.40 1.55 1.40 45
as described in Campos and Curtius22. Analytical quality was assured
by a strict blank control (detection limits = 0,007 mg kg-1), duplicate
analysis and the analysis of adequate certified reference materials (Table 4).
RESULTS AND DISCUSSION Sediments and fish
Figures 2 and 3 show the behaviour of TOC and mercury in the sediment profiles from the sampled ponds. In order to understand the behaviour of these parameters, it is necessary to consider that in fish ponds, chemical and physical managements are necessary to reach or keep the conditions as suitable as possible for a faster fish growth. Therefore, pond liming is frequent, once organic matter decay makes the already low water pH even more acidic. The intensive introduction of fish food and the overpopulation of the ponds are factors that also affect their characteristics. These factors should respond for the observed TOC profiles, as shown in Figure 2. According to its owner little management was carried out in farm 2, fish population was reduced and growth was consequently slow. Accordingly, TOC concentrations in these ponds where found to be the lowest. On the other hand, in farm 3, due to attempts for increasing productivity, significantly more fish food was introduced into the system and the ponds were clearly overpopulated. In pond 4, the owner complained that dissolved oxygen concentrations were extremely low (Table 2), imparing fish growth. In situ measurements carried out early in the morning, showed values as low as 0.65 mg L-1. Thus, the larger TOC concentrations observed may be due to
organic matter preservation associated with the reported low dissolved oxygen concentration.
Considering this intensive modification of the sediment characteristics associated to the present activity, it would not be surprising that the influence of previous gold mining activity would be now unnoticeable. Nevertheless, one of the farm ponds that registered past gold mining activity presented the highest Hg concentrations in sediments (up to 300 ng g-1, Figure 3). The other
sampling sites presented values below 100 ng g-1, usually found at
uncontaminated or only slightly contaminated areas (background concentrations are not available for this region). Ponds in farm 2 and pond 3A, flooded in areas also subjected to past gold mining activity did not present abnormal concentrations. Thus, the increased Hg concentrations observed in pond 3B can not be unequivocally associated to gold mining. Other geochemical factors such as complexation with organic matter should also be responsible for the observed enrichment. Although comparison with other works in the Amazonian environment is meaningless, due to the variability of conditions, the present results were quite similar to those observed by Lechler et al.23, who also observed a variation in the Madeira
River sediments between 100 and 300 ng g-1. On the other hand,
Gonçalves et al.24 observed considerably higher concentrations (up
to 2 mg kg-1) in the Vila Nova River (State of Acre), where gold
mining was more intense.
The mercury concentrations in fishes from the investigated ponds, as shown in Table 3 are within the range observed in the literature3,25. The concentrations of this metal seem to be rather
Figure 3. Total mercury concentrations in the sediment profiles of the studied fish ponds
controlled by trophic factors. The carnivorous fishes Trairão, Traira and Tucunaré presented the highest concentrations no matter the location. Although its highest mercury concentration in sediments, farm 3 fishes do not seem to be biomagnifying this contaminant from the environment. Actually, the low environmental transfer rates observed were expected since grown fishes are fed with ration that probably does not contain large amounts of mercury. The very high mercury concentrations observed in the Trairão are probably associated with the large size of the animals and its high position in the trophic chain.
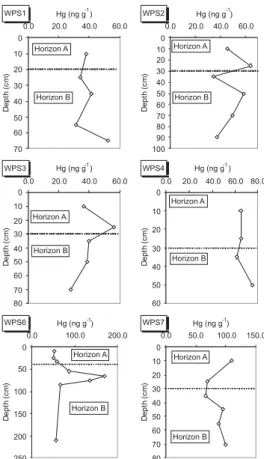
Soils
From the TOC soil profiles displayed in Figure 4, it can be drawn that organic matter is frequently enriched at the surface horizons. This should indicate a persistent and intensive source of organic matter for the soil surface (leaves and roots), but can also point out to a fast degradation within deeper layers in the soil. It could be observed in loco that the soils did not present any O horizon, indicating that leaching in the region must be significant, affecting mercury accumulation in the soils. Some authors established that mercury should accumulate in the B horizon, associated with iron oxides9. The results presented in Figure 5 do not confirm this
behavior (only profile WPS6 presents a noticeable enrichment at
the B horizon), probably due to the leaching effect. On the other hand, mercury seems not to be controlled by TOC concentrations as demonstrated by the observed low correlation coefficient between these two variables (r = -0.20; p < 0,05).
The Hg concentrations observed in the present work are considerably lower than those observed by Roulet et al.9, Lechler
et al.23 and Fadini et al.11, who considered concentrations up to 300
ng g-1 as natural for the region. On the other hand Lacerda et al.26
measured mercury concentrations in 30 superficial soil samples in Alta Floresta region and found concentrations ranging from 15 to 275 ng g-1, associating variations to present and previous gold mining
atmospheric inputs. Even though Lacerda et al.26 did not checked
for the type of soil they were working on, neither for the mercury distribution within the soil column, it seems clear that their results indicate that the Alta Floresta soils top layers have low background values. Since in the work of Lacerda et al.26 deeper soil profiles
were not studied, they could not state that there was leaching in A horizon and accumulation in B horizon, as the above authors observed. Nevertheless, in the present work, the absence of soil enrichment in Alta Floresta soil profiles is confirmed by the results presented in Figure 5.
CONCLUSIONS
The fish ponds sediments in the studied area tend to have their chemical characteristics controlled rather by the management procedures (liming for instance) than by the historic utilization of the pond or neighboring soil characteristics. Mercury concentrations, respond to these management procedures. It is nonetheless possible that when the loads of mercury are exceedingly high, this contamination can also be observed in the sediment. Although the slight increase in concentrations observed in pond 3B should be an Figure 4. Total organic carbon (TOC) concentrations in soil profiles of the
studied area
example, further studies must be carried out to confirm this behavior. It is interesting to note that liming was considered as a methylation suppressor27 and therefore, a significant reduction in trophic chain
biomagnification should be expected in intensively limed fish ponds. Furthermore, grown fishes are fed with ration, therefore absorbing very little mercury from the environment. Thus, fish concentrations in the ponds did not respond to environmental levels, but seem to be controlled by the trophic characteristics.
The distribution of Hg in the soil profiles did not confirm any leaching process leading to the subsequent enrichment of the B horizon. On the other hand, association of mercury with the A horizon organic matter could not be identified, showing that both of these geochemical agents do not control mercury concentrations within the soil profiles. Soils presented lower concentrations when compared to the results obtained by other authors in the Amazonian environment. The soil Hg contents found in the present work do not support any evidence of a natural mercury geological enrichment of Amazonian soils. Thus, it can be stated that the larger concentrations reported in the literature may not be widespread throughout the Amazonian environment and a screening program for mercury concentrations in soils is still necessary before any generalization.
ACKNOWLEDGEMENTS
The authors are thankful for the Brazilian Ministry of Health (VIGISUS programme) which provided financial support for this work. It is also necessary to thank all the fish farmers for allowing sampling and for their support in the field procedures.
REFERENCES
1. Wasserman, J. C.; Hacon, S.; Wasserman, M. A.; Ambio2003,32, 336. 2. Instituto Brasileiro de Geografia e Estatística; IBGE - Centro de
Documentação e Disseminação de Informações: Rio de Janeiro, 2000, pp CD.
3. Hacon, S.; Farias, R. A.; Campos, R. C.; Argento, R. R.; Caires, S. M.; Rossi, A. P.; Valente, J.; Tobar, S.; Wasserman, J. C.; Environ. Sci.2003,10, 121.
4. Hacon, S.; Farias, R. A.; Argento, R. R.; Campos, R. C.; Rossi, A. P.; Wasserman, J. C.; J. Phys. IV2003,107, 357.
5. Mallas, J.; Benedito, N.; Ambio1986,15, 248.
6. Cleary, D.; Thornton, I.; Brown, N.; Karantzis, G.; Delves, T.; Worthington, S.;Nature1994,369, 613.
7. Lacerda, L. D.; Nature1995,374, 20.
8. Nriagu, J. O.; Proceedings of the International Symposium on Environmental Geoqchemistry in the Tropical Countries, Niterói, Brasil, 1993.
9. Roulet, M.; Lucotte, M.; Saint-Aubin, A.; Tran, S.; Rheault, I.; Farella, N.; Da Silva, E. D.; Dezencourt, J.; Passos, C. J. S.; Soares, G. S.; Guimaraes, J. R. D.; Mergler, D.; Amorim, M.; Sci. Total Environ.1998,223, 1.
10. Roulet, M.; Lucotte, M.; Rheault, I.; Tran, S.; Farella, N.; Canuel, R.; Mergler, D.; Amorim, M.; IV International Conference on the Geochemistry of the Earth’s Surface, Ilkley, Yorkshire, England, 1996.
11. Fadini, P. S.; Jardim, W. F.; Sci. Total Environ.2001,275, 71.
12. Valle, C. M.; Santana, G.; Augusti, R.; Egreja-Filho, F. B.; C.Windmöller, C.; Chemosphere2005,58, 779.
13. Aula, I.; Braunschweiler, H.; Leino, T.; Malin, I.; Porvari, P.; Hatanaka, T.; Lodenius, M.; Juras, A. In Mercury Pollution: Integration and Synthesis; Watras, C. J.; Huckabee, J. W., eds.; Lewis Publishers: Boca Raton, 1994, p. 21.
14. Bidone, E. D.; Castilhos, Z. C.; Cid de Souza, T. M.; Lacerda, L. D.; B. Environ. Contam. Toxicol.1997,59, 194.
15. Roulet, M.; Lucotte, M.; Water, Air, Soil Pollut.1995,80, 1079.
16. Barbosa, R. C. M.; Neves, A. D. S.; Comissão Executiva do Plano da Lavoura Cacaueira, Ministério da Agricultura: Belém, Pará, 1985, p. 30.
17. Amouroux, D.; Wasserman, J. C.; Tessier, E.; Donard, O. F. X.; Environ. Sci. Technol.1999,33, 3044.
18. Strickland, J. D. H.; Parsons, T. R.; A Practical Handbook of Seawater Analysis, Fisheries Research Board of Canada: Ottawa, 1972.
19. Martinotti, W.; Camusso, M.; Guzzi, L.; Patrolecco, L.; Pettine, M.; Water, Air, Soil Pollut.1997,99, 325.
20. Relexans, J.; Lin, R.; Castel, J.; Etcheber, H.; Laborde, P.; Oceanologica Acta
1992,15, 639.
21. Malm, O.; Pfeiffer, W. C.; Bastos, W. R.; Souza, C. M. M.; Ci. Cult. J. Braz. Ass. Adv. Sci1989,41, 88.
22. Campos, R. C.; Curtius, A. J.; Seminario Nacional de Riscos e Consequências do Uso do Mercúrio, Brasília, Brasil, 1990.
23. Lechler, P. J.; Miller, J. R.; Lacerda, L. D.; Vinson, D.; Bozongo, J.-C.; Lyons, W. B.; Warwick, J. J.; Sci. Total Environ.2000,260, 87.
24. Goncalves, C.; Favaro, D. I. T.; Melfi, A. J.; de Oliveira, S. M. B.; Vasconcellos, M. B. A.; Fostier, A. H.; Guimaraes, J. R. D.; Boulet, R.; Forti, M. C.; J. Radioanal. Nucl. Chem.2000,243, 789.
25. Malm, O.; Environ. Res.1998,77-section A, 73.