Journal of Public Health
Universidade de São Paulo
Faculdade de Saúde Pública
VOLUME 34
NÚMERO 6
D EZEM BRO 2000
Revista de Saúde Pública
p. 623-30
The role of discriminant analysis in the
refinement of customer satisfaction
assessment
Papel da análise discriminante no
aprimoramento da avaliação da satisfação dos
usuários
BD Verdessia, G Jaraa, R Fuentesa, JC Gonzaleza, F Espejoa and AC de Azevedob
aSan Antonio Regional Health Service, Valparaíso, Chile. bHealth Services Development of PAHO/ WHO Representation. Santiago, Chile
VERDESSIa BD, G Jaraa, R Fuentesa, JC Gonzaleza, F Espejoa and AC de Azevedob The role of discriminant analysis
in the refinement of customer satisfaction assessment Rev. Saúde Pública, 34 (6): 623-30, 2000 www.fsp.usp.br/
623 623 623 623 623 Rev Saúde Pública 2000;34(6):623-30
w w w.f sp.usp.br/rsp
The role of discriminant analysis in the
refinement of customer satisfaction
assessment*
Papel da análise discriminante no
aprimoramento da avaliação da satisfação dos
usuários
BD Verdessia, G Jaraa, R Fuentesa, JC Gonzaleza, F Espejoa and AC de Azevedob
aSan Antonio Regional Health Service, Valparaíso, Chile. bHealth Services Development of PAHO/ WHO Representation. Santiago, Chile
Correspondence to: Antonio Carlos de Azevedo Marcelo T. de Alvear, 684 4o piso 1395 Buenos Aires, Argentina E-mail: [email protected]
*Paper presented at the XV Assembly of the International Society for Quality Assurance in Health Care – ISQua. Budapest, 1998.
Submitted on 12/11/1999. Reviewed on 27/7/2000. Approved on 5/10/2000.
Abstract
Objective
To test discriminant analysis as a method of turning the information of a routine customer satisfaction survey (CSS) into a more accurate decision-making tool.
Methods
A 7-question, 10-multiple choice, self-applied questionnaire was used to study a sample of patients seen in two outpatient care units in Valparaíso, Chile, one of primary care (n=100) and the other of secondary care (n=249). Two cutting points were considered in the dependent variable (final satisfaction score): satisfied versus unsatisfied, and very satisfied versus all others. Results were compared with empirical measures (proportion of satisfied individuals, proportion of unsatisfied individuals and size of the median).
Results
The response rate was very high, over 97.0% in both units. A new variable, medical attention, was revealed, as explaining satisfaction at the primary care unit. The proportion of the total variability explained by the model was very high (over 99.4%) in both units, when comparing satisfied with unsatisfied customers. In the analysis of very satisfied versus all other customers, significant relationship was identified only in the case of the primary care unit, which explained a small proportion of the variability (41.9%).
Conclusions
Discriminant analysis identified relationships not revealed by the previous analysis. It provided information about the proportion of the variability explained by the model. It identified non-significant relationships suggested by empirical analysis (e.g. the case of the relation very satisfied versus others in the secondary care unit). It measured the contribution of each independent variable to the explanation of the variation of the dependent one.
Resumo
Objetivo
Testar a análise discriminante como um método de transformar a informação obtida num inquérito de satisfação dos usuários de rotina numa acurada ferramenta de tomada de decisão.
Keywords
Discriminant analysis#. Customer satisfaction#. Patient satisfaction#. Total quality management#. Quality assurance in health care#. Quality assurance health care#. Quality control. Quality of health care.
D escritores
624 624624 624
624 Rev Saúde Pública 2000;34(6):623-30
w w w.f sp.usp.br/rsp Discriminant analysis and customers‘ satisfaction
Verdessi BD et al.
IN TRO D U CTIO N
In Chile, as in other countries, there is a great need for reliable customer satisfaction measures. Customer Satisfaction Analysis (CSA) is one of the four national priorities, which has been established since 1994.21
Satisfaction surveys are the most common method for CSA. The tradition of its use came from other services activities like banks and especially hotels. Thus, in the majority of the health services, where these instruments are used, a direct empirical inference between a series of variables is assessed and a final score of satisfaction with the service is given. One of the main problems after obtaining results from surveys is to turn these data into more accurate decision-making information. Es-pecially in the very frequent case, when the levels of satisfaction are high, managers look for an instrument, which allows them to decide about the changes needed to improve further customer’s satisfaction. Multivariate analysis allows studying the precise relationships be-tween the component variables of the survey. Discri-minant analysis (DA), as one of the multivariate analy-sis techniques, allows a precise measurement of the variability proportion explained by the model adopted. Besides, it reveals the weight of each variable in the explanation of the values assumed by the dependent variable. Furthermore, this technique permits to cut the scale of the dependent variable used at different points allowing the study, for example, of the determinants of “very satisfied” customers versus all others and, at an-other moment, simply discriminate between “satisfied”
versus “unsatisfied” ones. For this reason, DA is
pre-Métodos
Utilizou-se questionário auto-aplicável com sete questões de dez opções numa amostra dos pacientes atendidos em duas unidades ambulatórias públicas, em Valparaíso, Chile, sendo uma de cuidados primários (n=100) e a outra de atenção secundária (n=249). Utilizaram-se dois pontos de corte na variável dependente (índice final de satisfação): satisfeitos vs insatisfeitos e muito satisfeitos vs os demais. Os resultados foram comparados com medidas empíricas habitualmente utilizadas (proporção de satisfeitos, proporção de insatisfeitos e dimensão da mediana). Resultados
O nível de resposta foi muito elevado (sempre acima de 97,0%). Uma variável adicional revelou-se (atendimento médico), explicando a satisfação com o atendimento na unidade primária. Ao comparar satisfeitos com insatisfeitos, a proporção total da variabilidade explicada pelo modelo foi muito elevada (acima de 99,4%) em ambas unidades. Ao comparar muito satisfeitos com os demais, observou-se relação significativa apenas no caso da unidade primária. Explicou-se uma baixa proporção da variabilidade (41,9%).
Conclusões
A análise discriminante revelou relações não percebidas pela análise empírica e indicou a proporção exata da variabilidade explicada pelo modelo utilizado. A técnica afastou como não significativas relações sugeridas pela análise empírica (por exemplo, muito satisfeitos versus os demais no caso da unidade secundária). A técnica permitiu medir a intensidade da contribuição de cada variável na explicação da variação da satisfação.
sented in this paper as an instrument to deepen the meaning and usefulness of CSA surveys.
The objective is to test discriminant analysis as a method for turning the information of a routine CSA survey into a more accurate decision-making tool.
M ETH O D S
The questions of the present survey evaluated nurs-ing care (Nursnurs-ing), physician care (Physician), phar-macy attention (Pharphar-macy), appointment conditions (Appointment), register attention (Registry) and con-tinuity of care (Concon-tinuity) as independent variables and the overall perceived quality of the attention as the dependent variable (Final) (Figure 1). A ten-point, Likert-type scale was used to quantify each variable as perceived by the customers. Two different discri-minant analysis equations were constructed. The first one was applied to discriminate between “very satis-fied” (values 9 and 10) and all other perceptions of the dependent variable. The second one was used to discriminate between “satisfied” and “unsatisfied” customers (values 5 or less versus all other choices). The statistical package used was SPSS 7.5 for Win-dows PC format.
625 625 625 625 625 Rev Saúde Pública 2000;34(6):623-30
w w w.f sp.usp.br/rsp
Discriminant analysis and customers‘ satisfaction
Verdessi BD et al.
n=249). The surveys were applied each Tuesday and Thursday to 10% of the patients attending the facili-ties. Data were analyzed searching for the increasing degree of significance of the statistics employed until these values stabilized at a given value, when the sam-ple was considered comsam-plete.
The results of DA were compared with three em-pirical measures, namely: the independent variables with the highest proportion of unsatisfaction, the ones with smaller proportion of satisfaction and those with smaller median.
The discriminant analysis statistics used:
• Wilk’s Lambda: as a proxy of the proportion of the unexplained variability;
• Chi-square of Wilk’s Lambda distribution and respective significance “p”: measuring the significance of the mentioned relationship; • Discriminant Function Coefficient Scores: as a
measure of the individual contribution of each independent variable to the total variation of the final score.
The choice of relevant topics for analysis was made through the analysis of the literature and selection of those topics accepted as meaningful by previous ex-perience with CSA surveys in VRHS. This was the criterion for content validity. Face validity was as-sured by interviews with a secondary sample (10%) of the patients surveyed, showing their understand-ing of the questions proposed. Construct validity was accessed through the Wilk’s Lambda statistic value and its significance. A one-week-later telephone in-terview with 10% of the patients surveyed was per-formed to assure reliability.
RESU LTS
Response rate was very high (97.0% in the case of the primary care unit and 98.4% in the case of the secondary care unit).
Content, face validity and reliability were assured through the previously mentioned methods.
In the study of the primary care unit (“Consultorio Plaza Justicia”), DA added the variable Physician (medical attention) to the empirical analysis as rel-evant both to discrimination between very satisfied and other patients, and also between satisfied and unsatisfied patients (Figure 2). Both functions were found significant (p<0.05) and, through the Wilk’s Lambda statistics, a very high proportion of variabil-ity was explained by the equation (99.4%) in the case of satisfied versus non-satisfied. A much smaller pro-portion (41.9%) of variation was explained in the case of very satisfied versus other patients (Figure 2).
As to the secondary care unit (“Consultorio del Adulto”), the analysis revealed that the discriminant function for very satisfied versus other was found non-significant (p=0.58), but in relation to satisfied versus unsatisfied patients, the relationship was very signifi-cant (p=0.002) and practically explained all the vari-ability (more than 99.9%). Only a negligible propor-tion (6.8%) of the variability was explained when com-paring very satisfied with others. These variables were not different from those suggested by the empirical methods (appointment conditions, pharmaceutical at-tention and nursing care) although the order of their participation (measured through the discriminant func-tion coefficient scores) changed, thus enhancing the importance of the appointment conditions (Figure 3).
D ISCU SSIO N
Customer satisfaction assessment is a relatively new concern for the health care industry. The interest in this aspect of the care increased considerably in the mid-eighties as part of the “quality wave”. This wave covered the healthcare services industry after having a strong impact upon other industries, initially in the US, but soon after all over the world.1 The
consolida-tion of customer satisfacconsolida-tion analysis as a routine prac-tice was influenced by its incorporation as quite a rel-evant component (300 of 1,000 points) in the Malcolm Balbridge Award12 procedures and in the standards of
the Joint Commission for Accreditation of Health Care Organizations (JCAHCO).6
When dealing with this subject, a question arises: what for? This issue is extensively discussed in the specific literature.34,36 Several authors argue that, if
there are plenty of suggestions, there is no estab-lished evidence that patient satisfaction influence the technical aspects of quality through improvement in the compliance with treatment, for example. The ma-jority of the authors agree, however, that patient sat-isfaction is definitely a self-standing outcome of care.7,32 Although it is a frequent statement that the
theoretical foundations of satisfaction in health care
Independent
1. Appointment: conditions of the appointment 2. Registry: conditions of the registration 3. Nursing care: nursing attention 4. Physician’s care: medical attention 5. Continuity: continuity of care 6. Pharmacy: pharmaceutical attention
Dependent
7. Final: final score of care
626 626626 626
626 Rev Saúde Pública 2000;34(6):623-30
w w w.f sp.usp.br/rsp Discriminant analysis and customers‘ satisfaction
Verdessi BD et al.
Idependent variables explaining disatisfaction
“ Common Sense” Discriminant
(A) (B) (C) (D) (E)
Registry 15% Pharmacy 44 Pharmacy 8.0 (Not signif.) Appointm. 10.9
Registry 5.2 Registry 57 Appointm. 9.0 Pharmacy 8.9
Nurs. care 3.6 Appointm. 62 Registry 9.0 Physician 3.37
Nurs. care 5.9
(A) Greater proportion of disatisfaction (score=/ <3) (B) Smaller proportion of satisfaction (score=9&10) (C) Smaller median
(D) Discrim. Function Coef. Scores 9&10 X other (Chi-sq 12.19;p=.058) Wilks’ λ:. 932 (E) Discrim. Function Coef.=<5 X other (Chi-sq 40.47;p=.002) Wilks’ λ:. 000
Idependent variables explaining disatisfaction (stepwise analysis)
“ Common Sense Discriminant
(A) (B) (C) (D) (E)
Pharmacy 15% Pharmacy 44 Pharmacy 8.0 Pharmacy 1.0 Appointm. 5.46
Registry 5.2 Registry 57 Appointm. 9.0 Pharmacy 4.45
Nurs. care 3.6 Appointm. 62 Registry 9.0 Physician 3.37
Nurs. care 3.02
(A) Greater proportion of disatisfaction (score=/ <3) (B) Smaller proportion of satisfaction (score=9&10) (C) Smaller median
(D) Discrim. Function Coef. Scores 9&10 X other (Chi-sq 8.559;p=.03) Wilks’ l:. 952 (E) Discrim. Function Coef.=<5 X other (Chi-sq 36.77;p=.000) Wilks’ λ:. 001
Figure 3 - Results: secondary care unit (Cons. del Adulto – n=249)
Independent variables explaining disatisfaction
“ Common sense” Discriminant
(A) (B) (C) (D) (E)
Registry 21% Registry 22 Registry 6.0 Registry 0.646 Physician 12,089
Continuity 7 Nurs. Care 35 Appointm. 8.0 Appointm 0.607 Continuity 10,461
Pharmacy 4 Appointm. 46 Continuity 9.0 Physician 0.468 Pharmacy 9,256
(A) Greater proportin of disatisfaction (score=/<3) (B) Smaller proportion of satisfaction (score= 9&10) (C) Smaller median
(D) Discrim. Function Coef. Scores 9&10 X other (Chi-sq 26.049;p=.000)Wilks’ λ:.581 (E) Discrim. Funtion Coef.=<5 X other (Chi-sq. 15.485;p=.Wilks’ λ:.006
Independent variables explaining disatisfaction (stepwise analysis)
“ Common Sense” Discriminant
(A) (B) (C) (D) (E)
Registry 21% Registry 22 Registry 6.0 Registry 0.944 No variables
continuity 7 Nurs. Care 35 Appointm. 8.0 Contin. 0.625 qualified for analysis
Pharmacy 4 Appointm. 46 Continuity 9.0
(A) Greater proportion of disatisfaction (score=/ <3) (B) Smaller proportion of satisfaction (score=9&10) (C) Smaller median
(D) Discrim. Function Coef. Scores 9&10 X other (Chi-sq 20,575;p=.000) Wilks’ λ:. 581 (E) Discrim. Function Coef.=<5 X other (No variables qualified for analysis)
627 627 627 627 627 Rev Saúde Pública 2000;34(6):623-30
w w w.f sp.usp.br/rsp
Discriminant analysis and customers‘ satisfaction
Verdessi BD et al.
are weak,26 there is a series of papers discussing
them.3,5,10,1319,22,32 It is commonly observed that the
levels of satisfaction expressed are generally rather high, simply endorsing in many cases the status quo.9,16,18,23 In some studies, the situation of being
older or sicker is associated with a so-called “acqui-escent response bias”.23 Other studies, on the other
hand, demonstrate a dissociation of gender and age as factors correlated to consistently positive answers. The present study tries to demonstrate that even when a very strong positive (satisfied) answer is observed, it is possible to get decisive information from the survey data, using DA.
Some reviews of the literature recommend the fol-lowing as basic conditions for a good customer sat-isfaction survey: clear definition of goals; assess-ment of different aspects of care; sub-scales corre-spondent to these aspects; tests of reliability and validity; and application feasibility to large populations.10 Other studies23 point out that an
ad-equate survey should at least measure the access to health care and its availability, the technical quality of the services, interpersonal relationships, financial aspects, and communication.
In an extensive series of instruments studied,2-4,15,23
the rate of response is often mentioned as a methodo-logical hindrance. This parameter varied extensively (from 27% to 96% in a series of revisions).9,10,27-29,35 It
is by and large accepted that the degree of response compatible with valid surveys should be over 80%.27
As previously mentioned, the study had a high re-sponse rate (always over 95%). Another aspect con-sidered weak in many satisfaction surveys is the va-lidity2,3,7,14,24,28 and reliability analysis.2,3,14,23,28 Some
authors suggest that validity should be examined in terms of face, content, discriminant and construct validity;28 others comment that face and construct
validity are more feasible and relevant to this type of study.14,25 In this study, content, face and construct
validity were analyzed and found to be quite satisfac-tory (data available from the authors).
A second type of concern involves methodological issues, reliability and applicability of the studies. From this viewpoint, some authors consider the existence of a validity/applicability trade-off. Choosing labo-ratory-like research conditions can signify working in non-routine-like situations, which has an impact in their applicability.8 Trying to balance scientific rigor
with everyday usefulness represents one of the big-gest challenges of the satisfaction surveys. This is precisely one of the aspects emphasized in the study. The selective use of a conceptually elaborated tool as DA can render it applicable even in routine working
conditions in a developing country. Thus, one of the basic goals of this research is to overcome this valid-ity/applicability trade-off.
Multicolinearity30 has been pointed out as a factor
of validity impairment of CSA studies. The present study also suggests the DA as a practical answer to this hindrance due to the fact that the construction of the statistics under this technique involves the clear-ance for colinearity between the variables studied.
The rotating, cumulative sample used in this study is a convenient tool in dimensioning the sample in everyday working conditions. This prevents the ex-cessive effort and cost of overdimensioning it or, in an insufficiently dimensioned one, with the respec-tive loss of significance.
Studies found in the literature indicate that the main variables most often associated with satisfaction were nursing care, quality of meals, physical conditions and, in a much less preeminence, medical activity.32
Al-though expressing a high degree of satisfaction, this suggests that this last variable can be discriminant in some situations. For example, when a small propor-tion of unsatisfied patients has a significant impact in the overall care satisfaction such as it was observed in the case of the primary care unit.
628 628628 628
628 Rev Saúde Pública 2000;34(6):623-30
w w w.f sp.usp.br/rsp Discriminant analysis and customers‘ satisfaction
Verdessi BD et al.
DA added important information also in the case of the secondary care unit. In this case, the set of variables used wasn’t able to assess the difference between very satisfied versus all other patients. Nonetheless, it was effective to discriminate between satisfied and unsatis-fied patients (more than 99.9% of the variability ex-plained), which was a strong feedback on the adequacy of the set of variables chosen, unless there was interest in discriminating very satisfied patients from all the other.
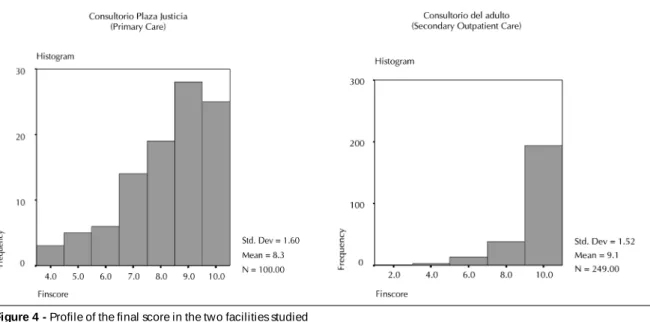
The reason for the impossibility in (significantly) discriminating between very satisfied and all others in the case of the secondary care unit can be traced to the intense skewness of the distribution of the final satis-faction score (Final) regarding very satisfied patients. The same reason may point to the cause of the low proportion of variation explained in similar circum-stances in the case of the primary care unit (Figure 4).
This study shows quite clearly how DA can give support to the choice of independent variables used in the CSA survey. It can adequately limit the exten-sion of the inferences (in a very different way from when empirical inferences were used only). Finally, it can point out through the discriminant function co-efficient scores to the more relevant independent vari-ables amenable to change when the managers are com-mitted with improving customer satisfaction levels.
Multivariate analysis, in general,3,10,17 and
discrimi-nant analysis,5,20 specifically, have been used as
to-ols to identifying the factors of customer satisfac-tion. The question is often raised on how to use these methodologically more elaborated instruments in everyday practice of CSA.
Short self-administered instruments, such as the one used in the study, have been associated with comparatively better degrees of response and es-pecially indicated when older and poorer populations are studied.11,25,31
At the VRHS a set of instruments both qualita-tive and quantitaqualita-tive have been applied to deal with the different situations of CSA (long surveys, short surveys, focus groups, active listening interviews and discussion groups using speech analysis).* The quantitative method of choice has been the short (7 to 10 question, 5 to 10 multiple choices), self-ap-plied questionnaire. As mentioned before, a study performed at VRHS was presented at the 12th ISQua
Conference demonstrating that this instrument pro-vided similar results in terms of overall satisfac-tion assessment as a more complex, professionally applied instrument.33
DA demonstrated to be a valuable tool to comple-ment validation, to control for multicolinearity, and to point out factors explaining global satisfaction, which could give guidance to immediate decision. After considering a few basic conditions, applica-tion is easy and non-valid explaining variables can be readily identified and ruled out. For these rea-sons, this technique can be an adequate tool in solv-ing the conflict between validity and feasibility, which concerns both researchers and health care managers. It seems to add considerable value to pa-tient satisfaction surveys, as it improves the ability of this type of instrument of identifying and dimensioning the importance of the variables effec-tively associated with overall care satisfaction.
*Fuentes RG, Verdessi DB, Gonzalez JC, Jara G, de Azevedo AC, Espejo F. Instruments for customer satisfaction assessment in a regional health service in Chile. A proposal for an algorithm of use. [presented to publication at the International Journal for Quality in Health Care, 1999]
629 629 629 629 629 Rev Saúde Pública 2000;34(6):623-30
w w w.f sp.usp.br/rsp
Discriminant analysis and customers‘ satisfaction
Verdessi BD et al.
REFEREN CES
1. Azevedo AC de. Dimensiones de la gestión de calidad en los servicios de salud. Rev Adm Salud (Chile) 1994;6(23):3-10.
2. Bamford C, Jacoby A. Development of patient satisfaction questionnaires. I. Methodological issues. Qual Health Care 1992;1:153-7.
3. Campen C, Sixma H, Friele RD, Kerssens JJ, Peters L. Quality of care and patient satisfaction: a review of measuring instruments. Med Care Res Rev 1995;52:109-33.
4. Cockburn J, Pit S. Prescribing behaviour in clinical practice: patients´expectatioins and doctors´ perceptions of patients´expectations — a questionnaire study. BMJ 1997;315:520-3.
5. Dansky K, Brannon D. Discriminant analysis: a technique for adding value to patient satisfaction surveys. Hosp Health Serv Adm 1996;41:503-13.
6. Davis SL, Adams-Greenly M. Integrating patient satisfaction with a quality improvement program. J Nurs Adm 1994;24(12):28-31.
7. Donabedian A. Quality assurance in health care: customers´role. Qual Health Care 1992;1:247-51.
8. Drummond MF, O´Brien, Stoddart GL, Torrance GW.
Methods for the economic evaluation of health care programmes. Oxford: Oxford Medical Publications; 1998. Chapter 8: Collection and analysis of data. 8.1.1. Efectiveness data: bias, precision and relevance.
9. Ehnfors M, Smedby B. Patient satisfaction survey subsequent to hospital care: problems of sampling, non-response and other losses. Qual Assur Health Care 1993;5:19-32.
10. Etter JF, Perneger TV, Rougemont, A. Does sponsorship matter in patient satisfaction surveys? A randomized trial. Med Care 1996;34:327-35.
11. Fitzpatrick R. Surveys of patient satisfaction: I -Important general considerations. BMJ 1991;302:887-9.
12. Ford RC, Fach SA, Fotter MD. Methods of measuring patient satisfaction in health care organizations. Health Care Manage Rev 1997;22(2):74-89.
13. Hacquebord H. Health care from the perspective of a patient: theories for improvement. Qual Manage Health Care 1994;2(2):68-75.
14. Haddad S, Fournier P, Potvin L. Measuring lay people´s perceptions of the quality of primary health care services in developing countries. Validation of a 20-item scale. Int J Qual Health Care 1998;10(2):93-104.
15. Hall MF, Press I. Keys to patient satisfaction in emergency department: results of a multiple facility study. Hosp Health Serv Adm 1996;41:515-32.
16. Halpern J. The measurement of quality of care in the veterans health administration. Med Care 1996;34(3 Suppl):MS55-MS68.
17. Joos SK, Hickam DH, Borders LA. Patients desires and satisfaction in general medicine clinics. Public Health Rep 1993;108:751-9.
18 Kasalova H, Farmer RG, Roithova Z, Marx D.
Development of patient satisfaction surveys in the czech republic: a new approach to an old theme. Int J Qual Health Care 1994;6:383-8.
19. King B. Techniques for understanding the customer. Qual Manage Health Care 1994;2(2):61-7.
20. Kurata JH, Watanabe Y, McBride C, Kaway K, Andersen R. A comparative study of patient satisfaction with health care in Japan and the United States. Soc Sci Med 1994;39:1069-76.
21. Ministry of Health, Chile. Health situation in Chile. Ch. III. Outline and main objectives of the sector for 1997. Santiago; 1997. p. 31-2.
22. Nelson EC. Developing a patient measurement system for the future: an interview. J Qual Improv (JCAHCO) 1993;19:368-73.
23. Ross CK, Steward CA, Sinacore JM. A comparative study of seven measures of patient satisfaction. Med Care 1995;33:392-406.
24. Rubin HR. Patient evaluations of hospital care: a review of the literature. Med Care 1990;28(9 Suppl):S3-S9.
25. Rubin H R, Ware JE, H ays RD . The PJH Q questionnaire. Exploratory factor analysis and empirical scale construction. M ed Care 1990;28(9 Suppl):S22-S9.
26. Scott A, Smith RD. Keeping the customer satisfied: issues in the interpretation and use of patient satisfaction surveys. Int J Qual Health Care 1994;6:353-9.
27. Sitzia J, Wood N. Response rate in patient satisfaction research: an analysis of 210 published studies. Int J Qual Health Care 1998;10:311-7.
28. Smith C. Validation of a patient satisfaction system in the united kingdon. Qual Assur Health Care 1992;4:171-7.
29. Steven ID. Patient satisfaction questionnaire as a teaching and comparative audit tool. Qual Assur Health Care 1991;3:41-9.
30. Stratmann WC, Zastowny TR, Bayer LR, Adams EH, Black GS, Fry PA. Patient satisfaction surveys and multicollinearity. Qual Assur Health Care 1994;2(2):1-12.
31. Stump TE, Dexter PR, Tierney WM, Wolinsky FD. Measuring patient satisfactioin with physicians among older and diseased adults in a primary care minicipal outpatient setting: an examination of three instruments. Med Care 1995;33:958-72.
630 630630 630
630 Rev Saúde Pública 2000;34(6):623-30
w w w.f sp.usp.br/rsp Discriminant analysis and customers‘ satisfaction
Verdessi BD et al.
33. Verdessi DB, Fuentes RG, MacCall P, Saroma N, Azevedo AC de. Patient satisfaction accessment comparison of two instruments in a public regional health service in Chile. In: 12st ISQua International Conference; 1996; Jerusalem. p. 235.
34. Vuori H. Patient satisfaction. Does it matter? Qual Assur Health Care 1991;3:183-9.
35. Wensing M, Grol R, Smits A. Quality judgements by patients on general practice care: a literature analysis. Soc Sci Med 1994;38:45-53.