Viviane Gabriela Nascimento SimonI
José Maria Pacheco de SouzaII
Sonia Buongermino de SouzaIII
I Programa de Pós-Doutorado em Saúde Pública. Departamento de Saúde Materno-Infantil. Faculdade de Saúde Pública. Universidade de São Paulo. São Paulo, SP, Brasil
II Departamento de Epidemiologia. Faculdade de Saúde Pública. Universidade de São Paulo. São Paulo, SP, Brasil III Departamento de Nutrição.
Faculdade de Saúde Pública. Universidade de São Paulo. São Paulo, SP, Brasil Correspondence:
Sonia Buongermino de Souza Faculdade de Saúde Pública Universidade de São Paulo Av. Dr. Arnaldo, 715 01246-904 São Paulo,SP, Brasil E-mail: [email protected] Received: 10/9/2007 Revised: 5/29/2008 Approved: 7/2/2008
Breastfeeding, complementary
feeding, overweight and obesity
in pre-school children
ABSTRACT
OBJECTIVE: To analyze the association of overweight and obesity with breastfeeding and complementary feeding in pre-school children.
METHODS: Cross-sectional study with 566 children, enrolled in private schools of the city of São Paulo, Southeastern Brazil, in 2004-2005. The dependent variable was overweight and obesity. Body Mass Index percentile curves were employed to classify children’s nutritional status, considering values ≥P85 and <P95 as overweight, and values ≥P95 as obesity. The following explanatory variables were analyzed: child and family socio-demographic characteristics; birth weight; parents’ nutritional status; breastfeeding; complementary feeding; and current feeding. Analysis of association between explanatory variables and outcome was performed with simple logistic regression and multiple logistic regression with hierarchical model.
RESULTS: Prevalence of overweight and obesity in the population studied was 34.4%. The following were protective factors against overweight and obesity: exclusive breastfeeding for six months or more (95% CI [0.38;0.86]; OR=0.57; p=0.02) and breastfeeding for more than 24 months (95% CI [0.05;0.37]; OR=0.13; p=0.00).
CONCLUSIONS: Results suggest that breastfeeding can protect children against overweight and obesity, thus representing yet another advantage of maternal milk.
DESCRIPTORS: Child, Preschool. Breast Feeding. Feeding. Overweight. Obesity. Cross Sectional Studies.
INTRODUCTION
The term “metabolic imprinting” describes a phenomenon by which an early nutritional experience, acting during a critical and specifi c developmental stage, can lead to permanent effects throughout an individual’s life, predisposing them to certain diseases.20
Breastfeeding represents one of the newborn’s earliest nutritional experiences. Thus, maternal milk’s unique composition could be involved with the metabolic imprinting process, changing adipocytes’ number and/or size, or inducing the phenomenon of metabolic differentiation.1
a Departament of Agriculture Center for Nutrition Policy and Promotion. Food guide pyramid for young children. 1999 [citado 2007 fev 14]. Disponível em: URL:http//www.cnpp.usda.gov
The hypothesis that breastfeeding has a protective effect against obesity is not recent. However, controversial results have been found, and the issue continues to this day, especially because of the important increase in prevalence of obesity.2
In a cross-sectional study5 with 2,565 American children
aged between three and fi ve years, those who had been breastfed showed lower prevalence of “risk of over-weight”, compared to the others who had never been breastfed. However, the authors did not observe a pro-tective effect against overweight, defi ned as Body Mass Index (BMI) equal to or above the 95 percentile. In Brazil, there have been few studies that verifi ed the relationship of breastfeeding to child overweight and obesity.As excess weight in children has become a rel-evant nutritional problem, this study aimed to analyze the association of overweight and obesity with breastfeeding and complementary feeding in pre-school children.
METHODS
A cross-sectional study with children, aged between two and six years, living in the city of São Paulo, Southeast Brazil, was performed in 2004-2005.
Sample was calculated using the EpiInfo 6.04 statistical package, Statcalc module, with the following param-eters: level of signifi cance of the α test=5%; power of test (1-β)=80%, odds ratio=2.2; 3:1 ratio between obese and obese individuals; % of exposed among non-obese individuals at 11%; resulting in 544 children. Seven private schools, located in the district of Santana, in the city of São Paulo, were contacted by telephone to enable research feasibility and better performance. All the schools agreed to participate in the study. There were 809 children, aged between two and six years, enrolled in these schools.
A questionnaire to collect information about demo-graphic and socioeconomic aspects of the child and its family, breastfeeding, complementary feeding and current feeding was designed. Data were collected between August and November 2004, and between March and May 2005. The questionnaire, with instruc-tions to be self-applied, was distributed by the schools to be fi lled out by the mothers themselves or those responsible for the children and subsequently returned to the school. Of all the 809 formularies distributed, 30% were not returned. Thus, the sample studied was comprised of 566 children.
As regards breastfeeding, it was asked until what age, in months, the child was exclusively breastfed (exclusive breastfeeding) and breastfed (breastfeeding).
In terms of complementary feeding, it was asked at what age (in months) the following foods were introduced in the child’s diet: water and/or tea, non-maternal milk, chocolate drink powders, sugar and/or honey, thicken-ers, fruits, leafy vegetables, cereals and tubthicken-ers, beans, beef, chicken, fi sh, egg yolk, whole eggs, cold cuts, yogurt, cookies, and candies (drops and/or lollipops, chocolate and other processed foods). In regard to current feeding, the mother was asked to report what the child usually consumed, listing daily meal foods exclusively, without the need to quantify them. Each food mentioned was considered as a serving consumed by the child, according to the following food groups: bread and cereals; vegetables; fruits; legumes; meat, offal and eggs; milk and dairy; sugar and candies; oils and fats. To assess current feeding, the U.S. Department of Agriculture Center for Nutrition Policy and Promo-tion (USDA) Food Pyramida for two to six-year-old
children was used as reference.
In addition to the questionnaire, anthropometric data were collected in the school itself, after consent was obtained from parents or those responsible, according to Lohman et al’s8 method (1988). Child weight was
measured with a Tanita 1632 Solar scale, and height measured with a Seca Bodymeter 208 stadiometer. All formularies were analyzed; when information was in-complete or unclear, the mother or those responsible were contacted by telephone again to obtain this information, so that there were no losses at this stage of research. The variable-response considered was child nutritional status. To classify it, BMI (weight [kg]/ height² [m]) percentile curves per age were used, in accordance with the National Center for Health Statistics (CDC, 2000):6 low weight values<5 percentile; normal weight
values≥5 percentile and <85 percentile; overweight values≥85 percentile and <95 percentile; and obesity values ≥95 percentile. For the statistical analysis, the variable-response was categorized into low weight + normal weight (<85 percentile) and overweight + obesity (≥85 percentile).
In regard to child complementary feeding, foods that could be associated with child nutritional status were analyzed. Water and/or tea, fruits and non-maternal milk were considered as foods responsible for the inter-ruption of exclusive breastfeeding. Early introduction of sugar and others (chocolate drink powder, sugar and/or honey, thickeners, yogurt, cookies and candies) can lead to obesity. Cold cuts were included in the analysis as they are a source of fat.
Food groups that are more related to overweight and obesity were selected for child current feeding, when consumed in great amounts: bread and cereals; milk and dairy; oils and fats; sugar and candies; and meat, offal and eggs.
Analysis of association of exclusive breastfeeding, breastfeeding, complementary feeding and current feeding with current child nutritional status was per-formed with simple logistic regression and multiple logistic regression.
The value of p<0.25, for inclusion of variables in the multiple logistic regression analysis, was used in the simple or bivariate analyses, thus enabling a greater number of variables in the model. According to the hierarchical proposal, once included in the model, variables remained until the end, regardless of p-value
in the subsequent stages. In the fi nal model, associations where variables showed p<0.10 were considered to be of greater interest.
The reference category used was always the fi rst cat-egory of each variable, except for the family income variable, whose reference category was ≤R$6,450.00. This is because the fi rst category was “family income not informed”, included in the analysis so that there were no losses of sample size.
Two multiple logistic regression models with the same variable-response (overweight + obesity) and same independent variables were performed. The main independent variable included in one of the models was exclusive breastfeeding, and in the other model, breastfeeding. Possible interactions between variables were tested with an α signifi cance level=5%.
Statistical analysis was performed using the Stata sta-tistical package, version 9.2. This study was approved by the Comitê de Ética em Pesquisa of Faculdade de Saúde Pública (School of Public Health Research Ethics Committee) at the Universidade de São Paulo. Informed consent forms were distributed by the school, along with research formularies. These were subse-quently returned to the school itself, duly signed by the mother or those responsible.
Figure. Hierarchical model for explanatory variables
Child’s sex* Child’s age* Birth weight* Father’s age* Father’s level of education*
Family income*
Breastfeeding*** Breastfeeding***
Mother’s age** Mother’s level of education** Mother’s working condition**
Number of siblings**
Mother’s nutritional status** Father’s nutritional status** Complementary feeding***
Current feeding***
Overweight and obesity
* Distal level
* * Intermediate level
RESULTS
Median exclusive breastfeeding was four months and median breastfeeding was seven months. In regard to complementary feeding, early introduction of all foods researched, among children aged between zero and six months of age, was found. For the majority of children (72.1%), water and/or tea was the earliest food intro-duced, followed by fruits (66.4%) and non-maternal milk (53.2%). Other foods were also introduced in this same period, such as: sugar and/or honey (15.2%); thickeners (10.2%); chocolate drink powders (3.0%); yogurts (4.6%); cereals and tubers (25.6%); beef, chicken or fi sh (54.1%); eggs (14.1%); leafy vegetables (40.3%) and beans (12.0%).
Fruit consumption in the current feeding was in ac-cordance with recommendations. Children consumed a lower number of servings than what is recommended for the bread and cereals and vegetables groups, and almost 50% more than what is recommended for the milk and dairy group.
As regards child nutritional status, 5.3% were found to be low weight; 60.2% were normal weight; 17.8% were overweight and 16.6% were obese, resulting in a prevalence of 34.4% for overweight and obesity. Table 1 shows the result of bivariate analysis. Variables with an association of p<0.25 in the bivariate analysis were selected for multiple analysis (Table 2): distal level – child age, birth weight, father’s age and family income; intermediate level – mother’s working conditions, number of siblings, parents’ nutritional status; and proximal level – exclusive breastfeeding, breastfeeding, introduction of cold cuts, introduction of sugar and others, and number of servings of the meat, offal and eggs group in current feeding. There was no interaction between type of breastfeeding and child age (p=0.47).
Tables 3 and 4 show results of multiple analysis for both models: exclusive breastfeeding model and breastfeed-ing model.
Hierarchical multiple analysis of the exclusive breast-feeding model shows that exclusive breastbreast-feeding was a protective factor against overweight and obesity. Risk factors were the following: age >4 years; birth weight >3.500g; early introduction of sugar and others in the diet; and having an obese father.
Hierarchical multiple analysis of breastfeeding model shows that the longer breastfeeding lasts, the better protected against overweight and obesity the child is. In this model, risk factors were the following: age >4 years; birth weight >3.500g; mother working out of the home; paternal nutritional status.
DISCUSSION
Prevalence of excess weight found was 34.4% and could be considered high for the age group of children studied.
Sample was obtained from private schools in the city of São Paulo, based on the hypothesis that these chil-dren would have better socioeconomic level, raising the possibility of fi nding higher prevalence of over-weight and obesity, and thus obtaining an adequate sample size for statistical analysis. According to the literature, overweight and obesity are more prevalent in children with higher socioeconomic level. As early as 1986, Campino4 pointed to income as an important
socioeconomic factor to determine nutritional status. More recently, Saldiva et al14 (2004) found that the
higher the per capita income, the higher the prevalence of obesity in children younger than fi ve years of age, living in fi ve cities of the state of São Paulo.
Leão et al7 (2003) studied 387 children aged between
fi ve and ten years, in public and private schools of the city of Salvador, state of Bahia, using the BMI to determine nutritional status. These authors found prevalence of 30% for obesity in private schools, and only 8% in public schools, showing that obesity is indeed more present in the population with higher socioeconomic level.
One possible limitation to this study is the occurrence of memory bias, when collecting information about duration of exclusive breastfeeding and age of introduc-tion of complementary feeding, as this is obtained in a retrospective manner.
Median duration of exclusive breastfeeding (four months) was high, if compared to other studies,9,15 and
so was the prevalence of exclusive breastfeeding in children older than six months (21.4%), a period when the child should already be given other foods.
Even though exclusive breastfeeding until the age of six months is admittedly important, complementary feeding continues to be introduced early on, as observed by this study and others.3,11,13,17,19
Final models of analyses showed that exclusive breast-feeding for six months or more and breastbreast-feeding con-tinuing for more than 24 months of age are protective factors against overweight and obesity.
As regards breastfeeding, when both variables (exclu-sive breastfeeding and breastfeeding) were included in the model, the relationship between explanatory vari-ables and the response-variable decreased. To avoid this “weakening”, the choice was to perform modeling with each of them separately to better understand the phenomenon.
could possibly interfere with this relationship. In regard to breastfeeding protection, for longer duration (more than 24 months), it is possible to raise the hypothesis
that the greater the amount of maternal milk an infant is fed in the beginning of life, the greater the protection in relation to overweight and obesity.
Table 1. Prevalence of overweight and obesity, OR and p-values, according to sociodemographic variables. São Paulo, Southeast Brazil, 2004-2005.
Variable n Overweight and obesity (%) OR p p*
Sex
Male 285 34.4 1
-Female 281 34.5 1.00 0.97
Child age (in years)
≤4 219 27.8 1
->4 347 38.6 1.63 0.01
Birth weight
<2,500 g 62 25.8 1
-2,500 |— 3,500g 380 32.9 1.41 0.28 0.01
≥3,500 g 124 43.5 2.22 0.02
Father’s age (in years)
≤38 299 31.8 1
->38 267 37.4 1.28 0.16
Father’s level of education
Elementary school or high-school 110 39.1 1
-University 456 33.3 0.78 0.25
Family income
Not informed 107 44.9 -
-≤R$ 6,450.00 230 28.3 1
->R$ 6,450.00 229 35.8 1.42 0.08
Mother’s age (in years)
≤35 299 35.1 1
->35 267 33.7 0.94 0.72
Mother’s level of education
Elementary school or high-school 87 35.6 1
-University 479 34.2 0.94 0.80
Mother’s working condition
Does not work 150 29.3 1
-Works 416 36.3 1.37 0.12
Number of siblings
0 368 36.1 1
-1 or more 198 31.3 0.80 0.24
Maternal nutritional status
Low or normal weight 417 32.6 1
-Pre-obesity 123 39.0 1.32 0.19 0.12
Obesity – levels I, II and III 26 42.3 1.51 0.31 Paternal nutritional status
Low or normal weight 149 29.5 1
-Pre-obesity 307 32.9 1.17 0.47 0.01
Obesity – levels I, II and III 110 45.4 1.99 0.01
Until now, there have been few studies on the relationship of current overweight and obesity to history of breast-feeding, in Brazil. Methodological differences among studies hinder comparison between them, in a way. By analyzing the association between exposure to breastfeeding in childhood and obesity in school-aged children from Brazilian families of high socioeconomic level, Siqueira & Monteiro16 (2007) observed that risk
of obesity in children who had never been breastfed were two times higher than the risk in other children.
Dose-response effect in the association between dura-tion of breastfeeding and obesity in school-aged chil-dren was not observed.
Balaban et al1 (2004) performed a cross-sectional study
with 409 children from daycare centers of the city of Recife government to investigate if breastfeeding had a protective effect against overweight in pre-school children (two to six years). Authors considered BMI
≥85 percentile as overweight. It was concluded that children who had been breastfed for a period shorter
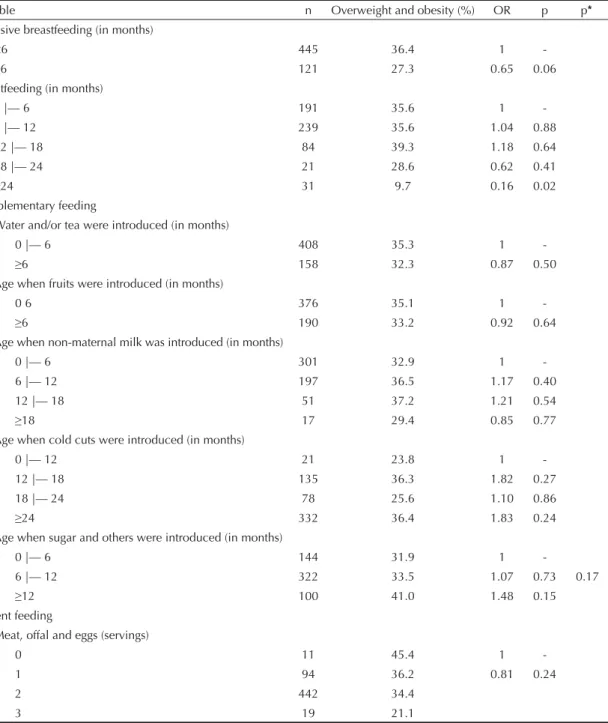
Table 2. Prevalence of overweight and obesity, OR and p-values, according to breastfeeding, complementary feeding and current feeding. São Paulo, Southeast Brazil, 2004-2005.
Variable n Overweight and obesity (%) OR p p*
Exclusive breastfeeding (in months)
<6 445 36.4 1
-≥6 121 27.3 0.65 0.06
Breastfeeding (in months)
0 |— 6 191 35.6 1
-6 |— 12 239 35.6 1.04 0.88
12 |— 18 84 39.3 1.18 0.64
18 |— 24 21 28.6 0.62 0.41
≥24 31 9.7 0.16 0.02
Complementary feeding
Water and/or tea were introduced (in months)
0 |— 6 408 35.3 1
-≥6 158 32.3 0.87 0.50
Age when fruits were introduced (in months)
0 6 376 35.1 1
-≥6 190 33.2 0.92 0.64
Age when non-maternal milk was introduced (in months)
0 |— 6 301 32.9 1
-6 |— 12 197 36.5 1.17 0.40
12 |— 18 51 37.2 1.21 0.54
≥18 17 29.4 0.85 0.77
Age when cold cuts were introduced (in months)
0 |— 12 21 23.8 1
-12 |— 18 135 36.3 1.82 0.27
18 |— 24 78 25.6 1.10 0.86
≥24 332 36.4 1.83 0.24
Age when sugar and others were introduced (in months)
0 |— 6 144 31.9 1
-6 |— 12 322 33.5 1.07 0.73 0.17
≥12 100 41.0 1.48 0.15
Current feeding
Meat, offal and eggs (servings)
0 11 45.4 1
-1 94 36.2 0.81 0.24
2 442 34.4
3 19 21.1
than four months showed greater prevalence of over-weight than those who had been breastfed for four months or more.
Study by Victora et al18 (2003) showed that prevalence
of obesity in male adolescents aged 18 years was three times lower among those who had been breastfed from three to fi ve months of age, compared to the remaining categories.
An international systematic review12 showed the
pro-tective effect of breastfeeding against overweight and obesity. Despite methodological differences among studies, the importance of breastfeeding to prevent overweight and obesity during childhood and adoles-cence was evident.
In the present study, among the remaining explanatory variables, child age over four years was a risk factor, perhaps because, at this age, they already choose and ask for foods they want to eat, giving preference to non-nutritious, high-energy foods. As the children studied belonged to families of high socioeconomic level, they would probably have more access to the media, which stimulates consumption of foods such as
cookies, candies, and salty snack foods. Another factor associated with risk at this age could be sedentarism, resulting from the daily hours spent on television and video-games, thus decreasing physical activity. Birth weight >3500g was found to be a risk factor to develop overweight and obesity. Monteiro et al10
(2003), while studying infants at birth, at 20 months and 40 months, and at 14 and 16 years of age, concluded that birth weight has a positive linear association with overweight.
Consumption of sugar and other foods that contain sugar or need to be prepared with sugar only seems to be risk factors in the exclusive breastfeeding model and for children with introduction of foods at 12 months or older. Introduction of sugar in the diet at this age, when children are developing their food habits, can lead to greater consumption of these foods. Preparations such as milk with chocolate drink powder, porridge and cookies, which have an appealing taste, please children, leading to consumption in great amounts, thus increas-ing the diet’s total energy intake and also the risk of overweight and obesity.
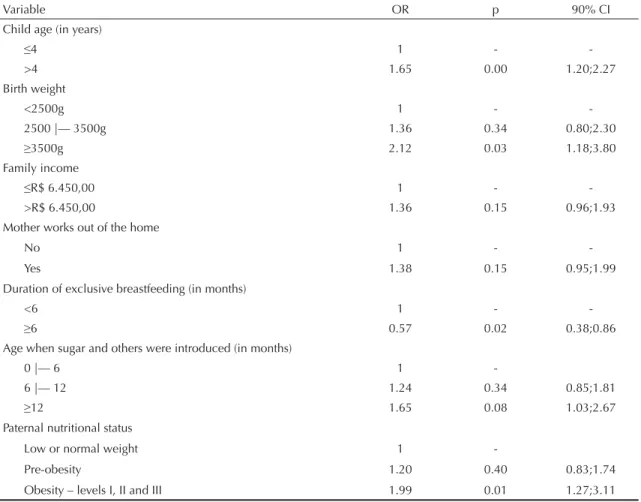
Table 3. Multiple logistic regression analysis with hierarchical model for exclusive breastfeeding and overweight and obesity. São Paulo, Southeast Brazil, 2004-2005.
Variable OR p 90% CI
Child age (in years)
≤4 1 -
->4 1.65 0.00 1.20;2.27
Birth weight
<2500g 1 -
-2500 |— 3500g 1.36 0.34 0.80;2.30
≥3500g 2.12 0.03 1.18;3.80
Family income
≤R$ 6.450,00 1 -
->R$ 6.450,00 1.36 0.15 0.96;1.93
Mother works out of the home
No 1 -
-Yes 1.38 0.15 0.95;1.99
Duration of exclusive breastfeeding (in months)
<6 1 -
-≥6 0.57 0.02 0.38;0.86
Age when sugar and others were introduced (in months)
0 |— 6 1
-6 |— 12 1.24 0.34 0.85;1.81
≥12 1.65 0.08 1.03;2.67
Paternal nutritional status
Low or normal weight 1
-Pre-obesity 1.20 0.40 0.83;1.74
As children whose mothers do not work seem to be better protected, mother’s work becomes a possible risk factor. Mothers who work out of the home all day long prob-ably leave their children in school full-time, where they have their meals. When leaving school at the end of the day, these children have already had dinner, unlike their parents. This can lead them to eat again with the family at home, thus increasing their diet’s total energy intake. Another factor is that the mother who works tends to please the child with high-energy foods, such as cookies, chocolate, salty snack foods, drops and lollipops, in an attempt to make up for her absence due to work. As regards the association of child overweight and obesity with paternal obesity, it could be supposed
that, in addition to the genetic factor, these fathers are not concerned about healthy eating and maintaining a normal weight. This image is passed onto the children, apart from usually eating fast-food meals or offering non-nutritious, high-energy foods to them. There were no studies in the literature that analyzed the association between child nutritional status and paternal nutritional status, thus making the comparison impossible. In conclusion, in addition to all the breastfeeding ben-efi ts that have already been studied and acknowledged, protection against overweight and obesity during child-hood becomes yet another benefi t, regardless of child age, family income, nutritional status and parents’ level of education.
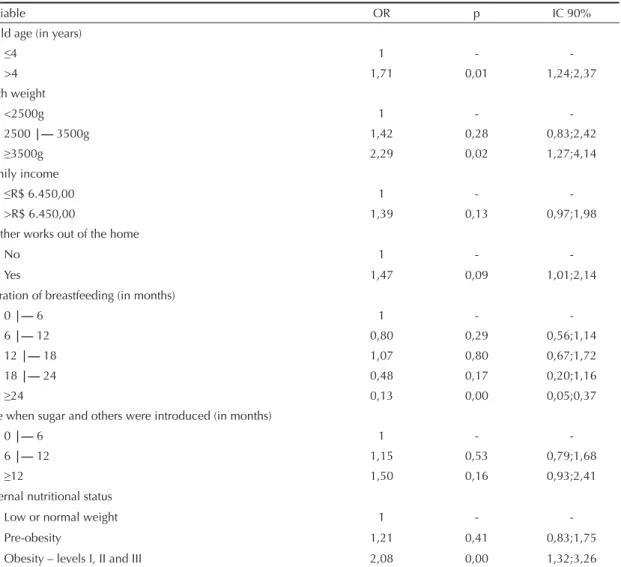
Table 4. Multiple logistic regression analysis with hierarchical model for breastfeeding and overweight and obesity. São Paulo, Southeast Brazil, 2004-2005.
Variable OR p IC 90%
Child age (in years)
≤4 1 -
->4 1,71 0,01 1,24;2,37
Birth weight
<2500g 1 -
-2500 |— 3500g 1,42 0,28 0,83;2,42
≥3500g 2,29 0,02 1,27;4,14
Family income
≤R$ 6.450,00 1 -
->R$ 6.450,00 1,39 0,13 0,97;1,98
Mother works out of the home
No 1 -
-Yes 1,47 0,09 1,01;2,14
Duration of breastfeeding (in months)
0 |— 6 1 -
-6 |— 12 0,80 0,29 0,56;1,14
12 |— 18 1,07 0,80 0,67;1,72
18 |— 24 0,48 0,17 0,20;1,16
≥24 0,13 0,00 0,05;0,37
Age when sugar and others were introduced (in months)
0 |— 6 1 -
-6 |— 12 1,15 0,53 0,79;1,68
≥12 1,50 0,16 0,93;2,41
Paternal nutritional status
Low or normal weight 1 -
-Pre-obesity 1,21 0,41 0,83;1,75
1. Balaban G, Silva GAP, Dias MLCM, Dias MCM, Fortaleza GTM, Morotó FMM, et al. O aleitamento materno previne o sobrepeso na infância? Rev Bras Saude Matern Infant. 2004;4(3):263-8. DOI: 10.1590/ S1519-38292004000300006
2. Balaban G, Silva GAP. Efeito protetor do leite materno contra a obesidade infantil. J Pediatr (Rio J). 2004;80(1):7-16. DOI: 10.1590/S0021-75572004000100004
3. Brunker GS, Silva SM, França GV, Escuder MM, Venâncio SI. Fatores associados à interrupção precoce do aleitamento materno exclusivo e à introdução tardia da alimentação complementar no centro-oeste brasileiro. J Pediatr (Rio J). 2006;82(6):445-51. DOI: 10.2223/JPED.1569
4. Campino AAC. Aspectos socioeconômicos da desnutrição no Brasil. Rev Saude
Publica.1986;20(1):83-101. DOI: 10.1590/S0034-89101986000100007
5. Hediger ML, Overpeck MD, Kuczmarski RJ, Ruan J. Association between infant breastfeeding and overweight in young children. JAMA. 2001;285(19):2453-60. DOI: 10.1001/jama.285.19.2453
6. Kuczmarski RJ, Ogden CL, Grummer SLM, et al. CDC Growth charts: United States – methods and development. Hyattsville, MD: National Center for Health Statistics; 2000.
7. Leão LSCS, Araújo LMB, Moraes LTLP, Assis AM. Prevalência de obesidade em escolares de Salvador, Bahia. Arq Bras Endocrinol Metab. 2003;47(2):151-7.
8. Lohman TG, Roche AF, Matorell R. Antropometric standardization reference manual. Iiinois: Human Kinetics; 1988.
9. Mascarenhas MLW, Albernaz EP, Silva MB, Silveira RB. Prevalência de aleitamento materno exclusivo nos 3 primeiros meses de vida e seus determinantes no Sul do Brasil. J Pediatr (Rio J). 2006;82(4):289-94. DOI: 10.2223/JPED.1506
10. Monteiro PO, Victora CG, Barros FC, Monteiro LM. Birth size, early childhood growth, and adolescent obesity in a Brazilian birth cohort. Int J Obes Relat Metab Disord. 2003;27(10):1274-82. DOI: 10.1038/sj.ijo.0802409
11. Oliveira LPM, Assis AMO, Pinheiro SMC, Prado MS, Barreto ML. Alimentação complementar nos primeiros
dois anos de vida. Rev Nutr. 2005;18(4):459-69. DOI: 10.1590/S1415-52732005000400002
12. S Arenz, Rückerl R, Koletzko B, Von Kries R. Breast-feeding and childhood obesity- a systematic review Int J Obes Relat Metab Disord. 2004;28(10):1247-56. DOI: 10.1038/sj.ijo.0802758
13. Saldiva SRDM, Escuder MM, Mondini L, Levy RB, Venâncio SI. Práticas alimentares de crianças de 6 a 12 meses e fatores maternos associados. J Pediatr (Rio J). 2007;83(1):53-8. DOI: 10.2223/JPED.1588
14. Saldiva SRDM, Escuder MML, Venâncio SI, Benicio D’ Aquino MH. Prevalence of obesity in preschool children from fi ve towns in São Paulo state, Brazil. Cad Saude Publica. 2004;20(6):1627-32. DOI: 10.1590/ S0102-311X2004000600021
15. Silveira FJF, Lamounier JA. Prevalência do aleitamento materno e práticas de alimentação complementar em crianças com até 24 meses de idade na região do Alto Jequitinhonha, Minas Gerais. Rev Nutr. 2004;17(4):437-47. DOI: 10.1590/S1415-52732004000400004
16. Siqueira RS, Monteiro CA. Amamentação na infância e obesidade na idade escolar em famílias de alto nível socioeconômico. Rev Saude Publica. 2007;41(1):5-12. DOI: 10.1590/S0034-89102007000100002
17. Simon VGN, Souza JMP, Souza SB. Introdução de alimentos complementares e sua relação com variáveis demográfi cas e socioeconômicas, em crianças no primeiro ano de vida, nascidas em Hospital Universitário no município de São Paulo. Rev Bras Epidemiol. 2003;6(1):29-38. DOI: 10.1590/S1415-790X2003000100005
18. Victora CG, Barros FC, Lima RC, Horta BL, Wells J. Anthropometry and body composition of 18 year old men according to duration of breast feeding: birth cohort study from Brazil. BMJ. 2003;327(7420):901. DOI: 10.1136/bmj.327.7420.901
19. Vieira GO, Silva LR, Vieira TO, Almeida JAG, Cabral VA. Hábitos alimentares de crianças menores de 1 ano amamentadas e não-amamentadas. J Pediatr (Rio J). 2004;80(5):411-6. DOI: 10.1590/S0021-75572004000600013
20. Waterland RA, Garza C. Potencial mechanisms of metabolic imprinting that lead to chronic disease. Am J Clin Nutr. 1999;69(2):179-97.
REFERENCES