1
Menzies School of Health Research. Casuarina, NT 0811, Australia. 2
Universidade Federal de Viçosa, Departamento de Nutrição e Saúde. Av. PH Rolfs, s/n., 36571-000, Viçosa, MG, Brazil. Correspondência para/Correspondence to: J. BRESSAN. E-mail: <[email protected]>.
3
Queensland University of Technology, Institute of Health and Biomedical Innovation, School of Human Movement Studies.
Campus Kelvin Grove, Brisbane, Australia.
Assessment of energy and macronutrient
intake in young men: a comparison of
4-day food record and 24-hour dietary recall
Quantificação do consumo energético e de
macronutrientes em homens jovens: uma
comparação de 4 dias de registros alimentares
e recordatório alimentar de 24 horas
Selma Coelho LIBERATO1,2
Josefina BRESSAN2
Andrew Peter HILLS3
A B S T R A C T
Objective
The objective was to assess the quantitative agreement between a 4-day food record and a 24-hour dietary recall in young men.
Methods
Thirty-four healthy men aged 18-25 years had their food intake estimated by 4-day food record within one week following 24-hour dietary recall in a cross-sectional study. Resting metabolic rate was assessed by indirect calorimetry and Energy Expenditure was estimated by physical activity records completed simultaneously with food intake records. The validity of food records was determined by direct comparison of Energy Intake and Energy Expenditure (95% confidence interval for Energy Intake/Energy Expenditure).
Results
Conclusion
Both diet methods, 24-hour dietary recall and 4-day food record, may be used to collect data at the group level, but not at the individual level. Both methods, however, appear to underestimate Energy Intake. Underreporting may be subject-specific and appears that is more difficult to retrieve valid dietary data from some people than others.
Indexing terms:Diet report. Energy consumption. Food records. Underreporting.
R E S U M O
Objetivo
Medir a concordância qualitativa entre registros alimentares, obtidos durante 4 dias, e recordatório alimentar de 24 horas em homens jovens.
Métodos
Em um estudo com delineamento transversal, o consumo alimentar de 34 homens saudáveis com idades entre 18 e 25 anos foi medido por meio do recordatório alimentar de 24 horas e uma semana depois, por meio de 4 dias de registros alimentares. O gasto energético em repouso foi medido por calorimetria indireta e o gasto energético total foi medido por meio de registros de atividade física. A validade dos registros alimentares foi determinada por comparação direta do consumo energético com o gasto energético total (intervalo de confiança de 95% para consumo energético/gasto energético total).
Resultados
A concordância entre medidas de consumo energético e de consumo de macronutrientes, obtida por meio de registros alimentares de 4 dias e por recordatório de 24 horas, foi boa para grupos, mas não para indivíduos. Comparado com o gasto energético total, um baixo consumo energético foi observado em 20% e em 9% dos participantes, quando o consumo alimentar foi obtido por meio de registros alimentares de 4 dias e por recordatório de 24 horas, respectivamente. Mais de 30% dos participantes que tiveram baixo consumo energético, obtido com a utilização de recordatório de 24 horas, também tiveram baixo consumo energético a partir do exame dos registros alimentares de 4 dias.
Conclusão
Orecordatório de 24 horas é uma opção para registros alimentares de 4 dias na coleta de dados para grupos, mas não para indivíduos. Entretanto, baixo consumo alimentar, em alguns participantes, foi observado quando ambos os métodos foram utilizados na coleta de dados de consumo alimentar. É possível que a determinação de baixo consumo alimentar em alguns participantes seja específica do participante, sugerindo que pode ser mais difícil obter dados precisos de umas pessoas do que de outras.
Termos de indexação: Registros de dieta. Consumo de energia. Inquéritos alimentares. Subregistro.
I N T R O D U C T I O N
Accurate measurements of food intake are important to studies of the association between diet and health1. A method often used in large
surveys due to its short administration time is the 24-hour Dietary Recall Method (24hDR), where during an interview, the participant tells the interviewer the quantity of foods and beverages consumed in the preceding day. This method has a relatively small participant burden, participants’ food intake pattern is unchanged and the collected
data are more reliable due to the personal contact with the interviewer. However, the participants’ recall depends on memory.
The self-report method, where the participants record all food and beverages consumed during a period of time, usually ranging from 1 to 7 days, is probably the most accurate of the self-report methods. However, the disadvantages include the burden to respondent of the recording process and the possibility of the habitual intake to be changed2,3. The amount of consumed food
Methods where the amount of food consumed is weighed previously are the most accurate. However, their use is time consuming, requires a high level of participants’ cooperation and is cumbersome for free-living participants. The estimation of the amount of food is rapid, has low cost, has high cooperation rates and is less demanding for participants than weighing foods4,5.
However, the accuracy of estimating food is highly variable among participants according to subject’s skills, memory and commitment to the study. Previous training improves the food portion estimates6.
Many studies have evaluated the relative validity of the diet assessment methods and the agreement between the methods has typically been summarised by calculation of the correlation, regression coefficients or degree of cross-classification. Indeed, no study has actually focused on the absolute agreement between the methods and the individual variation of the between-method differences in young men.
In addition, it has been established for many years that comparisons between methods are not sufficient, since individuals report similarly with different methods. Therefore, the aim of the present study was quantitatively to test the agreement between estimated nutrient intake obtained with 24hDR recall and 4-day food record (4dFR) methods in a sample of young men comparing the food intake methods against energy expenditure.
M E T H O D S
Thirty-four healthy young men aged between 18 and 25 years were recruited between July 2004 and March 2005, from the local community in the city of Brisbane, Australia through newspaper advertisements, flyers in clubs, schools, universities and fitness centers. Each participant read and signed an approved written consent form. Queensland University of Technology Human Research Ethics Committee approved the
participant recruitment and the data collection procedures.
The 24hDR and coding of records were performed by the same trained dietitian. The 24hDR comprised four steps. Firstly, the interviewe was asked to recall foods consumed in the previous day. In the second pass, the interviewer probed for estimations with household measures and details about each of the foods and fluids listed. On the third pass, individually the participant saw 48 food item slides each with 3 food sizes expressed on household measures on a computer screen. On the fourth pass the participant had an opportunity to correct and/or complete any inaccurate or forgotten data in his previous recall.
The 4-day food record was completed within one week after the 24hDR and participants recorded food intake estimated by household measures during the same 4 days while completing the physical activity record. The period of recording included two weekdays, a Saturday and a Sunday.
The 24hDR and 4dFR data were entered into the Foodworks© (v. 3.02) nutrient analysis
software (Xyris software Pty Ltd., Brisbane, Australia, http://www.xyris.com.au) incorporating nutrient tables for use in Australia (AUSNUT, Canberra, 2000). Dietary records were checked by a dietitian and details regarding recipes and portion sizes were noted and clarified with each participant. Macronutrients were expressed as absolute intakes and energy adjusted volumes (percentage of daily energy intake).
Resting metabolic rate was assessed by a continuous open-circuit indirect calorimetry device. Respiratory gases were collected continuously for 30 minutes and the data from the last 10 minutes were used for analyses. Participants lay supine in a comfortable position, listening to a radio to prevent sleeping whilst monitored to ensure that they remained awake.
rested lying for 30min in the laboratory before the measurement. A Deltatrac II metabolic cart (Datex-Ohmeda Corp., Helsinki, Finland - http:// www.datex-ohmeda.com) was used to assess RMR of half of the participants. Expired gas was analyzed for oxygen concentration via a paramagnetic O2 sensor and for carbon dioxide concentration via an infrared absorption technique. Due to technical problems, the Moxus O2 system (AEI Technologies, Pennsylvania, USA) was used to assess the RMR of the remaining participants. Participants were fitted with a Hans-Rudolf headset (with two-way breathing valve and pneumotach) and a nose clip.
Both gas analyzers were calibrated prior to each measurement against standard mixed reference gases. There are unlikely to be any significant differences in measuring RMR with two different machines because they are continuous open-circuit indirect calorimetry devices that measure oxygen and carbon dioxide concentrations using similar sensors. The Weir equation7 was used
to convert O2 and CO2 values to RMR values.
RMR = [(1.106 VCO2 (L/min) + 3.941 x VO2 (L/min)] x 1440 min/d, where RMR is the resting metabolic rate (kcal.d-1), VCO
2 is the carbonic
dioxide production rate and VO2 is the oxygen consumption rate.
Daily energy expenditure
A 4-day physical activity record8 was
completed simultaneously with recording food intake. Physical activity was recorded (1-9, corresponding to nine categories of physical activity intensity) for each 15-min period, throughout the day. These categories and their corresponding list of activities, as established by Bouchard et al8.
were explained and illustrated in detail to each participant before they started to record.
The daily EE was calculated after accounting, for each 15-min period of a day and multiplying the score by its specific metabolic equivalent (MET). The 4-day physical activity record scores
1, 2, 3, 4, 5, 6, 7, 8 and 9 correspond to 1, 1.5, 2.3, 2.8, 3.3, 4.8, 5.6, 6 and 7.8 METs, respectively.
Evaluation of the validity of food intake methods
The participants were asked to maintain a normal diet and there were no significant changes in their weight before and after recording food intake suggesting that participants in this study were in energy balance and therefore the validation is by direct comparison of Energy Intake (EI) with Energy Expenditure (EE) expressed as the ratio EI:EE. The expected ratio is 1.00 and the 95% Confidence Limits (CL) are based on mean within-subject variation on daily EI intake (CVwEI) and on within-subject variation in EE (CVwEE).
CL (EI)0.95 = EE [± 2 (CVwEI2./.d + CV
wEE 2)1/2]
where CVwEI is the within-subject variation in EI, d is the number of days of diet assessment9,10 and
CVwEE is the within-subject variation in Pooled mean CVw = (ΣCVi2 / n)1/2, where CV
i is the CV
(CVwEI or CVwEE) calculated for each participant from the number of days of dietary assessment or EE assessment available for that participant, and
n is the number of participants11. In the current
study, mean within-subject variation on daily EI intake (CVwEI) was 23% and on within-subject variation in EE (CVwEE) was 15%.
Although EI is a continuous, quantitative limits were defined to identify the under-reporters (URs), acceptable reporters (ARs) and over-reporters.
When EI was estimated by 4dFR, ARs were defined as having the ratio EI/EE in the range 0.62-1.38, URs as EI/EE<0.62, and over-reporters as EI/EE >1.38.
When EI was estimated by 24hDR, ARs were defined as having the ratio EI/EE in the range 0.45-1.55, URs as EI/EE<0.45, and over-reporters as EI/EE>1.55.
were evaluated with the use of the Student’s test. Calculation of correlation coefficients are inappropriate to test the degree of agreement between two diet methods’ ability to measure daily energy and macronutrient intake in the same individuals since they only measure the strength of a relation between the two measurements and not the quantitative agreement between them12.
To give quantitative estimates of the agreement between the two methods, Bland-Altman plots were constructed to illustrate the distribution of error scores (4dFR - 24hDR - esti-mated nutrient intake). Solid horizontal lines in theses plots indicate mean error scores, whereas dashed horizontal lines present the 95%
confidence intervals for the error scores. The analyses were conducted using the Statistic for Windows 5.5 software.
R E S U L T S
The characteristics of the participants are shown in Table 1. The participants had a mean age of 21.4 years, with a mean Body Mass Index (BMI) of 24.83kg/m2.
The 24hDR and 4dFR provided similar estimates of average daily energy and macronutrient intake expressed as energy source (Table 2). However, there were large variations between 4dFR and 24hDR estimates at the
Table 2. Daily macronutrients and energy intake evaluated by 24-hour dietary recall and 4-day food record from 34 young men. Brisbane, Australia, 2005.
Proteins (g) Fat (g)
Carbohydrates (g) EI (kcal/d)
EI from proteins (%)b
EI from fat (%)b
EI from carbohydrates (%)b
Dietary intake
0.121.6 0.096.3 0.335.8 2.747.0 0.019.0 0.031.4 0.049.1 042.3 031.4 102.3 686.0 004.6 006.5 009.3
(51.9 - 225.0)a
(32.2 - 152.5) (142.4 - 591.4)a (1.440.0 - 4.011.0)
(12.8 - 30.3)a (18.3 - 44.1)a (35.0 - 68.4)a
a a 24hDR Dietary method 0.113.3 0.096.1 0.318.7 2.726.0 00.18.0 00.32.0 0.046.7 028.5 020.2 080.4 526.0 003.8 005.1 007.0
(60.7 - 178.5) 60.6 - 132.5) 180.9 - 545.2) (1.781.0 - 3.750.0)
(12.3 - 28.8) (18.5 - 40.6) (32.8 - 61.5) 4dFR
a minimum - maximum; b Energy source = 100 x nutrient intake (g) x nutrient energy value/EI.
The nutrient energy value for protein, fat and carbohydrate are 4, 9 and 4 kcal.g-1, respectively. EI: energy intake; M: mean; SD: standard
deviation; 24hDR: 24-hour dietary recall; 4dFR: 4-day food record.
Table 1. Anthropometric characteristics, body mass index, resting metabolic rate, daily energy expenditure, physical activity level, daily energy intake and cut-off limits of 34 young male participants in the study. Brisbane, Australia, 2005.
Age (y) Body weight (kg) Height (m) BMI (kg/m2)
RMR (kcal/d) EE (kcal/d) PAL (= EE / RMR) EI 4dFR (kcal/d)a
EI 24hDR (kcal/d)b
Individual cut-off Group cut-off .0021.40 0.077.50 0.001.76 00.24.83 1.904.40 3.626.40 000.1.91 2.726.40 2.747.00
002.10 013.50 0000.070
003.49 282.10 613.70 000.18 525.80 686.00 00.18.00 00.54.40 0001.60 0018.76 1.348.90 2.533.30 0001.50 1.781.30 1.440.00
.0025.00 0.103.80 0.001.89 0.033.50 2.583.70 4.796.40 00.02.26 3.749.80 4.011.00
Characteristics Mean Standard deviation Minimum Maximum
1.26<EI/RMR<2.72 1.73<EI/RMR<1.98
a 4dFR: 4-day food record; b 24hDR: 24-hour dietary recall.
BMI: body mass index; RMR: resting metabolic rate; EE: daily energy expenditure; PAL: physical activity level; EI: energy intake.
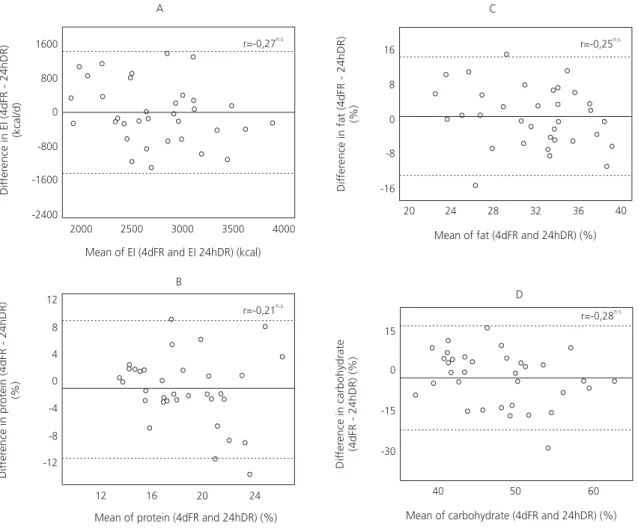
individual level. Despite the differences being normally distributed (Gaussian), because 95% of differences fell between mean 1.96 SD, they were too large at individual level (Figure 1).
Three (8.8%) and seven (20.6%) URs were identified when EI was estimated by 24hDR and by 4dFR, respectively (Figure 2).
The within-participant day to day variation in EI (CVwEI) of individuals is large (Figure 3A). When considering mean daily EI from two or three days, the variation decreases with increasing the number of days of dietary assessment (Figure 3B and 3C).
The linear correlation between mean daily EI and EE was not significant when EI was estimated by 4dFR (r=0.29) or 24hDR (0.001).
D I S C U S S I O N
There was good agreement between the measurements of energy and macronutrients intake estimated by 24hDR and 4dFR at the group level. Similar findings were observed in other studies. The mean differences between the nutrient intake observed in 42 men aged 21 to 65 years with BMI of 21 to 39kgm-2 while in a
metabolic facility and that estimated by 24hDR the following day, ranged from 8.0 to 9.3%13.
When 79 men aged 20 to 67 years selected and consumed all foods for a 1-day period under observation and actual intake was determined in the following day by a 24-hour recall, the energy intake was overestimated by 7.6%14. Karvetti &
Figure 1. Bland and Altman12 plot. Differences in daily energy intake - EI (A) protein (B), fat (C), and carbohydrate intake (D) of 34
young men, estimated by 4-day food record (4dFR) and 24-hour dietary recall (24hDR) against the mean of the estimations by both methods. Brisbane, Australia, 2005.
Note: The linesrepresent the mean difference (solid) and 1.96 standard deviation (dashed). n.s p>0.05.
Dif
fer
ence in carbohydrate
(4dFR - 24hDR) (%)
Dif
fer
ence in fat (4dFR - 24hDR)
(%)
20 -16
Mean of fat (4dFR and 24hDR) (%)
r=-0,25n.s.
24 28 32 36 40
-8 0 8 16
C
40 -30
Mean of carbohydrate (4dFR and 24hDR) (%)
r=-0,28n.s.
-15 0 15
50 60
D
Dif
fer
ence in EI (4dFR - 24hDR)
(kcal/d)
2000 2500 3000 3500 4000
-2400 -1600 -800 0 800 1600
Mean of EI (4dFR and EI 24hDR) (kcal)
r=-0,27n.s.
A
Dif
fer
ence in pr
otein (4dFR - 24hDR) (%)
12 -12
12
Mean of protein (4dFR and 24hDR) (%)
r=-0,21n.s.
16 20 24
-8 -4 0 4 8
Knuts15 found that EI estimated by 24hDR was
overestimated by 3% in relation to that observed intake in 140 participants including 84 men and 56 women aged 15 to 57 years.
However, the relative and absolute agreement at the group level between 24hDR and 4dFR does not necessarily indicate that the methods are valid measurements of food intake. The EI estimated from both 24hDR and 4dDR methods in the current study was approximately 25% below EE estimated by 4-day physical activity records.
Figure 2. Energy Intake (EI)/Energy Expenditure (EE) against EE in 34 youth men. EI was estimated by 24-hour dietary recall (24hDR) (A) or by 4-day food record (4dFR) (B). Brisbane, Australia, 2005.
Note:The lines represent the 95% confidence limits of EI/EE.
z = underreporters: EI/EE<0.45 (A) or EI/EE<0.62 (B).
Figure 3. Individual energy intake (EI) variation of 34 youth men estimated by 4-day food record: differences between four days EI average (EI 4d) daily EI (EI 1d) (A), two days EI average (EI 2d) (B) and three days EI average (EI 3d) (C). d is the absolute difference (mean, standard deviation. Brisbane, Australia, 2005.
0 -2000
Participants
EI 2d - EI 4d
|d|=246.3 239.5
+-10 20 30 40
-1000 0 1000 2000
B
0 -2000
Participants
EI 3d - EI 4d
|d|=145.4 123.1
+-10 20 30 40
-1000 0 1000 2000
C
0 -2000
Participants
EI 1d - EI 4d
|d|=446.4 393.9
+-10 20 30 40
-1000 0 1000 2000
A
1600 2000 2400 2800 3200 3600 4000
0.4 0.6 0.8 1.0 1.2 1.4 1.6
EI/EE
24hDR
El (kcal)
1600 2000 2400 2800 3200 3600 4000
0.4 0.6 0.8 1.0 1.2 1.4 1.6
EI/EE
4dFR
Underestimation of EI intake has been found in other studies. Jonnalagadda et al.16 found
EI underestimation of 12% when 24hDR was compared to EI required to maintain body weight in 78 men and women aged 22 to 67 years. Thirty-three women reported their EI as 13% lower than their observed intake during one day in a metabolic facility17.
The EI underestimation of 25% estimated by both food intake methods in relation to EE found in the current study was higher than that (12% or 13%) found in other studies16,17. An
overestimation of EE may have occurred. The use of self reported physical activity records to estimate EE is a limitation of the current study because individuals can easily overestimate or underestimate the time spent in activity and the intensity of the activity18. An overestimation of EE
would explain a higher PAL (1.91) compared to the mean (1.85) for men 18-25 years19 when EE
was assessed by Double Labeled Water (DLW). A overestimation of EE would also explain the smaller EI/EE (0.76) found in the current study compared to that (0.84) found by Livingstone et al.20 when
analyzing data from 26 studies where EI was reported and EE was assessed by DLW. However, if EE was overestimated, it did not appear to have jeopardized the study regarding the number of URs identified because the upper limit of 1.38 for ARs was much higher than the highest EI/EE ratio of 1.2 found for one of the participants of the current study. However caution should be taken with the percentage of EI underestimation.
At the individual level, there was not good agreement between the measurements of individual intake of energy and macronutrients by 24hDR and 4dFR. The inaccuracy of 24hDR for measuring food intake at the individual level was also observed in other studies. Conway et al.13
observed a significant variation in the ability of the men to recall food intake and the errors ranged from almost zero to 30% for EI. Karvetti & Knuts15
found that 45% of participants under- or over-estimated their EI by more than 20% compared to their observed food intake.
Besides the difficulty in recalling food on the previous day there is large within-participant day-to-day variation in EI which makes 24hDR inaccurate to measure habitual or usual food intake. Champagne et al.21 found day-to-day
variation higher than 2500 kcal.d-1 in one
participant over a 7-day period. Individual daily EI differed according to the annual average by up to 1670 kcal11 and the CV
wEI ranged from 10 to 50%,
with a pooled mean of 26%22. From 14 studies
reviewed by Bingham23 and Nelson et al.24, CV wEI
ranged from 14 to 45%, with a pooled mean of 23%. These data are similar to the daily EI variability for 4dFR data found in the current study which ranged from 3.5 to 52.4% with a pooled mean of 23.6%.
The daily EI variability for 4dFR data decreased with the increasing of days reporting food intake in the current study, which can be observed in the Figure 3, where the points were closer to the line 0 and consequently the difference between EI mean estimated from 3 days and that estimated from 4 days was smaller. Due to smaller variability of EI intake estimated with 4dFR, the cut-off interval was smaller (0.68 -1.38 versus 0.45-1.55) and higher number of individuals (7 versus
3) were identified as URs compared to 24hDR.
The smaller number of URs identified with 24hDR than that identified with 4dFR does not mean that 24hDR is more accurate to estimate food intake. When food intake of only one day is considered, the within-participant day-to-day variation in EI is very large, leading to a low sensitivity and therefore fewer URs are identified.
There is a tendency subject-specific for food intake underreporting10. If a participant is an UR
once, it is very likely that he/she will be an UR on other occasions. In the current study, 33% of UR of EI estimated by 24hDR underreported EI estimated by 4dFR. High percentage of URs on more than one occasion has been identified when EI is assessed by the same1,25 or by different
methods5. When 24-hour dietary was used to
dietary also under-reported on the second 24hDR, 1 month after1. Using either diet history or 7dFR
method to estimate EI, 34% of men underreported by both food intake methods5.
Different measurement contexts and skills required in recording and reporting may have accounted for differences on measurements estimated with 24hDR and 4dFR at the individual level. The 24hDR relies on memory and “bad” dietary intake is less likely to be reported to an interviewer than on a self-report3,26.
On the other hand, 4dFR may be more difficult to participants to complete than the 24hDR. It is widely recognized that food self reports are subject to errors and biases11. In addition, there
are some participants’ common errors when reporting food intake including: a) overeating, or most commonly undereating, which are an increase, or a reduction, respectively, in food intake2,17,26-29, b) under or over-estimation due to
errors in the estimation of portion size and lack of knowledge of the composition of mixed dishes30
and c) mis-reporting including under- and over-reporting due to forgotten meals and failure to record because of the burden of recording everything that was eaten29. Over 45% of participants
admitted to have altered their diet consciously due to feeling embarrassed about recording specific food and / or due to much effort after having weighed and recorded food intake over 7 days29.
In conclusion, there was good agreement between the measurements of energy and macronutrients intake by 24hDR and 4dFR at the group level, but not at the individual level. Therefore 24hDR can be used to assess a food intake of a group but not their individual intake. About 20% and 9% of participants underreported their EI by 4dFR and 24hDR, respectively considering the 95% confidence interval for EI/EE criteria. Over 30% of EI URs assessed by 24hDR underreported their EI assessed by 4dFR showing that underreporting may be subject-specific and it appears that is more difficult to retrieve valid dietary data from some people than others.
A C K N O W L E D G E M E N T S
The authors thank the voluntary participants and the Queensland University of Technology for the use of its Laboratories and facilities. S.C. Liberato acknowledges financial support from the Conselho Nacional de Desenvolvimento Científico e Tecnológico. (processo 140931/2001-5) and (processo 201075/03-2).
C O N T R I B U T I O N S
S.C. LIBERATO planned, executed the study, analyzed the data, prepared the manuscript and participated in reviewing the manuscript. J. BRESSAN participated in planning the study and reviewing the manuscript and A.P. HILLS participated in planning the study, reviewing the manuscript and obtained the funds.
R E F E R E N C E S
1. Briefel RR, Sempos CT, McDowell MA, Chien S, Alaimo K. Dietary methods research in the third National Health and Nutrition Examination Survey: underreporting of energy intake. Am J Clin Nutr. 1997; 65(4 Suppl):1203S-9S.
2. Biro G, Hulshof KF, Ovesen L, Amorim Cruz JA. Selection of methodology to assess food intake. Eur J Clin Nutr. 2002; 56(Suppl2):S25-32. 3. Hoidrup S, Andreasen AH, Osler M, Pedersen AN,
Jorgensen LM, Jorgensen T, et al. Assessment of habitual energy and macronutrient intake in adults: comparison of a seven day food record with a dietary history interview. Eur J Clin Nutr. 2002; 56(2):105-13.
4. Edington J, Thorogood M, Geekie M, Ball M, Mann J. Assessment of nutritional intake using dietary records with estimated weight. J Hum Nutr Diet. 1989; 2(6):407-14.
5. Kortzinger I, Bierwag A, Mast M, Muller MJ. Dietary underreporting: validity of dietary measurements of energy intake using a 7-day dietary record and a diet history in non-obese subjects. Ann Nutr Metab. 1997; 41(1):37-44.
6. Howat PM, Mohan R, Champagne C, Monlezun C, Wozniak P, Bray GA. Validity and reliability of reported dietary intake data. J Am Diet Assoc. 1994; 94(2):169-73.
8. Bouchard C, Tremblay A, Leblanc C, Lortie G, Savard R, Theriault G. A method to assess energy expenditure in children and adults. Am J Clin Nutr. 1983; 37(3):461-7.
9. Black AE. The sensitivity and specificity of the Goldberg cut-off for EI:BMR for identifying diet reports of poor validity. Eur J Clin Nutr. 2000; 54(5):395-404.
10. Black AE, Cole TJ. Biased over- or under-reporting is characteristic of individuals whether over time or by different assessment methods. J Am Diet Assoc. 2001; 101(1):70-80.
11. Black AE. Critical evaluation of energy intake using the Goldberg cut-off for energy intake:basal metabolic rate. A practical guide to its calculation, use and limitations. Int J Obes Relat Metab Disord. 2000; 24(9):1119-30.
12. Bland JM, Altman DG. Statistical methods for assessing agreement between two methods of clinical measurement. Lancet. 1986; 1(8476): 307-10.
13. Conway JM, Ingwersen LA, Moshfegh AJ. Accuracy of dietary recall using the USDA five-step multiple-pass method in men: an observational validation study. J Am Diet Assoc. 2004; 104(4):595-603. 14. Ard JD, Desmond RA, Allison DB, Conway JM.
Dietary restraint and disinhibition do not affect accuracy of 24-hour recall in a multiethnic population. J Am Diet Assoc. 2006; 106(3):434-7. 15. Karvetti RL, Knuts LR. Validity of the 24-hour dietary
recall. J Am Diet Assoc. 1985; 85(11):1437-42. 16. Jonnalagadda SS, Mitchell DC, Smiciklas-Wright
H, Meaker KB, van Heel N, Karmally W, et al. Accuracy of energy intake data estimated by a multiple-pass, 24-hour dietary recall technique. J Am Diet Assoc. 2000; 100(3):303-8; quiz 9-11.
17. Poppitt SD, Swann D, Black AE, Prentice AM. Assessment of selective under-reporting of food intake by both obese and non-obese women in a metabolic facility. Int J Obes Relat Metab Disord. 1998; 22(4):303-11.
18. Ainslie PN, Reilly T, Westerterp KR. Estimating human energy expenditure: a review of techniques with particular reference to doubly labelled water. Sports Med. 2003; 33(9):683-98.
19. Black AE, Coward WA, Cole TJ, Prentice AM. Human energy expenditure in affluent societies: an analysis of 574 doubly-labelled water measurements. Eur J Clin Nutr. 1996; 50(2):72-92. 20. Livingstone MB, Prentice AM, Coward WA, Strain JJ, Black AE, Davies PS, et al. Validation of estimates of energy intake by weighed dietary record and
diet history in children and adolescents. Am J Clin Nutr. 1992; 56(1):29-35.
21. Champagne CM, Bray GA, Kurtz AA, Monteiro JB, Tucker E, Volaufova J, et al. Energy intake and energy expenditure: a controlled study comparing dietitians and non-dietitians. J Am Diet Assoc. 2002; 102(10):1428-32.
22. Black AE, Prentice AM, Coward WA. Use of food quotients to predict respiratory quotients for the doubly-labelled water method of measuring energy expenditure. Hum Nutr Clin Nutr. 1986; 40(5):381-91.
23. Bingham SA. The dietary assessment of individualsç methods, accuracy, new techniques and recommendations. Nutr Abstr Rev. 1987; 57(10): 705-42.
24. Nelson M, Black AE, Morris JA, Cole TJ. Between-and within-subject variation in nutrient intake from infancy to old age: estimating the number of days required to rank dietary intakes with desired precision. Am J Clin Nutr. 1989; 50(1):155-67. 25. McKenzie DC, Johnson RK, Harvey-Berino J, Gold
BC. Impact of interviewer’s body mass index on underreporting energy intake in overweight and obese women. Obes Res. 2002; 10(6):471-7. 26. Hebert JR, Ebbeling CB, Matthews CE, Hurley TG,
Ma Y, Druker S, et al. Systematic Errors in Middle-Aged Women’s Estimates of Energy Intake: comparing three self-report measures to total energy expenditure from doubly labeled water. Ann Epidemiol. 2002; 12(8):577-86.
27. Asbeck I, Mast M, Bierwag A, Westenhofer J, Acheson KJ, Muller MJ. Severe underreporting of energy intake in normal weight subjects: use of an appropriate standard and relation to restrained eating. Public Health Nutr. 2002; 5(5):683-90. 28. Black AE, Prentice AM, Goldberg GR, Jebb SA,
Bingham SA, Livingstone MB, et al. Measurements of total energy expenditure provide insights into the validity of dietary measurements of energy intake. J Am Diet Assoc. 1993; 93(5):572-9. 29. MacDiarmid JI, Blundell JE. Dietary under-reporting:
what people say about recording their food intake. Eur J Clin Nutr. 1997; 51(3):199-200.
30. Vuckovic N, Ritenbaugh C, Taren DL, Tobar M. A qualitative study of participants’ experiences with dietary assessment. J Am Diet Assoc. 2000; 100(9):1023-8.
Received on: 3/9/2007