Dental Materials
Alfonso Sánchez-AyAlA(a)
larissa Soares Reis VilAnoVA(b)
Marina Abrantes coStA(c)
Arcelino FARiAS-neto(c)
(a)Department of Dentistry, Dental School, Universidade Estadual de Ponta Grossa – UEPG, Ponta Grossa, PR, Brazil.
(b)Department of Prosthodontics and Periodontology, Piracicaba Dental School, Universidade Estadual de Campinas – UNICAMP, Piracicaba, SP, Brazil.
(c)Department of Prosthodontics, Dental School, Universidade Potiguar – UnP, Natal, RN, Brazil.
Reproducibility of a silicone-based
test food to masticatory performance
evaluation by different sieve methods
Abstract: The aim of this study was to evaluate the reproducibility of the condensation silicone Optosil Comfort® as an artiicial test food
for masticatory performance evaluation. Twenty dentate subjects with mean age of 23.3 ± 0.7 years were selected. Masticatory performance was evaluated using the simple (MPI), the double (IME) and the mul-tiple sieve methods. Trials were carried out ive times by three ers: three times by the irst, and once by the second and third examin-ers. Friedman’s test was used to ind the differences among time trials. Reproducibility was determined by the intra-class correlation (ICC) test (α = 0.05). No differences among time trials were found, except for MPI-4 mm (p = 0.022) from the irst examiner results. The intra-examiner reproducibility (ICC) of almost all data was high (ICC ≥ 0.92, p < 0.001), being moderate only for MPI-0.50 mm (ICC = 0.89, p < 0.001). The inter-examiner reproducibility was high (ICC > 0.93, p < 0.001) for all results. For the multiple sieve method, the average mean of absolute difference from repeated measurements were lower than 1 mm. This trend was observed only from MPI-0.50 to MPI-1.4 for the single sieve method, and from IME-0.71/0.50 to IME-1.40/1.00 for the double sieve method. The results suggest that regardless of the method used, the reproduc-ibility of Optosil Comfort® is high.
Keywords: Mastication; Reproducibility of Results; Dental Occlusion.
introduction
The masticatory performance (MP) test describes masticatory function objectively as the degree of test food comminution achieved by a certain number of chewing cycles.1 MP can be affected by occlusal status,
skel-etal features, mandibular kinematics, and bite force.1,2,3,4,5 In turn, it can inluence nutrient intake, body mass index (BMI),5 gastric health,6
glu-cose metabolism,7 and heart rate.8
The multiple sieve method of MP assessment involves calculation of the median comminuted particle size (X50) by grouping cumulative
weight percentage data from passes through sieves of decreasing size.1
This estimation includes determination of the broadness variable (b), which describes the spread of particle size distribution.2 Other
distribu-tion percentiles, such as X80 and X20, can also be analyzed to determine the
proportion of extreme size values.9 The single3 and double10 sieve
meth-ods are simpler, but arbitrary, clinical alternatives that quantify cumu-Declaration of interests: The authors
certify that they have no commercial or associative interest that represents a conflict of interest in connection with the manuscript.
corresponding author Alfonso Sánchez-Ayala E-mail: [email protected]
Doi: 10.1590/1807-3107BOR-2014.vol28.0004 Epub Jun 02, 2014
Submitted: Aug 31, 2013
Accepted for publication: Dec 16, 2013 Last revision: Jan 13, 2014
Original research
Prosthodontics
1
lative and retained weight percentages from passes through one and two sieves, respectively. However, these methods may not be reliable if the sieve diam-eter does not closely approximate the degree of sam-ple comminution.1
The test food employed in MP assessment should not be sticky, dificult to chew, or affected by saliva, and it must remain stable during storage at room temperature.11 The use of natural test foods, such
as oilseed, has been discontinued due to their high solubility during mastication, instability over time, and dificulty of homogenizing their fracture forces and deformation throughout their structures.11 The
Optosil® (Heraeus Kulzer, Hanau, Germany) family
of artiicial (polydimethylsiloxane) test foods is con-sidered to be suitable,1,2,4,5,6,9,10,11,12,13,14,15 as it has pro-duced results with validated correlations with other masticatory factors, such as the number of occlusal pairs and bite force.3,4,5,6 However, few studies have properly evaluated the reproducibility of results obtained with Optosil® products [Optosil® 1980,9,12
Optosil P Plus®,4 and Optosil Comfort®13,14,15 (OC)].
Interestingly, the use of 5.6-mm Optosil® cubes4,9,12
yielded a lower X50 value than that obtained with
OC13,14,15 in dentate subjects. Moreover, studies of OC have been conducted with larger samples than have those of previous versions of this material.
As test food confection and masticatory tests are time consuming and require speciic labora-tory equipment,1 evaluation of a small sample may
be inevitable, but it affects the reliability of esti-mates of random error. Unpredictably, random error leads to over- or underestimation of the true value of a variable, and may impact the accuracy of differences observed between groups.16 Thus,
the aim of this study was to evaluate the reproduc-ibility of MP test results obtained with OC using the single, double, and multiple sieve methods in dentate subjects.
Methodology
Participants
The study sample comprised 20 randomly selected dental students (5 men, 15 women) with a mean age of 23.3 ± 0.7 years. Inclusion criteria were good gen-eral health, normal BMI (18.5-24.9 kg/m2), presence
of all natural teeth (without consideration of third molars), and normocclusion. Dietary regimes, lacta-tion or pregnancy, neuromuscular problems, xeros-tomy (visually evaluated), orofacial or dental pain, periodontal disease, occlusal caries, severe dental wear, and orthodontic treatment in the last 3 years served as exclusion criteria. Gender was not balanced in the sample because no inluence of this variable has been observed in dentate subjects.1
The required sample size (n = 11.9) was calculated with a two-tailed paired Student’s t-test (α = 0.05) using the mean and standard deviation (0.29 ± 0.32) of X50 differences obtained in a pilot study in which
10 subjects selected according to similar criteria per-formed two MP time trials weekly. The pilot study also proved the absence of a learning curve during MP test execution, as repeated-measures analysis of variance revealed no difference in successive mea-sures obtained in nine time trials (p = 0.869). The Eth-ics Committee of Universidade Potiguar approved the research protocol (no. 189.770) and all participants provided written informed consent.
MP testing
OCwas manipulated according to the manufac-turer’s instructions to produce cubes with 5.6-mm edges in metal molds. After the material had set, the cubes were stored in an oven at 60 °C for 16 h to ensure complete polymerization.
Participants executed three MP trials administered in the morning by the same examiner at 1-week inter-vals, and one trial each administered by two addi-tional examiners. Each participant was instructed to chew a portion of 17 cubes (3.4 g) in a habitual manner.13 Although most patients are not familiar
with the test food or details of proper test execution, participants received no pre-test training to enable assessment of the true reproducibility of results. No feedback control was used to avoid disequilibrium in the conscious/unconscious nature of the mastica-tory process and consequent oscillations in bite force and chewing rate.2 After 20 chewing cycles, counted
Sánchez-Ayala A, Vilanova LSR, Costa MA, Farias-Neto A
particles were stored in an oven at 80 °C for 25 min. The material was then passed through a stack of up to 10 sieves with apertures ranging from 0.50 mm to 5.60 mm in a sieving machine (Bertel Indústria Metalúrgica Ltda., Caieiras, Brazil) for 20 min. The particles retained on each sieve were weighed on a 0.001-g analytical balance (Mark 2060; Bel Engineer-ing, Lombardy, Italy).14
Data processing
MP was described by the calculation of X50
values using the nonlinear regression equation Q
W –
(X) = 1 – 2 – (X /X50)b, where Q W
–
is the cumulative weight percentage of particles smaller than X or passing through a certain sieve aperture, X50 is the
aperture of a theoretical sieve through which 50% of the weight can pass, and b is the broadness variable.6
Q
W –
data obtained with the multiple sieve method were used to determine the real weight percentage of comminuted test food passing through each sieve, deined as the mastication performance index (MPI).1
To obtain double-sieve data, the index of masticatory eficiency (IME) was calculated using the empirical formula IME = 100 [1 − (X + Y) / (2T − X)], where X and Y are the weights of particles retained in the first (coarse fraction) and second (medium frac-tion) sieves, respectively; and T is the total weight of masticated particles.10 This calculation used data
obtained by multiple sieving, grouped into coarse and medium fractions.
Statistical analysis
Data were analyzed with SPSS® software (ver. 20;
IBM, Armonk, USA) using two-tailed tests and a 5% signiicance level. Mean X50, b, MPI, and IME values
were calculated for each subject. The X20/X80 ratio
obtained with the multiple sieve method was also used to indicate the degree of variation in particle size within the distribution. Assumptions of normal-ity and homogenenormal-ity of variance explored with the Shapiro–Wilk and Levene tests, respectively, were not met. Friedman’s test and non-parametric multi-ple comparisons were thus used to estimate differ-ences among time trials.
Reproducibility was examined by calculating intra-class correlation coeficients (ICCs). Intra-examiner
reproducibility was assessed by comparing data from the three MP trials administered by the same exam-iner. To determine inter-examiner reproducibility, results from the third time trial performed by the irst examiner were compared with data from the second and third examiners. The method of moments esti-mator (MME) σr = [ ∑ ni = 1(di – d
_
)2]/2(n – 1)was used
to evaluate the accuracy of estimates of random (σ) and “true” (standard deviation) error, where di is the
difference in measurements from each time trial, n is the number of cases, and d
_
is the mean of differ-ences. Ninety-ive percent conidence intervals were also calculated.16
Results
Table 1 presents data obtained by examiners using the single (MPI), double (IME), and multiple (X50, b,
X20/X80) sieve methods. No difference was observed
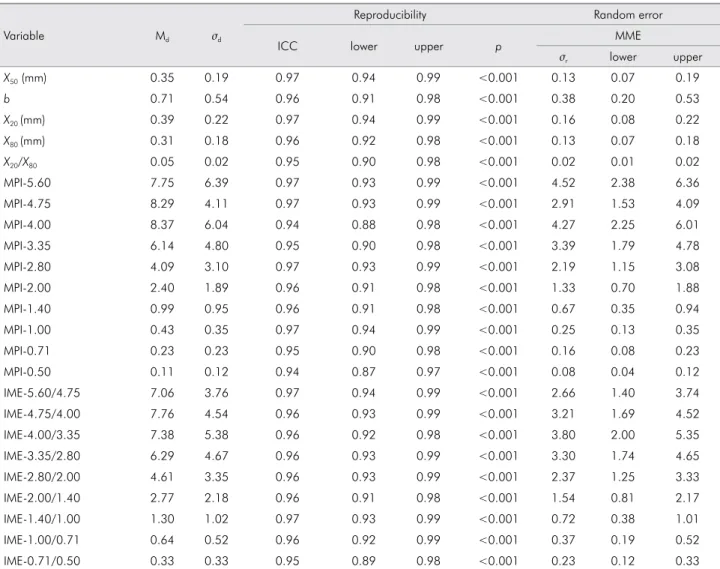
among the three time trials administered by the irst examiner, excepting a larger MPI-4.00 mm value in trial 1 than in trial 2 (p = 0.022). No difference was found between data from the irst examiner’s trial 3 and the single trials administered by the second and third examiners. The intra-examiner reproducibil-ity of all data was high (ICC ≥ 0.92, p < 0.001), with the exception of moderate reproducibility for MPI-0.50 mm (ICC = 0.89, p < 0.001; Table 2). Inter-exam-iner reproducibility was high for all three methods (ICC > 0.93, p < 0.001; Table 3).
Average means of absolute differences (AMADs) among repeated measurements were < 1 mm for the multiple sieve method. For the single and double sieve methods, AMADs were < 1% only for MPI-0.50–MPI-1.4 mm and IME-0.71/0.50–IME-1.40/1.00 mm, respectively. All multiple sieve variables had random errors < 1 mm, but the single and double sieve methods yielded similar errors only for sieves with smaller apertures (Tables 2 and 3). The largest intra- and inter-examiner random error values were for MPI-5.6 and MPI-4.0 mm, respectively.
Discussion
The results of MP testing with OC using the three methods investigated were highly reproduc-ible. These indings are similar to those of Olthoff et al.,12 who reported high intra-examiner
reproduc-3
ro
d
u
ci
bi
lit
y o
f a
s
ili
co
n
e-ba
se
d t
es
t f
oo
d t
o m
as
tic
at
or
y p
er
fo
rm
an
ce
e
v
al
u
at
io
n
b
y di
ffe
re
n
t s
ie
v
e m
et
h
od
s
table 1. Means and standard deviations (σ) of variables from five time trials, according to the multiple sieve method (n = 20).
First examiner Second examiner Third examiner
Variable Trial 1 Trial 2 Trial 3† p Single trial Single trial p
Mean σ Mean σ Mean σ Mean σ Mean σ
X50 (mm) 4.74 1.01 4.89 0.97 4.76 1.15 0.212 4.83 1.02 4.72 0.99 0.638
b 4.13 1.88 4.02 2.09 4.13 2.12 0.522 3.99 1.83 3.97 1.98 0.638
X20 (mm) 3.54 1.10 3.51 1.07 3.54 1.30 0.247 3.57 1.14 3.47 1.10 0.212
X80 (mm) 5.92 0.92 6.19 0.75 5.99 0.92 0.058 6.08 0.84 5.97 0.85 0.819
X20/X80 0.59 0.10 0.56 0.12 0.57 0.13 0.350 0.57 0.11 0.57 0.11 0.522
MPI-5.60 66.34 27.19 61.31 25.31 62.46 28.42 0.086 62.56 24.64 66.38 23.28 0.212
MPI-4.75 49.08 24.60 45.38 21.54 48.44 25.99 0.212 47.17 23.48 47.56 22.01 0.951
MPI-4.00 39.02A 21.61 33.39B 17.71 37.84AB 22.38 0.022* 34.14 19.49 36.58 20.28 0.086
MPI-3.35 22.37 13.67 21.46 14.69 24.59 17.17 0.212 22.02 16.02 22.37 16.73 0.522
MPI-2.80 14.45 9.24 13.94 10.62 15.83 12.79 0.368 14.36 12.09 14.98 13.36 0.705
MPI-2.00 5.72 4.23 6.00 5.59 6.59 6.40 0.854 6.49 6.41 7.14 8.04 0.522
MPI-1.40 2.06 1.56 2.39 2.40 2.61 2.82 0.504 2.59 3.12 2.93 3.48 0.354
MPI-1.00 1.03 0.85 1.04 1.12 1.15 1.27 0.941 1.18 1.49 1.17 1.59 0.833
MPI-0.71 0.51 0.47 0.42 0.47 0.49 0.54 0.168 0.56 0.73 0.53 0.82 0.401
MPI-0.50 0.26 0.27 0.17 0.23 0.21 0.23 0.239 0.25 0.34 0.22 0.33 0.811
IME-5.60/4.75 65.88 22.96 63.07 21.29 64.17 24.90 0.212 64.44 21.91 65.89 20.83 0.819
IME-4.75/4.00 55.48 23.38 51.30 20.79 54.03 24.81 0.047 52.02 21.97 54.11 21.78 0.522
IME-4.00/3.35 41.32 19.72 38.70 19.48 41.79 22.74 0.247 39.11 20.66 40.40 20.61 0.287
IME-3.35/2.80 28.43 15.83 27.21 17.13 29.84 19.85 0.165 27.65 18.10 28.21 18.85 0.705
IME-2.80/2.00 16.81 10.47 16.45 12.23 17.87 13.93 0.692 16.99 13.08 17.74 14.47 0.705
IME-2.00/1.40 7.15 5.10 7.61 6.90 8.16 7.68 0.504 8.12 7.85 8.80 9.03 0.287
IME-1.40/1.00 2.97 2.27 3.31 3.32 3.53 3.75 0.692 3.58 4.20 3.86 4.51 0.661
IME-1.00/0.71 1.50 1.24 1.46 1.57 1.57 1.73 0.785 1.71 2.13 1.66 2.30 0.790
IME-0.71/0.50 0.75 0.70 0.60 0.70 0.68 0.75 0.662 0.80 1.05 0.74 1.12 0.379
†The primary examiner’s trial 3 was selected randomly for comparison with the second and third examiners. *Values with the same letter differ significantly among trials (p < 0.05).
Br
az O
ra
l R
es
., (
São
P
au
lo
) 20
14
;28
(1)
Sánchez-Ayala A, Vilanova LSR, Costa MA, Farias-Neto A
ibility in a study of dentate subjects who executed seven trials each with eight 8-mm Optosil® cubes.
They found no difference in X50 values calculated
three times per day on 3 different days separated by ~2-week intervals. Slagter et al.9 found no signiicant intra-examiner variability in data from seven trials employing 17 5.6-mm Optosil® cubes in dentate
sub-jects and complete denture wearers. Lujan-Climent et al.4 reported an ICC of 0.97 and minimum
detect-able difference of 0.4 mm for X50 values obtained from
nine dentate subjects who chewed three-quarters of Optosil P Plus® tablets (5-mm thickness, 20-mm
diameter) in ive time trials. Using peanuts and the single sieve method, Hatch et al.3 obtained an ICC of
0.78 for inter-examiner reliability of MPI-2 mm val-ues. Edlund and Lamm10 controlled the double sieve
method by averaging 10 successive repeated mea-surements obtained from four subjects performing four trials at 3-day intervals. These researchers and others have concluded that averaging of ive17 or the
best four of ive10 repeated measurements is
neces-sary to adequately determine masticatory eficiency in a study population.
The observed difference in MPI-4 mm values between trials 1 and 2 may be related to the suscepti-bility of the single sieve method to chance luctuations in the weight of cumulated (passable) or retained par-ticles in sieves.1 Not all particles can be comminuted
table 2. Intra-examiner reproducibility and random error in average means of absolute differences, according to the multiple sieve method (n = 60).
Reproducibility Random error
Variable Md σd
ICC lower upper p MME
σr lower upper
X50 (mm) 0.27 0.15 0.98 0.96 0.99 <0.001 0.11 0.06 0.15
b 0.63 0.43 0.97 0.94 0.99 <0.001 0.30 0.16 0.42
X20 (mm) 0.35 0.29 0.97 0.93 0.99 <0.001 0.20 0.11 0.29
X80 (mm) 0.34 0.23 0.95 0.89 0.98 <0.001 0.16 0.09 0.23
X20/X80 0.06 0.04 0.92 0.83 0.97 <0.001 0.03 0.02 0.04
MPI-5.60 8.53 5.06 0.97 0.94 0.99 <0.001 3.58 1.89 5.04
MPI-4.75 7.63 5.02 0.97 0.94 0.99 <0.001 3.55 1.87 4.99
MPI-4.00 7.03 3.90 0.97 0.93 0.99 <0.001 2.76 1.45 3.89
MPI-3.35 5.59 3.91 0.96 0.91 0.98 <0.001 2.77 1.46 3.90
MPI-2.80 3.88 3.33 0.95 0.90 0.98 <0.001 2.36 1.24 3.32
MPI-2.00 1.82 2.05 0.95 0.89 0.98 <0.001 1.45 0.77 2.05
MPI-1.40 0.87 1.04 0.93 0.85 0.97 <0.001 0.73 0.39 1.03
MPI-1.00 0.36 0.43 0.94 0.88 0.98 <0.001 0.30 0.16 0.42
MPI-0.71 0.19 0.19 0.93 0.86 0.97 <0.001 0.14 0.07 0.19
MPI-0.50 0.12 0.12 0.89 0.76 0.95 <0.001 0.08 0.04 0.12
IME-5.60/4.75 6.08 3.38 0.98 0.96 0.99 <0.001 2.39 1.26 3.36
IME-4.75/4.00 6.60 2.93 0.98 0.96 0.99 <0.001 2.07 1.09 2.92
IME-4.00/3.35 6.25 3.39 0.98 0.95 0.99 <0.001 2.40 1.26 3.37
IME-3.35/2.80 5.62 3.28 0.97 0.94 0.99 <0.001 2.32 1.22 3.26
IME-2.80/2.00 3.87 3.12 0.97 0.93 0.99 <0.001 2.20 1.16 3.10
IME-2.00/1.40 2.14 2.25 0.96 0.91 0.98 <0.001 1.59 0.84 2.24
IME-1.40/1.00 1.12 1.27 0.94 0.88 0.97 <0.001 0.90 0.47 1.27
IME-1.00/0.71 0.51 0.54 0.95 0.89 0.98 <0.001 0.38 0.20 0.54
IME-0.71/0.50 0.28 0.28 0.93 0.84 0.97 <0.001 0.20 0.10 0.28
ICC: intraclass correlation coefficient; MME: method of moments estimator.
5
table 3. Inter-examiner reproducibility and random error in average means of absolute differences, according to the multiple sieve method (n = 60).
Reproducibility Random error
Variable Md σd
ICC lower upper p MME
σr lower upper
X50 (mm) 0.35 0.19 0.97 0.94 0.99 <0.001 0.13 0.07 0.19
b 0.71 0.54 0.96 0.91 0.98 <0.001 0.38 0.20 0.53
X20 (mm) 0.39 0.22 0.97 0.94 0.99 <0.001 0.16 0.08 0.22
X80 (mm) 0.31 0.18 0.96 0.92 0.98 <0.001 0.13 0.07 0.18
X20/X80 0.05 0.02 0.95 0.90 0.98 <0.001 0.02 0.01 0.02
MPI-5.60 7.75 6.39 0.97 0.93 0.99 <0.001 4.52 2.38 6.36
MPI-4.75 8.29 4.11 0.97 0.93 0.99 <0.001 2.91 1.53 4.09
MPI-4.00 8.37 6.04 0.94 0.88 0.98 <0.001 4.27 2.25 6.01
MPI-3.35 6.14 4.80 0.95 0.90 0.98 <0.001 3.39 1.79 4.78
MPI-2.80 4.09 3.10 0.97 0.93 0.99 <0.001 2.19 1.15 3.08
MPI-2.00 2.40 1.89 0.96 0.91 0.98 <0.001 1.33 0.70 1.88
MPI-1.40 0.99 0.95 0.96 0.91 0.98 <0.001 0.67 0.35 0.94
MPI-1.00 0.43 0.35 0.97 0.94 0.99 <0.001 0.25 0.13 0.35
MPI-0.71 0.23 0.23 0.95 0.90 0.98 <0.001 0.16 0.08 0.23
MPI-0.50 0.11 0.12 0.94 0.87 0.97 <0.001 0.08 0.04 0.12
IME-5.60/4.75 7.06 3.76 0.97 0.94 0.99 <0.001 2.66 1.40 3.74
IME-4.75/4.00 7.76 4.54 0.96 0.93 0.99 <0.001 3.21 1.69 4.52
IME-4.00/3.35 7.38 5.38 0.96 0.92 0.98 <0.001 3.80 2.00 5.35
IME-3.35/2.80 6.29 4.67 0.96 0.93 0.99 <0.001 3.30 1.74 4.65
IME-2.80/2.00 4.61 3.35 0.96 0.93 0.99 <0.001 2.37 1.25 3.33
IME-2.00/1.40 2.77 2.18 0.96 0.91 0.98 <0.001 1.54 0.81 2.17
IME-1.40/1.00 1.30 1.02 0.97 0.93 0.99 <0.001 0.72 0.38 1.01
IME-1.00/0.71 0.64 0.52 0.96 0.92 0.99 <0.001 0.37 0.19 0.52
IME-0.71/0.50 0.33 0.33 0.95 0.89 0.98 <0.001 0.23 0.12 0.33
ICC: Intraclass correlation coefficient; MME: method of moments estimator. Time trial no. 3 of primary examiner randomly selected for comparison to second and third examiners.
simultaneously during mastication; rather, some parti-cles are selected variably while whole partiparti-cles remain intact (selection function).9 This process depends on the dynamics of the multi-compartment system of the mouth. Comminution occurs in at least one com-partment (i.e., on the molars), but not necessarily in other compartments (e.g., interproximal spaces). After a bolus has been swallowed, the residual material in the mouth contains particles > 4 mm.18 The multiple
sieve method and, to some extent, the double sieve method enable chance luctuations in weight to be cancelled out during data analysis because a small weight percentage cumulated or retained in one sieve may be compensated by a large percentage in another.1
Despite the high reproducibility demonstrated in this study, the masticatory values obtained with the three methods were lower than those previously reported.4,9,12 These differences may be related to ana-tomical or physiological differences among study populations.3,4 They are not likely related to
Sánchez-Ayala A, Vilanova LSR, Costa MA, Farias-Neto A
particle size distribution represented by b and X20/X80,
respectively, were higher than previously reported.9 However, the relationships between these variables and X50 were maintained (ρ = 0.847 and 0.874,
respec-tively). Increasing b values correspond to nonlinear regression curves with steeper slopes, and thus to narrower distributions of particle size.1,12 Similarly,
when X20 and X80 are close to X50, the greatest
cumu-lative weight percentages correspond to near-X50
sieves. Thus, the comminuted particles in the present study were of similar sizes (regardless of comminu-tion degree) because masticacomminu-tion was not focused on a few cubes, which depends on synchrony between soft-tissue and mandibular movements.2 When more
comminution is acheived, the curves are near 0 on the X axis, regardless of the slope.
Although the multiple sieve method includes processing according to simpler methods, the three methods examined here are not necessarily equally suitable for the measurement of MP.1 Springate16
rec-ommended the use of the MME instead of the
con-ventionally used Dahlberg’s formula to estimate ran-dom error, unless the absence of bias among replicate measurements can be demonstrated with certainty. The low error values obtained in this study for mul-tiple sieve data and single and double sieve data for sieves with small apertures may be explained by the cumulated or retained weight luctuations and differences in selection function described above. Thus, the reproducibility results enable research-ers to select a method according to their needs. For larger samples or epidemiological studies requiring only the assessment of differences among popula-tions, simpler methods may be used. For more spe-ciic studies requiring explanation of changes in MP, the multiple sieve method may be more appropriate.1
conclusion
The use of the artiicial test food OCfor MP mea-surement using the single, double, and multiple sieve methods generated highly reproducible results in dentate subjects.
References
1. van der Bilt A, Fontijn-Tekamp FA. Comparison of single and multiple sieve methods for the determination of masticatory
performance. Arch Oral Biol. 2004 Mar;49(3):193-8.
2. Sánchez-Ayala A, Farias-Neto A, Campanha NH, Garcia RC. Relationship between chewing rate and masticatory
perfor-mance. Cranio. 2013 Apr;31(2):118-22.
3. Hatch JP, Shinkai RS, Sakai S, Rugh JD, Paunovich ED. De -terminants of masticatory performance in dentate adults.
Arch Oral Biol. 2001 Jul;46(7):641-8.
4. Lujan-Climent M, Martinez-Gomis J, Palau S, Ayuso-Montero
R, Salsench J, Peraire M. Influence of static and dynamic oc -clusal characteristics and muscle force on masticatory
perfor-mance in dentate adults. Eur J Oral Sci. 2008 Jun;116(3):229-36. 5. Sánchez-Ayala A, Campanha NH, Garcia RC. Relationship
between body fat and masticatory function. J Prosthodont.
2013 Feb;22(2):120-5.
6. Carretero D, Sánchez-Ayala A, Rodriguez A, Lagravère MO, Gonçalves TM, Garcia RC. Relationship between non-ulcer-ative functional dyspepsia, occlusal pairs and masticatory performance in partially edentulous elderly persons.
Ger-odontology. 2011 Dec;28(4):296-301.
7. Yamazaki T, Yamori M, Asai K, Nakano-Araki I, Yamaguchi A, Takahashi K, et al. Mastication and risk for diabetes in
a Japanese population: a cross-sectional study. PLoS One. 2013 Jun 5;8(6):e64113.
8. Takeuchi N, Ekuni D, Tomofuji T, Morita M. Relationship
between masticatory performance and heart rate variability:
a pilot study. Acta Odontol Scand. 2013 May-Jul;71(3-4):807-12. 9. Slagter AP, Olthoff LW, Steen WH, Bosman F. Commi -nution of food by complete-denture wearers. J Dent Res.
1992 Feb;71(2):380-6.
10. Edlund J, Lamm CJ. Masticatory efficiency. J Oral Rehabil.
1980 Mar;7(2):123-30.
11. van Der Glas HW, Al-Ibrahim A, Lyons MF. A stable artifi -cial test food suitable for labeling to quantify selection and
breakage in subjects with impaired chewing ability. J Texture Stud. 2012 Aug;43(4):287-98.
12. Olthoff LW, van der Bilt A, Bosman F, Kleizen HH. Distribu -tion of particle sizes in food comminuted by human
mastica-tion. Arch Oral Biol. 1984;29(11):899-903.
13. Gomes SGF, Del Bel Cury AA, Garcia RCMR. Effect of hy -posalivation on mastication and mandibular movements
during speech. Braz Oral Res. 2011 Jul-Aug;25(4):351-6.
14. Gonçalves TM, Sanchez-Ayala A, Ambrosano GM, Garcia RC. Female hormonal fluctuation and masticatory function in patients with disc displacement-a case-control study. Int J Prosthodont. 2011 Jul-Aug;24(4):320-7.
15. Eberhard L, Schindler HJ, Hellmann D, Schmitter M, Ram
-melsberg P, Giannakopoulos NN. Comparison of
particle-7
size distributions determined by optical scanning and by
sieving in the assessment of masticatory performance. J Oral
Rehabil. 2012 May;39(5):338-48.
16. Springate SD. The effect of sample size and bias on the reli
-ability of estimates of error: a comparative study of
Dahl-berg’s formula. Eur J Orthod. 2012 Apr;34(2):158-63.
17. Omar SM, McEwen JD, Ogston SA. A test for occlusal func -tion. The value of a masticatory efficiency test in the
assess-ment of occlusal function. Br J Orthod. 1987 Apr;14(2):85-90. 18. Flynn CS, Foster KD, Bronlund JE, Lentle RG, Jones JR, Mor -genstern MP. Identification of multiple compartments