DECISION ANALYSIS FOR THE EXPLORATION OF GAS RESERVES: MERGING TODIM AND THOR
Carlos Francisco Simões Gomes
Ibmec/RJ
Rio de Janeiro – RJ, Brazil [email protected]
Luiz Flávio Autran Monteiro Gomes*
Ibmec/RJ
Rio de Janeiro – RJ, Brazil [email protected]
Francisco José Coelho Maranhão
OGX Oil and Gas
Rio de Janeiro – RJ, Brazil [email protected]
* Corresponding author / autor para quem as correspondências devem ser encaminhadas Recebido em 11/2008; aceito em 01/2010 após 1 revisão
Received November 2008; accepted January 2010 after one revision
Abstract
This article approaches the problem of selecting the non-dominated alternative for the destination of the natural gas reserves in the Mexilhão field in the Santos Basin, Brazil. Major aims of the case study reported here were to create a mechanism for assisting in the process of analyzing and selecting the best options for the destination of natural gas, and to enable the decision agent to choose the investment options best aligned to the expectations and objectives observed in the company strategies. The decision analysis employed in the study made use of the TODIM method and the THOR multicriteria decision support system. The application of both demonstrated that a decision analytic framework can be extremely useful when recommending options for upstream projects, owing to the fact that it can clearly identify the most important alternatives in the face of the scenarios tested and in relation to the criteria expressed.
Keywords: energy resources in Brazil; multicriteria decisions; prospect theory.
Resumo
Este artigo tem como propósito selecionar a melhor alternativa para usar o gás natural proveniente das reservas do campo de Mexilhão existente na Bacia de Santos. O principal objetivo do estudo é a criação de mecanismos que permitam a análise e posteriormente possibilitem a escolha da alternativa não-dominada de destinação do gás natural; e dar apoio ao decisor na seleção da melhor alternativa de investimento considerando as expectativas e os objetivos estratégicos da companhia. O estudo é feito fazendo uma comparação das sugestões a partir dois sistemas, um implementando o Método THOR e outro o método TODIM. A aplicação simultânea dos métodos permite auxiliar o decisor neste processo em função dos cenários e dos conjuntos de critérios identificados.
1. Introduction
The problem approached in this article was the selection of the non-dominated alternative for the destination of the natural gas reserves recently discovered in the Santos basin, more specifically in the Mexilhão field (British Petroleum, 2006). Although various alternatives can be considered, from the point of view of a potential investor the level of information on the possible consequences of each alternative generally leaves a lot to be desired and does not take into account some fundamental aspects. In this way, the decision criteria traditionally used in a problem of this nature only focus on some features such as: the return, the price, volumes, cost and investment – basically economic and financial aspects. However, they do not consider other equally important features, such as: political and economic stability, the regulatory environment, the tax regime or supply and demand among others. On the other hand, the decision making process must meet the important objective according to which, whatever the option chosen, the best must be made of the opportunity, without damaging the strategic position of the decision agent – whether private investor or government –, and without ignoring other consequent opportunities or taking into consideration the totality of relevant decision criteria.
The methodology utilized in this article for solving that problem is Decision Analysis. Two analytical methods of multicriteria decision aiding are then chosen from the toolbag of that branch of Operations Research. These two methods are later on combined in order to lead to an integrated recommendation for decision makers. The case is described in section 2. Key aspects of the TODIM method and the THOR system are presented in section 3. The decision analyses with TODIM and with THOR are shown in section 4. The discussion of results and conclusions are presented in sections 5 and 6, respectively.
Two previous papers (Gomes & Maranhão, 2008; Gomes, Rangel & Maranhão, 2009) tackled the same problem by using the TODIM method only and comparing its use against the existing, traditional practice in the company. A number of elements of this article were therefore present in these two previous papers. However, this article broadens the scope of the analysis by demonstrating how both TODIM and THOR can be combined aiming at producing useful recommendations.
2. The Case Study
The Mexilhão field is one of the most significant discoveries of natural gas located in the old Block BS-400, in the Santos Basin, in Brazil. The field is located in an extremely favorable position, situated on the coast of São Paulo, around 165 kilometers from the coast at a water depth (depth between the surface and seabed) of between 320 and 550 meters. The natural gas reserves in Mexilhão are of the order of 2.52 tcf (trillion cubic feet), with associated oil reserves of around 10 mmbbl (million barrels).
On first drilling the 1BRSA-0220 well, oil was initially found. The Brazilian Oil Company (Petrobras) notified the Brazilian Regulatory Agency for Petroleum of this discovery on 5th August, 2003, while the well was still being drilled.
At the time of the discovery, the domestic market for natural gas was not developed and did not present a geographical area of consumption which required this additional supply in the short to medium term. However, various events have contributed significantly to growth in demand for natural gas, both in Brazil and in the South American Region. Events such as the industrial growth in Brazil in recent years, the potential critical shortage of hydroelectric energy in future years, the crisis with Bolivia and the energy crisis in Argentina, an increase in the world demand for natural gas before the recent economic crisis and led principally by the United States of America, etc, have resulted in a review of the plans for the destination of these reserves.
The specific objectives of this case study therefore are: (1) to create a mechanism which helps in the process of analyzing and selecting the non-dominated alternatives for the destination of the natural gas recently discovered in the Santos Basin, more specifically in the Mexilhão field; (2) to allow the decision agent to choose investment options more aligned with the expectations and objectives, observing the company strategies; and (3) allow the decision agent to identify in a more systematic, clear and wide-ranging way, new opportunities in the markets where it acts, considering a wider and more diversified base of the main aspects which must influence the choice or recommendation. The decision makers in this case study are top executives of the company. They understood the meaning of weights in both methods. They carried out an analysis of risks and they also understood the meaning of political influence. They new the company strategy and they shared the same opinion about the decision process. Primary data utilized in this case study were the same presented in Gomes & Maranhão (2008) and Gomes, Rangel & Maranhão (2009). For more details on the case study, including a map, we refer the reader to Gomes & Maranhão (2008) and to Gomes, Rangel & Maranhão (2009).
Similar to other multicriteria methods both in TODIM and THOR weights are non-negative numbers that are assigned to criteria or to alternatives for giving the relative importance of those; the higher the weight, the more important the criterion or the alternative. When weights are assigned to criteria they are therefore independent from the measurement units of the criteria (Brans & Mareschal, 2005).
The next section explains the analytical methods used in the decision analysis for the problem in question.
3. Methodology
3.1 The TODIM Method
The TODIM method (an acronym in Portuguese of Interactive and Multicriteria Decision Making) is a discrete multicriteria method founded on Prospect Theory (Kahneman & Tversky, 1979). This means that, underlying the method, there is a psychological theory; one of the two authors of that theory won indeed the Nobel Prize for Economics in 2002 (Roux, 2002). While some discrete multicriteria methods assume that the decision maker always looks for the solution corresponding to the maximum of some global measure of value – for example, the highest possible value of a multiattribute utility function, in the case of MAUT (Keeney & Raiffa, 1993) –TODIM makes use of a global measurement of value calculable by the application of Prospect Theory. In this way, the method is based on a description, proved by empirical evidence, of how people effectively make decisions in the face of risk. Although not all multicriteria problems deal with risk, the shape of the value function of TODIM is the same as the value function of Prospect Theory. The multiattribute value function of TODIM is built in parts, with their mathematical descriptions reproducing that gain/loss function. The global multiattribute value function of TODIM therefore aggregates all measures of gains and losses over all criteria. Attitudes towards risk in human decision making have been analyzed also by a number of authors (He & Huang, 2008; Huber, Viscusi & Bell, 2008; Jou et al., 2008; Kumar & Lim, 2008).
The concept of introducing expressions of losses and gains in the same multiattribute function, present in the formulation of TODIM, gives this method some similarity to the PROMÉTHÉE methods, which make use of the notion of net outranking flow (Brans & Mareschal, 1990). TODIM indeed maintains a similarity with outranking methods, because the global value of each alternative is relative to its dominance over other alternatives in the set. In its calculations the TODIM method must test specific forms of the losses and gains functions. Each one of the forms depends on the value of one single parameter. The forms, once validated empirically, serve to construct the additive difference function of the method. This notion of an additive utility function is taken from Tversky (1969). From the construction of that additive difference function, which performs as a multiattribute value function and, as such, must also have its use validated by the verification of the condition of mutual preferential independence (Clemen & Reilly, 2001), the method leads to a global ordering of the alternatives. It can be observed that the construction of the multiattribute value function, or additive difference function, of the TODIM method is based on a projection of the differences between the values of any two alternatives (perceived in relation to each criterion) to a reference criterion.
The TODIM method makes use of paired comparisons between the decision criteria, using technically simple resources to eliminate occasional inconsistencies arising from these comparisons. It also allows value judgments to be carried out in a verbal scale, using a criteria hierarchy, fuzzy value judgments and making use of interdependence relationships among the alternatives. It is a non-compensatory method in the sense that tradeoffs are not dealt with in the modeling process (Bouyssou, 1986).
After the definition of these elements, experts are asked to estimate, for each one of the qualitative criteria c, the contribution of each alternative i to the objective associated with the criterion. This method requires the values of the evaluation, of the alternatives in relation to the criteria, to be numerical and to be normalized; consequently the qualitative criteria evaluated in a verbal scale are transformed into a cardinal scale. The evaluations of the quantitative criteria are obtained from the performance of the alternatives in relation to the criteria, such as, for example, the level of noise measured in decibels, the power of an engine measured in horsepower or a student’s mark in a subject etc.
TODIM can therefore be used for qualitative as well as quantitative criteria. Verbal scales of qualitative criteria are converted to cardinal ones and both types of scales are normalized. The relative measure of dominance of one alternative over another is found for each pair of alternatives. This measure is computed as the sum over all criteria of both relative gain/loss values for these alternatives. The parts in this sum will be either gains, losses, or zeros, depending on the performance of each alternative with respect to every criterion.
The evaluation of the alternatives in relation to all the criteria produces the matrix of evaluation, where the values are all numerical. Their normalization is then performed, using, for each criterion, the division of the value of one alternative by the sum of all the alternatives. This normalization is carried out for each criterion, thus obtaining a matrix, where all the values are between zero and one. It is called the matrix of normalized alternatives’ scores against criteria. The application of TODIM then proceeds towards the computation of the overall value for each alternative. This is accomplished by making use of expressions for the gain/loss branches of the prospect theoretical value function. The mathematical formulas embedded in TODIM have been presented elsewhere and will not be reproduced here (Gomes & Lima, 1992a; Gomes & Lima, 1992b; Trotta, Nobre, & Gomes, 1999; Rangel & Gomes, 2007; Gomes & Maranhão, 2008; Gomes & Rangel, 2009; Gomes, Rangel & Maranhão, 2009). An important parameter of TODIM is θ, the attenuation factor of the losses; different choices of θ lead to different shapes of the prospect theoretical value function in the negative quadrant. The global measures obtained of alternatives’ values computed by TODIM permit the complete rank ordering of all alternatives. A sensitivity analysis should then be applied to verify the stability of the results based on the decision makers’ preferences. The sensitivity analysis should therefore be carried out on θ as well as on the criteria weights, the choice of the reference criterion, and performance evaluations (Gomes & Rangel, 2009).
3.2 The THOR System
The Multicriteria Decision Support System used in this study was THOR (an acronym for AlgoriTmo Híbrido de ApoiO MulticritéRio à Decisão para Processos Decisórios com Alternativas Discretas – Multicriteria Decision Support Hybrid Algorithm for Decision Making Processes with Discrete Alternatives) which simultaneously aggregates the concepts of Rough Set Theory, Fuzzy Set Theory and Preference Theory (Gomes et al., 2008; Cardoso
et al., 2009). THOR is therefore a multicriteria decision support system for the ranking of discrete alternatives, which eliminates redundant criteria simultaneously considering if the information is dubious – when using Rough Set Theory – and if there is an increase in imprecision in the decision process – in which case Fuzzy Set Theory is used. In this way, imprecision is quantified, using it in the multicriteria decision support process.
because of their inherent subjectivity, cannot always be expressed in secure and precise ways. When using THOR, the simultaneous input of data into the process from multiple decision makers is also permitted, enabling these to express their judgment values in scales of ratios, intervals or ordinals, in addition to the execution of the decision making process without necessarily attributing weights to the criteria (Gomes, 2005; Cardoso et al., 2009).
The analytical modelling embedded in THOR is based on the ELECTRE methods of the French School of Multicriteria Decision Support. In this way, the following additional elements may be necessary for the application of THOR:
(i) a weight for each criterion, representing the relative importance among them; (ii) a preference threshold (p) and another for indifference (q) for each criterion; (iii) discordance;
(iv) pertinence of the values of the weights attributed to the criterion, as well as the pertinence of the classification of the alternative in the criterion.
Given two alternatives a and b, three situations can be considered when THOR is used: S1, S2 and S3. Situation S1 only takes into account the alternatives a for which a P b, with b being any other alternative. In this way, comparing a with b, we can identify the criteria in which a P b, taking into consideration the thresholds of preference (P designates strict preference and Q designates weak preference), indifference and discordance, checking if the condition imposed is satisfied. If satisfied, we know that a dominates b. The binary relations P, Q, and I are defined as below:
aPb ↔ g(a)–g(b) > + p (1)
aQb ↔ q < | g(a)–g(b) |≤ p (2)
aIb ↔ –q ≤| g(a)–g(b) |≤+ q (3)
g(.) designates one criterion.
We therefore have the following:
– Situation 1 (or S1):
1 1
( | ) ( | )
n n
j j j j j j j j
j j
w aP b w aQ b aI b aR b bQ a bP a
= =
> ∧ ∧ ∧ ∧
∑
∑
(4)– Situation 2 (or S2):
1 1
( | ) ( | )
n n
j j j j j j j j
j j
w aP b aQ b w aI b aR b bQ a bP a
= =
∧ > ∧ ∧ ∧
∑
∑
(5)– Situation 3 (or S3):
1 1
( | ) ( | )
n n
j j j j j j j j
j j
w aP b aQ b aI b w aR b bQ a bP a
= =
∧ ∧ > ∧ ∧
∑
∑
(6)In (4), (5), and (6) R stands for non-comparability; wj, where j = 1, 2, …, n, are criteria weights. It should be noted that the last two situations (S2 and S3) are less rigorous than the first (S1). This would lead to a smaller difference allowing one alternative to be classified better than another (Roy & Bouyssou, 1993).
This would then take into consideration the thresholds of preference, indifference and discordance. A checking would verify if the condition imposed is satisfied. If satisfied, we know that a dominates b. Afterwards, the criteria weights in which this condition was met are added. For another alternative c, the same procedure described previously is repeated. The final scoring of alternative a will be the sum of the values obtained. For the situation S2 the alternatives for which a P b and a Q b are taken into account. In situation S3, the alternatives for which a P b, a Q b and a l b are taken into account.
4. Modeling and Computations with TODIM and THOR
Before we proceed showing how the two methods were combined one must clarify that both THOR and TODIM are noncompensatory methods in the sense that tradeoffs do not occur (Bouyssou, 1986). Weights should in principle reflect to some extent the degrees of relative importance or strength as estimated by decision agents along a numerical scale, such as from 0 to 10. This scale can be either a linear, cardinal scale or a ratio scale. When TODIM is used a ratio scale, say from 1 to 9, is utilized in order to obtain the weights for every criterion. A comparatively high criterion weight increases the chance that an alternative well classified according to that criterion is positioned in a high global rank. Neverthless, in some cases a relatively high weight for any given criterion does not necessarily mean that this is one of the most important criteria. For instance, given two conflicting criteria for completing a project, cost and time for completion, a decision maker initially considers cost as the most important among the two criteria. He therefore assigns a weight to cost that is much higher than the weight of time for completion. This is so because he expects to save some money to be assigned to other projects. However, although some alternatives are close to reaching below 80% of the available budget, all alternatives are well above 90% of the time limit for completion. This is a typical situation in which an intracriteria analysis points out to the following fact: the criterion that had originally the smallest weight ends up being the most important between the two criteria.
Decision agents are considered experts in different aspects of the decision problem. Thus, for instance, a chosen expert in Social and Environmental Impacts is expected to be more able to compare alternative destinations in terms of potential hazards than on the basis of their Alignment with Company Strategy. One important role played by the decision analyst through the decision aiding process is to facilitate the elicitation of these weights via dialogues with the decision agents. Both methods follow a constructive approach to decision aiding. In other words: (i) weights are made explicit by decision agents on the basis of their estimate of degrees of relative importance or strength; and (ii) these weights may evolve during the decision analysis as new aspects of the problem emerge during the interactions between the decision analyst and the decision agents (Roy, 1985). The two methods therefore use the same set of weights. Those are either assigned to alternatives or to criteria, or obtained through paired comparisons between alternatives or criteria. As explained in the first section of this paper when the definition of weight was introduced, the higher the weight, the more important the criterion or the alternative.
In synthesis, the functions of these three levels, within the decision making process, are relatively clear: the first two have autonomy to recommend or propose project alternatives, which will be considered in the evaluation of the global portfolio of the company, the function of this prerogative belonging to the third and last level (Head-office). It is important to note that the same criteria, of an economic and financial nature, are used in a consistent way at all levels of the decision making process, demonstrating the existence of uniformity regarding the application. Nevertheless, the decision groups also consider other subjective aspects of a non-uniform manner, thus associating a certain degree of informality to the selection process.
In this way, the following steps were carried out for its application, as a simulation, in the decision making process:
(i) definition of criteria; (ii) pair comparison; (iii) valuing of the alternatives; (iv) sensitivity analysis; and
(v) comparison with the status quo, with a mathematical treatment related to the method at the relevant stages.
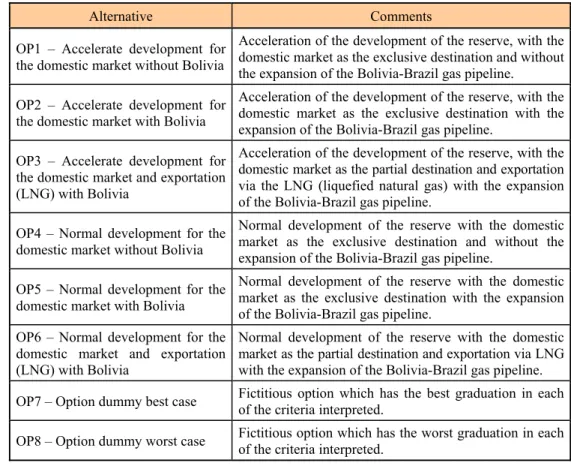
The alternatives presented are treated as options by the abbreviations OP1, OP2...OP8; information on these alternatives is to be found in Table 1 below:
Table 1 – Brief description of every alternative (Source: Gomes, Rangel & Maranhão, 2009).
Alternative Comments
OP1 – Accelerate development for the domestic market without Bolivia
Acceleration of the development of the reserve, with the domestic market as the exclusive destination and without the expansion of the Bolivia-Brazil gas pipeline.
OP2 – Accelerate development for the domestic market with Bolivia
Acceleration of the development of the reserve, with the domestic market as the exclusive destination with the expansion of the Bolivia-Brazil gas pipeline.
OP3 – Accelerate development for the domestic market and exportation (LNG) with Bolivia
Acceleration of the development of the reserve, with the domestic market as the partial destination and exportation via the LNG (liquefied natural gas) with the expansion of the Bolivia-Brazil gas pipeline.
OP4 – Normal development for the domestic market without Bolivia
Normal development of the reserve with the domestic market as the exclusive destination and without the expansion of the Bolivia-Brazil gas pipeline.
OP5 – Normal development for the domestic market with Bolivia
Normal development of the reserve with the domestic market as the exclusive destination with the expansion of the Bolivia-Brazil gas pipeline.
OP6 – Normal development for the domestic market and exportation (LNG) with Bolivia
Normal development of the reserve with the domestic market as the partial destination and exportation via LNG with the expansion of the Bolivia-Brazil gas pipeline.
OP7 – Option dummy best case Fictitious option which has the best graduation in each of the criteria interpreted.
The criteria were drawn from the writing on the subject and from consultations with a specialist in the sector, making up the list below: (a) Return; (b) Risk; (c) Social and Environmental Impact; (d) Technology Available; (e) Supply; (f) Demand; (g) Political Aspect; (h) Alignment with Company Strategy; (i) Tax Regulation (j) HSSE (Health Safety Security Environment) Regulation; (k) Price and Market Regulation; (l) Timing of Implementation.
After a detailed analysis of the original list of criteria, a new list of the same criteria was produced, now with minimized interdependencies. That detailed analysis was carried out having in mind the need to satisfy the independence conditions (Clemen & Reilly, 2001, p. 647-650). This resulted in the new set represented by: (A) Return vs. Risk; (B) Social and Environmental Impact of the Alternative; (C) Technology Available; (D) General Regulation (tax, HSSE, price, market); (E) Political Aspects; (F) Alignment with Company Strategy; (G) Demand vs. National Supply Balance; (H) Timing of Implementation of the option.
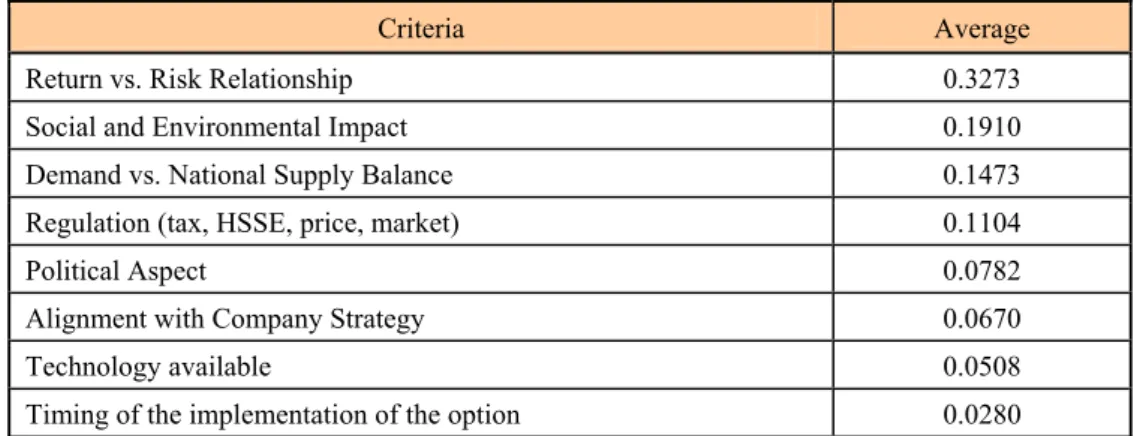
Next, an Excel® spreadsheet was validated among the members of the decision making groups, at their diverse levels, in relation to the decision in question, seeking the greatest simplicity possible in the handling and understanding of the terminology. The spreadsheet, composed of 3 columns and 28 lines, was distributed electronically to the 20 decision making agents in the organization tested. The columns at the extremities contain the criteria to be compared in pairs, resulting in 28 comparisons, using the Saaty scale (Saaty, 1994) solely in a verbal aspect. The quantitative aspect of the scale was used to translate the judgment values for the method which, afterwards, were reconverted into mathematical values and normalized. Table 2 presents the average of the criteria weights after normalization.
Table 2 – Average weights of criteria (Source: Gomes, Rangel & Maranhão, 2009).
Criteria Average
Return vs. Risk Relationship 0.3273
Social and Environmental Impact 0.1910
Demand vs. National Supply Balance 0.1473
Regulation (tax, HSSE, price, market) 0.1104
Political Aspect 0.0782
Alignment with Company Strategy 0.0670
Technology available 0.0508
Timing of the implementation of the option 0.0280
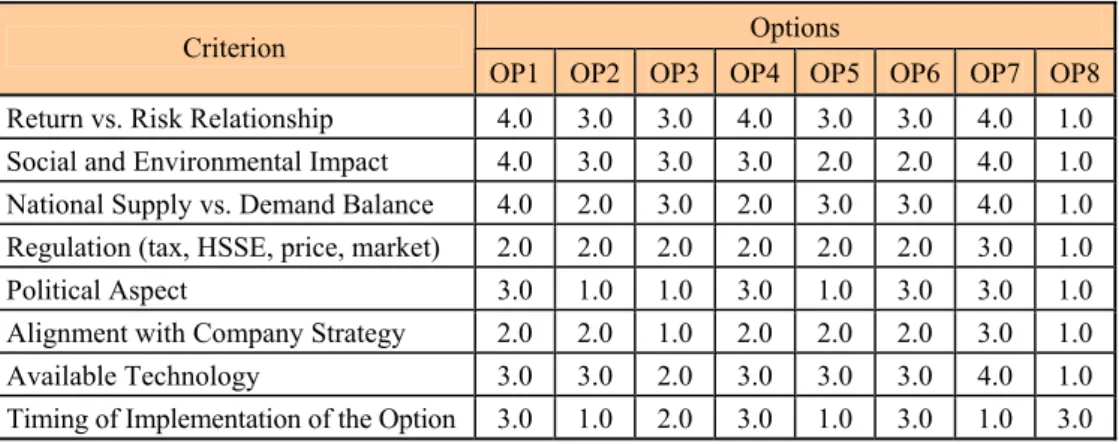
Table 3 – Matrix of Normalized Alternatives’ Scores against Criteria (Source: Gomes, Rangel & Maranhão, 2009).
Options Criterion
OP1 OP2 OP3 OP4 OP5 OP6 OP7 OP8
Return vs. Risk Relationship 4.0 3.0 3.0 4.0 3.0 3.0 4.0 1.0
Social and Environmental Impact 4.0 3.0 3.0 3.0 2.0 2.0 4.0 1.0
National Supply vs. Demand Balance 4.0 2.0 3.0 2.0 3.0 3.0 4.0 1.0 Regulation (tax, HSSE, price, market) 2.0 2.0 2.0 2.0 2.0 2.0 3.0 1.0
Political Aspect 3.0 1.0 1.0 3.0 1.0 3.0 3.0 1.0
Alignment with Company Strategy 2.0 2.0 1.0 2.0 2.0 2.0 3.0 1.0
Available Technology 3.0 3.0 2.0 3.0 3.0 3.0 4.0 1.0
Timing of Implementation of the Option 3.0 1.0 2.0 3.0 1.0 3.0 1.0 3.0
The graph in Figure 2 clearly shows the result from applying two factors of attenuation to losses (θ = 1 and θ = 5), both with equal correlation. It can be seen that, for different degrees of aversion, in spite of the increase of aversion, the preferences are practically maintained, with the ranking of the options not suffering any alteration either, as can be seen in Table 3. Only with the alteration of θ = 10 was there an almost imperceptible change: the inversion of positions between OP5 and OP2. By means of sensitivity analyses, it can be observed that there was a repositioning between OP5 and OP2, which ratifies the preliminary sensitivity test carried out on the variation of θ. In the second test, only altering the three most important criteria, there was no alteration in the table of ranking of options.
R2= 0.8425
R2= 0.8425
-1.8000 -1.6000 -1.4000 -1.2000 -1.0000 -0.8000 -0.6000 -0.4000 -0.2000 0.0000 0.2000 0.4000
-0.1500 -0.1000 -0.0500 0.0000 0.0500 0.1000 0.1500
Lossesθ= 1 Gains Lossesθ= 5
Lossesθ= 5 Lossesθ= 1 Gains R2= 0.8425
R2= 0.8425
-1.8000 -1.6000 -1.4000 -1.2000 -1.0000 -0.8000 -0.6000 -0.4000 -0.2000 0.0000 0.2000 0.4000
-0.1500 -0.1000 -0.0500 0.0000 0.0500 0.1000 0.1500
Lossesθ= 1 Gains Lossesθ= 5
Lossesθ= 5 Lossesθ= 1 Gains
Table 4, in turn, presents a comparative table of the ranking obtained by the application of the TODIM method (θ = 1), as compared with the ranking resulting from the application of the tradition evaluation methodology, currently used by the company, defined as the status quo. This traditional evaluation carried out by the company consisted of taking into account economic and financial factors only. It is important to mention that the information obtained together with the company only considers the technical evaluation criteria. Questions linked to non-standardized objective and/or subjective aspects, such as predilection on the part of the decision making group, links with other projects in progress, global restrictions of resources, competition of projects in the portfolio etc, were not taken into consideration in preparing the ranking of the status quo.
Table 4 – Rank ordering and normalized global values (Source: Gomes, Rangel & Maranhão, 2009).
θ = 1 θ = 5
Performance Performance
Ranking
Alternatives
Gross Normalized Alternatives Gross Normalized
1 OP7 4.0071 1.0000 OP7 4.0071 1.0000
2 OP1 -2.8623 0.8542 OP1 1.5933 0.8088
3 OP4 -7.9990 0.7451 OP4 -0.1725 0.6690
4 OP6 -9.3098 0.7173 OP6 -0.8519 0.6152
5 OP5 -11.7867 0.6647 OP5 -1.5820 0.5574
6 OP2 -12.0187 0.6598 OP2 -1.6065 0.5554
7 OP3 -22.1036 0.4457 OP3 -3.6593 0.3929
8 OP8 -43.1017 0.0000 OP8 -8.6203 0.0000
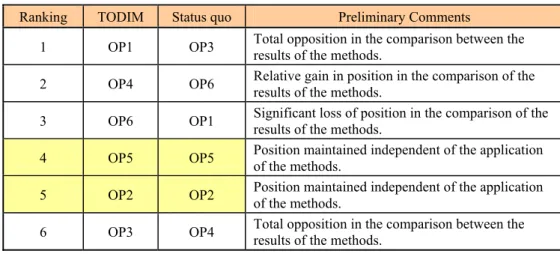
Even without access to the additional premises and information which guide the ordering of the options, resulting from the application of the classical methodology (status quo), it is presumed that the great weight of the economic and financial factors had an important impact on the inverted positioning, compared with the TODIM method, of the options OP3 (Ï) and OP4 (Ð). Table 5 presents a comparison of rank orderings by TODIM against the status quo.
Table 5 – Comparison of rank ordering by TODIM against the status quo (Source: Gomes, Rangel & Maranhão, 2009).
Ranking TODIM Status quo Preliminary Comments
1 OP1 OP3 Total opposition in the comparison between the results of the methods.
2 OP4 OP6 Relative gain in position in the comparison of the results of the methods.
3 OP6 OP1 Significant loss of position in the comparison of the results of the methods.
4 OP5 OP5 Position maintained independent of the application of the methods.
5 OP2 OP2 Position maintained independent of the application of the methods.
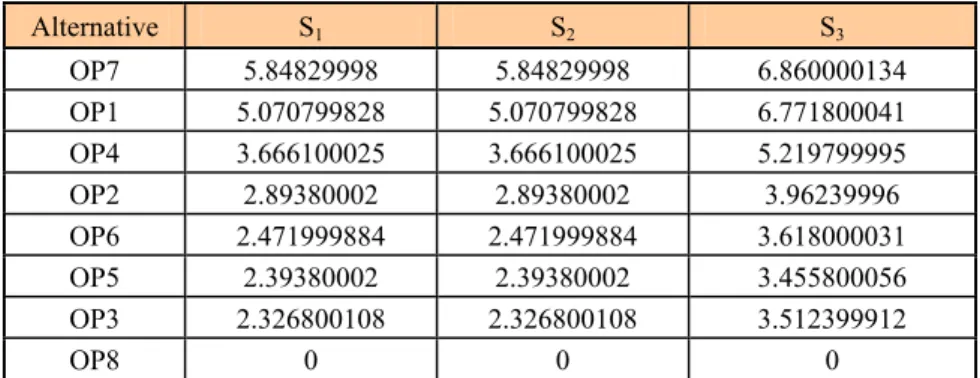
Ranking the alternatives making use of the three possible situations that are available in THOR leads to Table 6, where the relative global value is displayed for every alternative:
Table 6 – Values of alternatives according to situations S1, S2, and S3.
Alternative S1 S2 S3
OP7 5.84829998 5.84829998 6.860000134
OP1 5.070799828 5.070799828 6.771800041
OP4 3.666100025 3.666100025 5.219799995
OP2 2.89380002 2.89380002 3.96239996
OP6 2.471999884 2.471999884 3.618000031
OP5 2.39380002 2.39380002 3.455800056
OP3 2.326800108 2.326800108 3.512399912
OP8 0 0 0
From Table 6 one can see that S1 and S2 produces the following ordering:
OP7 ; OP1 ; OP4 ; OP2 ; OP6 ; OP5 ; OP3 ; OP8
S3 leads to the ordering below:
OP7 ; OP1 ; OP4 ; OP2 ; OP6 ; OP3 ; OP5 ; OP8
The use of the rough set theoretical modulus of THOR has shown that at least one of those orderings would be changed in case one criterion is deleted.
By combining those two ranks the following ordering is obtained:
OP7 ; OP1 ; OP4 ; OP2 ; OP6 ; (OP3, OP5) ; OP8
By varying the weight of the criterion ‘Timing of Implementation of the Option’ from 0.0280 to 0.27 produces a change in ordering, where the ranks of alternatives OP7 and OP1 would be reverted. Changing the weights of other criteria within reasonable margins would not affect that new position OP1. Table 7 shows the new global value for every alternative as a result from this sensitivity analysis:
Table 7 – New values of alternatives generated by sensitivity analysis.
Alternative S1 S2 S3
OP1 4.862157822 4.862157822 6.816264153
OP7 4.850080967 4.850080967 5.913043022
OP4 4.162881851 4.162881851 5.915699959
OP6 2.782608986 2.782608986 4.275121212
OP5 2.219645977 2.219645977 2.977294922
OP2 2.219645977 2.219645977 2.929065943
OP3 2.165699959 2.165699959 3.217713118
Before comparing the rank ordering from using both analytical approaches with the same data one should mention that, when THOR was used, transitivity was fully respected while p = q = 0 for all criteria.
TODIM led to the following rank ordering: OP7 ; OP1 ; OP4 ; OP6 ; OP5 ; OP2 ; OP3
; OP8. The rank ordering obtained from using THOR was the following: OP7 ; OP1 ; OP4
; OP2 ; OP6 ; (OP3, OP5) ; OP8. A merge of the two approaches would lead to the rank ordering below:
OP7 ; OP1 ; OP4 ; (OP2, OP6, OP3, OP5) ; OP8.
One would then need to investigate the dominance relations within the set of alternatives (OP2, OP6, OP3, OP5), in order to be able to refine the order of global preferences. In general, however, it can be concluded that there is an agreement between the uses of both tools on the three most preferred alternatives as well as on the least preferred alternative. Besides this, it is clear that both tools agreed on half of all rank orderings.
Sensitivity Analysis
A sensitivity analysis was conducted aiming at identifying which values of p and q could be assigned to criteria such that the rank OP7 ; OP1 ; OP4 ; (OP2, OP6, OP3, OP5) ; OP8 could be obtained. Since both TODIM and THOR produced similar ranks the decision analysts were confident with the weights that were utilized. Therefore running a sensitivity analysis by changing weights of criteria was not the aim of this study.
The model for determining the values of p and q was the following:
Max pj, qj
1 1
( | ) ( | )
n n
j j j j j j j j
j j
w aP b w aQ b aI b aR b bQ a bP a
= =
> ∧ ∧ ∧ ∧
∑
∑
1 1
( | ) ( | )
n n
j j j j j j j j
j j
w aP b aQ b w aI b aR b bQ a bP a
= =
∧ > ∧ ∧ ∧
∑
∑
1 1
( | ) ( | )
n n
j j j j j j j j
j j
w aP b aQ b aI b w aR b bQ a bP a
= =
∧ ∧ > ∧ ∧
∑
∑
subject to
OP7 ; OP1 ; OP4 ; (OP2, OP6, OP3, OP5) ; OP8
where pj; qj ≥ 0
5. Discussion
A model is a simplification of reality developed for a specific purpose. No model, mathematical or non-mathematical, is therefore a perfect representation of reality. It would be presumptuous to assume that a perfect mathematical multicriteria decision support method exists, independent of the peculiarities of the case studied. For each type of decision there may be one or more equally good methods which, through their understanding and appropriate use, promote adjustments for alignment to the paradigms on which they are based, in addition to the business environment and quality of information, and permit a consistent application with well supported results. The combination of two or more methods can act both in terms of complementing and refining the results by providing consecutive filters.
One of the limitations which occurred during the execution of this study relates to accessibility of primary data. It was not possible to access all the decision agents during data collection via questionnaires and validation interviews. Nevertheless, the number of responding collaborators (18 among 20 accessible) permitted a meaningful critical mass for the correct development of the research.
Secrecy concerning the premises of the alternatives, ranked by the application of the classical methodology currently used at the company, here called the status quo, was preserved for reasons of sensitivity of company strategic information. This restriction partially impairs the study, in the sense that it is not possible to make a detailed comparison of the ordering obtained by the application of both the methods, as well as identification of the reasons for important differences.
The modeling of scenarios of daily decisions, such as purchases and supplies, was shown to be relatively restricted, as these scenarios are subject to the implementation of decision policies, minimizing the effect of the prospects, caused by aversion to losses, therefore leading to the application of a different method.
6. Conclusion
The application of a merge of TODIM and THOR was demonstrated to be extremely useful in recommending upstream project options due to the fact that we can clearly identify the most important alternatives, vis-à-vis the scenarios tested and in relation to the criteria listed. Another conclusion concerns the maturity of the decision making process, through the continuation of the modeling. As a result of the detailing applied, it is possible to identify occasional inversions in the ranking of the options, which would permit their reevaluation due to restriction of resources, for example.
Questions linked to different judgment values and diverse variables are required in the decision making process, putting the decision agents in an uncomfortable position which may be, at times, in conflict with the interests of the group and the company. What is the most rational option for the company? Are the arguments in defense of the alternatives chosen truly conclusive and unquestionable? These questions arise when finalizing a planning cycle or an eventual selection. The current process demands an enormous amount of time compiling the data and generating information, as well as in the various rounds of discussion of the recommendations. The methodology of the study presented here, based on the use of the TODIM_THOR approach, permits a more consistent comparison of alternatives which are of real importance to the organization, given the previously determined weights. In addition to this, it contributes to the preparation of a rational contingency plan, permitting the analysis of changes in scenario, without necessarily generating recalculation of the data and the production of new information.
The comparison of the results of ranking of the projects, presented by the application of the TODIM_THOR approach, does not aim to invalidate the current process. However, it shows that it is possible to minimize the effort of prioritizing and to dedicate time to the sensitivity analysis in various dimensions, a question of extreme importance for the oil and natural gas industry. Therefore, the TODIM_THOR approach is shown to be a multicriteria method which should be well received in virtue of its theoretical base, grounded in Prospect Theory as well as on a comparison among alternatives following the basic principles of The French School of multicriteria decision aiding (Roy & Bouyssou, 1993), and for the opportunity presented by its interactive focus and without doubt, for the practicality of its application.
The study presented here, however, does not end with this conclusion, nor can the results be considered complete or definitive. On the contrary, many aspects connected to Decision Theory and Prospect Theory require study in greater depth, in terms of their application to the business environment of the oil and natural gas industry, principally regarding analysis of the inconsistency of the criteria matrix and sensitivity analysis, due to the risks inherent to the sector.
As a complement to the study presented here, research related to the behavior of executives in the decision making process, principally concerning questions of motivation and personal wishes, may contribute decisively to a better understanding of the recommendations and choices defined.
Acknowledgements
A Lemann Visiting Scholarship allowed the second author to work on the original version of this paper while at the University of Illinois (UIUC), Urbana-Champaign (Fall 2008). He therefore thanks Werner Baer (Dept. of Economics) and Geoffrey Hewings (Regional Economics Applications Laboratory) of UIUC. Working on the final version of the paper was supported by CNPq through Process No. 310603/2009-9.
References
(1) Bouyssou, D. (1986). Some remarks on the notion of compensation in MCDM.
European Journal of Operational Research, 26(1), 150-160.
(3) Brans, J.P. & Mareschal, B. (2005). Prométhée methods. In: Multiple Criteria Decision Analysis State of the art surveys [edited by J. Figueira, S. Greco and M. Ehrgott], 163-195, Springer, New York.
(4) British Petroleum (2006). Statistical Review of World Energy 2005. In: <http://www.bp.com>. Accessed on November 16, 2007.
(5) Cardoso, R.; Xavier, L.H.; Gomes, C.F.S. & Adissi, P.J. (2009). Uso de SAD no Apoio à Decisão na Destinação de Resíduos Plásticos e Gestão de Materiais. Pesquisa Operacional, 29(1), 67-95.
(6) Clemen, R.T. & Reilly, T. (2001). Making Hard Decisions with Decision Tools®. Duxbury-Thomson Learning, Pacific Grove.
(7) Gomes, C.F.S. (2005). Using MCDA Method THOR in an Application for Outranking the Ballast Water Management Options. Pesquisa Operacional, 25(1), 11-28.
(8) Gomes, C.F.S.; Nunes, K.R.A.; Xavier, L.H.; Cardoso, R. & Valle, R. (2008). Multicriteria Decision Making Applied to Waste Recycling in Brazil. Omega, 36, 395-404.
(9) Gomes, L.F.A.M. & Lima, M.M.P.P. (1992a). TODIM: Basics and application to multicriteria ranking of projects with environmental impacts. Foundations of Computing and Decision Sciences, 16(4) 113-127.
(10) Gomes, L.F.A.M. & Lima, M.M.P.P. (1992b). From Modeling Individual Preferences to Multicriteria Ranking of Discrete Alternatives: A look at Prospect Theory and the additive difference model. Foundations of Computing and Decision Sciences, 17(3), 171-184.
(11) Gomes, L.F.A.M. & Maranhão, F.J.C. (2008). A Exploração de Gás Natural em Mexilhão: Análise Multicritério pelo Método TODIM. Pesquisa Operacional, 28(3), 491-509.
(12) Gomes, L.F.A.M. & Rangel, L.A.D. (2009). An Application of the TODIM Method to the Multicriteria Rental Evaluation of Residential Properties. European Journal of Operational Research, 193(1), 204-211.
(13) Gomes, L.F.A.M.; Rangel, L.A.D. & Maranhão, F.J.C. (2009). Multicriteria Analysis of Natural Gas Destination in Brazil: An Application of the TODIM method.
Mathematical and Computer Modelling, doi:10.1016/j.mcm.2009.02.013.
(14) He, Y. & Huang, R.H. (2008). Risk attributes theory: decision making under risk.
European Journal of Operational Research, 186(1), April, 243-260.
(15) Huber, J.; Viscusi, W.K. & Bell, J. (2008). Reference dependence in iterative choices.
Organizational Behavior and Human Decision Processes, 106(2), July, 143-152.
(16) Johnston, D. (2003). International Exploration Economics, Risk and Contract Analysis. PennWell Corporation, Tulsa.
(18) Kahneman, D. & Tversky, A. (1979). Prospect theory: An analysis of decision under risk. Econometrica, 47, 263-292.
(19) Keeney, R.L. & Raiffa, H. (1993). Decisions with Multiple Objectives: Preferences and Value tradeoffs. Cambridge University Press, Cambridge.
(20) Kumar, A. & Lim, S.S. (2008). How do decision frames influence the stock investment choices of individual investors? Management Science, 54(6), June, 1052-1064.
(21) Montibeller Neto, G.; Belton, V.; Ackermann, F. & Ensslin, L. (2008). Reasoning maps for decision aid: an integrated approach for problem-structuring and multi-criteria evaluation. Journal of the Operational Research Society, 59, 575-589.
(22) Raiffa, H. (2002). Decision Analysis: a Personal Account of How it Got Started and Evolved. Operations Research, 50(1), Jan/Feb, 179-185.
(23) Rangel, L.A.D. & Gomes, L.F.A.M. (2007). Determinação do Valor de referência do aluguel de imóveis residenciais empregando o método TODIM. Pesquisa Operacional,
27(2), 357-372.
(24) Real, R.V. (2005). Conditioning Factors of the Development of a LNG Project for the Southern Cone: An Alternative for the Monetization of Gas Reserves in the Region. Masters’ Dissertation, COPPE/UFRJ, Rio de Janeiro.
(25) Rosenhead, J. & Mingers, J. (eds.) (2008). Rational Analysis for a Problematic World revisited. 2nd ed. John Wiley & Sons, Chichester.
(26) Roux, D. (2002). Nobel en Économie. 2nd Edition. Economica, Paris.
(27) Roy, B. (1985). Méthodologie multicritère d’Aide à la Décision. Economica, Paris.
(28) Roy, B. & Bouyssou, D. (1993). Aide Multicritère à la Décision: méthodes et cas. Economica, Paris.
(29) Saaty, T.L. (1994). Fundamentals of Decision Making and Priority Theory with the Analytic Hierarchy Process. RWS Publications, Pittsburgh.
(30) Trotta, L.T.F.; Nobre, F.F. & Gomes, L.F.A.M. (1999). Multi-Criteria Decision Making – An Approach to Setting Priorities in Health Care. Statistics in Medicine, 18, 3345-3354.