*e-mail: [email protected]
Trabalho apresentado no I Simpósio Mineiro de Ciências dos Materiais, Ouro Preto, Novembro de 2001.
Diffusion of the
65Zn Radiotracer in ZnO Polycrystalline Ceramics
Maria Auxiliadora das Neves Nogueiraa, Wilmar Barbosa Ferrazb, Antônio Claret Soares Sabionia*
aLaboratório de Difusão em Materiais, Departamento de Física,
Universidade Federal de Ouro Preto, 35400-000 Ouro Preto - MG, Brazil
bCentro de Desenvolvimento da Tecnologia Nuclear – CDTN/CNEN,
Pampulha, Belo Horizonte - MG, Brazil
Received: November 11, 2001; Revised: March 23, 2003
Zinc self-diffusion coefficients were measured in polycrystalline ZnO of high density (>99% of the theoretical density) and of high purity (> 99.999%). The diffusion experiments were per-formed from 1006 to 1377 °C, in oxygen atmosphere, for times between 16 and 574 h. The diffu-sion profiles were established by means of Residual Activity Method using the 65Zn radioactive
isotope as zinc tracer. In our experimental conditions, the zinc volume diffusion coefficients can be described by the following Arrhenius relationship: D(cm2/s) = 1.57×10⁻³ exp[(-2.66 ± 0.26) eV/
kT]. In the same experimental conditions, the grain-boundary diffusion coefficients are approxi-mately 4 orders of magnitude greater than the volume diffusion coefficients, and can be described by the Arrhenius relation: D’δ (cm3/s) = 1.59×10⁻⁶ exp[(-2.44 ± 0.45) eV/kT], where D’ is the
grain-boundary diffusion coefficient and δ is the grain boundary width.
Keywords: zinc oxide, zinc diffusion, grain-boundary, varistor
polycrystals, like ZnO varistors, in order to determine the zinc volume and grain-boundary diffusion coefficients.
In previous works, performed by Kim6, and by Moore
and Williams7 , it was used the 65Zn radioactive isotope as
zinc tracer and the diffusion profiles were obtained by a serial sectioning technique and by counting the activity in each removed section.
Recently, Tomlins et al.4 have used the 70Zn stable
iso-tope as tracer and analysed the diffusion profiles by sec-ondary ion mass spectrometry (SIMS). In the present work, the methodology used is different of the previous works, and consisted in using the 65Zn radioactive isotope as tracer,
but with depth profiling by means of the residual activity method or Gruzin’s method8.
2 Experimental Procedure
2.1 Material
The polycrystalline ZnO samples were fabricated by using high-purity powder obtained from Alfa Aesar. The
1. Introduction
The transport properties and the defect chemistry of zinc oxide have been intensivelly studied in the last decades due to, principally, the utilization of this material in ZnO-based varistors.
The non-linear current-voltage characteristics of ZnO varistors, as well as its degradation in operation (loss of its varistor property) are grain-boundary phenomena involv-ing interaction between point defects and ionic diffusion1,2.
The understanding and the modelling of these phenomena demand the knowledge of the defect structure and of the diffusional processes in ZnO.
In spite of numerous previous studies about diffusion and defect in ZnO, there is still lack of reliable defect and diffusion data as shown by Tomlins et al.3,4.
The present work is part of a wide project concerned with the study of diffusion and defects in ZnO5, and deals
with the study of the zinc diffusion in ZnO.
While previous works4,6,7 about zinc diffusion in ZnO
impurity content was less than 10 ppm (elements detected: 0.1 ppm Fe and 1 ppm Pb). The powder was cold pressed and sintered at 1400 °C, for 4 h in oxygen atmosphere. No additive was used as powder agglomerant in the sintering experiments.
The sintered ZnO had high density (> 99% of the value of the theoretical density) and grain size of 20 µm. These samples were resintered for 72 h at 1393 °C, in oxygen at-mosphere, in order to increase the grain size above 80 µm. A typical microstructure of the ZnO samples used in this work, after thermal etching at 1150 °C, for 1 h, in air, is shown in Fig. 1.
For the diffusion experiments, samples of dimensions 17 mm × 17 mm × 3 mm, were polished with diamond paste, and submitted to pre-annealing in order to equilibrate the samples with the temperature and atmosphere to be used in the diffusion annealings.
2.2 Preparation of the 65Zn radioactive tracer
The zinc tracer used in this work was the radioactive isotope 65Zn. This isotope has a half-life of 244.1 days and
decays emitting the radiations γ (1.1154 and 0.820 MeV) and β+ ( 0.324 MeV).
The 65Zn radiotracer was prepared by irradiation of a
ZnCl2 solution (99.999%), under a neutron flux of 6.6 × 10¹¹ neutrons/cm2.s, for 4 h, in TRIGA reactor
(250 kW) at CDTN/CNEN (Belo Horizonte /MG).
2.3 Deposition of the tracer
A drop of the irradiated ZnCl2 was deposited on the
polished surface of the sample, previously thermo-dinamically equilibrated. The drop was carefully spread on the surface, slowly dried, and then oxidized at 500 °C, for 2 h, in air.
2.4 Diffusion experiments
The diffusion experiments were performed from 1006 to 1377 °C, in oxygen atmosphere, for times between 16 and 574 h. These diffusion treatments were performed in a tubular furnace of super kanthal resistance.
In order to minimise the evaporation of the tracer and of the ZnO samples, which is significative above 1100°C, the samples were placed in a ZnO crucible for the diffusion annealings.
2.5 Determination of the 65Zn diffusion profiles
After the diffusion annealings, about 1 mm in thickness of material was removed from each lateral face and back. This operation was performed to remove 65Zn tracer
even-tually diffused along the lateral surface, followed by diffu-sion into volume, where it would be counted.
The diffusion profiles of 65Zn were determined by means
of the Gruzin’s Method or Residual Activity Method 8.
In this method, sections of the sample are removed, and the activity remaining in the sample after each sectioning is measured. The sectioning was performed by mechanical abrasion using a high precision grinder. The thickness of the removed section was determined by measuring the mass of the sample before and after the sectioning.
The counting of the γ-radiation (1.1154 MeV) was per-formed using a NaI(Tl) scintillation counter (EGεG ORTEC - Scintipack - Model 296). The duration of each counting was 45 min.
The diffusion profiles of 65Zn were established by
plot-ting the residual activity (I), after each sectioning, versus the depth (x) of the sectioning.
The residual activity method is applicable if the radia-tion used is absorbed exponentially, with a linear absorp-tion coefficient µ. If I is the residual activity after the nth
section, it can be show that 8:
(1)
whatever the functional form of C(x). This equation can be simplified if the used radiation is only slightly absorbed, as in the case of the γ radiation used in this work. The simpli-fied equation is given by:
(2)
Figure 1. Typical microstructure of polycrystalline ZnO used in
3. Results and Discussion
3.1 65Zn volume diffusion
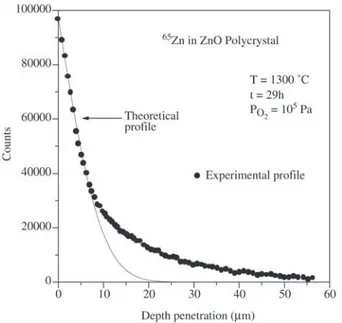
Figure 2 shows a typical diffusion profile after diffusion of the 65Zn at 1300 °C, in oxygen atmosphere, for 29 h. The
diffusion profile shows two regions.
The first part of the profile, of high gradient dI/dx, cor-responds to the volume diffusion and the second part of profile of low gradient dI/dx, ie, the tail of the profile, is a characteristic of the diffusion along the grain-boundaries 8.
In our experimental conditions, diffusion from an in-stantaneous source, Eq. (2) has the following form8.
(3)
Resolving Eq. (3), it is obtained the following relation-ship for I as a function of x9:
(4)
where the erfc function is given by
The fit of Eq.4 to the first region of the diffusion profile, as shown in Fig. 2, gives the value of the volume diffusion
coefficient (D). Figure 3 shows the dependence on tempera-ture of the diffusion coefficients determined in this work, which can be described by an Arrhenius equation given by:
(5)
Figure 3 also shows the comparison of the results of the present work with those previously published6-8. Our results
and those recently determined by Tomlins et al. show good agreement for the volume diffusion coefficients values.
Further experiments of zinc diffusion as function of the oxygen pressure have been performed in order to determine the zinc diffusion mechanism (vacancy or insterstitial mechanism) in ZnO, and will be the subject of another pa-per.
3.2 65Zn grain-boundary diffusion
According to Harrison’s conditions10, our 65Zn
intergranular diffusion experiments are of B-type:
δ << (Dt)1/2 < Φ/2 (6)
where δ is the grain-boundary width, D is the volume diffu-sion coefficient and Φ is the grain size.
For B-type intergranular diffusion, it is possible to de-termine the product D’δ, where D’ is the grain-boundary diffusion coefficient. For the experimental conditions used in this work, the product D’δ is calculated by using the Suzuoka’s model11 through the relationship:
Figure 2. Diffusion profile for the isotope 65Zn in ZnO polycrystal at 1300 °C.
Figure 3. Comparison of volume diffusion coefficients obtained
(7)
where the parameter β is given by:
(8)
The gradient is calculated from the tail of
the diffusion profile in a plot of ln(-dI/dx) versus x6/5 as
shown in Fig. 4.
The experimental conditions used and the results obtained for the grain-boundary diffusion are listed in Table 1.
The dependence on temperature for the product D’δ can be described by the following Arrhenius equation:
D’δ (cm3/s) = 1.59×10⁻⁶ exp[(-2.44 ± 0.45)eV/kT] (9)
Equation 9 can be rewriten on the following form:
D’(cm2/s) = (1/δ)1.59×10-6exp[(-2.44 ± 0.45)eV/kT] (10)
Assuming for δ the usual value12 of 1 nm, the 65Zn
grain-boundary diffusion coefficient can be estimated from Eq. 10. Figure 5 shows the comparison between the volume dif-fusion coefficients (D) and the grain-boundary difdif-fusion coefficients (D’). It is clear from Table 1 that the ratio D’/D is greater than 104. This shows that the grain-boundary is a
fast path for zinc diffusion in ZnO. There is no data in lit-erature about zinc grain-boundary diffusion coefficients in ZnO for comparison with our results.
4. Conclusions
1. Zinc volume diffusion coefficients and zinc grain-boundary diffusion coefficients in ZnO were meas-ured by means of the residual activity method using the 65Zn as zinc tracer. The diffusion coefficients were
studied as a function of the temperature under an oxy-gen pressure of 105 Pa. The product D’δ for the
Figure 5. Comparison of volume diffusion coefficients (D) and
grain-boundary diffusion coefficients (D’) obtained in the same experimental conditions.
Figure 4. Plot of ln(-dI/dx) vs. x6/5, after diffusion at 1300 °C.
Table 1. Experimental conditions and results for zinc diffusion in polycrystalline ZnO
T(°C) t(s) D’δ(cm3/s) D(cm2/s) D’/D
1006 2.0664×10⁶ 2.47×10⁻¹⁶ 5.34×10⁻¹⁴ 4.62×10⁴
1105 7.9188×10⁵ 1.75×10⁻¹⁵ 2.98×10⁻¹³ 5.87×10⁴
1151 3.3180×10⁵ 1.30×10⁻¹⁴ 5.10×10⁻¹³ 2.55×10⁵
1203 1.0080×10⁵ 5.14×10⁻¹⁵ 2.57×10⁻¹² 2.00×10⁴
1249 1.7280×10⁵ 7.48×10⁻¹⁵ 1.52×10⁻¹² 4.92×10⁴
1271 1.1082×10⁵ 1.67×10⁻¹⁴ 4.21×10⁻¹² 3.97×10⁴
1300 1.0440×10⁵ 7.12×10⁻¹⁴ 2.69×10⁻¹² 2.65×10⁵
1341 6.4800×10⁴ 4.97×10⁻¹⁴ 1.31×10⁻¹¹ 3.79×10⁴
intergranular diffusion was determined using the Suzuoka model for B-type diffusion.
2. For the first time an Arrhenius’ equation was estab-lished for zinc grain-boundary diffusion in ZnO. 3. The activation energy for zinc volume diffusion
is about 2.66 eV, and the activation energy for intergranular diffusion is 2.44 eV.
4. The zinc grain-boundary diffusion coefficients are ca. 4 orders of magnitude greater than the volume diffu-sion coefficients, in the same experimental conditions, which means that the grain-boundary provides a fast path for zinc diffusion in ZnO.
Acknowledgements
This work was supported by Fundação de Amparo à Pesquisa do Estado de Minas Gerais (FAPEMIG), Brazil.
References
1. Gupta, T.K.; Carlson, W.G. J. Mater. Sci., v.20, p. 3487,
1985.
2. Gupta, T.K. J. Am. Ceram. Soc., v.73, n., p.1817, 1990. 3. Tomlins, G.W.; Routbort, J.L.; Mason, T.O. J. Am. Ceram.
Soc., v. 81, n. 4, p. 869, 1998.
4. Tomlins, G.W.; Routbort, J.L.; Mason, T.O. J. Appl. Phys., v. 87, n. 1, p.117, 2000.
5. Sabioni, A.C.S. et al.Difusão Iônica e Defeitos Pontuais em Eletrocerâmicas de ZnO. FAPEMIG, Processo TEC 6. Kim, K.S., Ph.D. thesis, Massachusetts Institute of
Tech-nology, 1971.
7. Moore, W.J.; Williams, E.L. Crystal Imperfections and Chemical Reactivity of Solids, The Faraday Society, Aberdeen, Scotland, v.28, p.86, 1959.
8. Philibert, J. Atom Movements, Diffusion and Mass Trans-port in Solids, Les Éditions de Physique, 1991.
9. Badrour, L.; Moya, E.G.; Bernardini, J.; Moya, F. J. Phys. Chem. Solids, v. 50, n. 6, p. 551, 1989.