*e-mail: [email protected]
The Characterization of Co
xZn
7-xSb
2O
12Spinel Obtained by the Pechini Method
Deiby Santos Gouveiaa*, Raul Rosenhaimb, Severino Jackson Guedes Limac, Elson Longod,
Antonio Gouveia de Souzab, Iêda Maria Garcia dos Santosb
aIPEN, Instituto de Pesquisas Energéticas e Nucleares, IPEN/CNEN-SP, Brazil bLTM, Departamento de Química, CCEN, Campus I, Universidade Federal da Paraíba,
58059-900 João Pessoa - PB, Brazil
cLSR, Departamento de Tecnologia Mecânica, CT, Universidade Federal da Paraíba,
58059-900 João Pessoa - PB, Brazil
dCMDMC, Departamento de Química, Universidade Federal de São Carlos,
Rod. Washington Luís, Km 235, 13565-905 São Carlos - SP, Brazil
Received: November 23, 2003; Revised: December 28, 2004
Oxides with spinel structures have been studied for many decades as they have been used in a variety of applications like pigments and refractories. They have also been used as a model structure to evaluate the relative stability of ions in octahedral and tetrahedral sites. Zinc- antimony spinels (Zn7Sb2O12) were synthesized by the Pechini method and the cation Zn2+ was substituted by Co2+, taking into consideration the stoichiometry of CoxZn7-xSb2O12 (x = 0 - 7). Characterization of the thermal properties of pyrolyzed powders was carried out with a TG/DTA analyzer, and mass losses were determined as a function of the cobalt content in the resin. The powders were calcined at temperatures in the range 600 to 1000 °C and characterized by XRD, BET and IR spectroscopy. Maximum cristalinity was obtained in powders calcined at 1000 °C. Materials with x = 5 - 7 revealed the presence of a secondary phase (Co, Zn)Sb2O6. Infrared analysis facilitated in the determination of the possible sites of Zn2+, Co2+ and Sb2+ ions in the lattice.
Keywords: spinel, Zn7Sb2O12, pechini, cobalt
1. Introduction
Increase in the number of compounds with spinel structures and their technological importance has lead to increasing interest in the crystallographic and chemical properties of these binary compounds1. Cation distribution in these compounds has been successfully ex-plained, considering its preference for tetrahedral or octahedral sites. In inverse spinels (B)[AB]O4, the divalent cations and half the trivalent cations are in octahedral sites, while the other half of the trivalent cations are in tetrahedral sites. These structures have some proper-ties that has permitted their use in specific areas such as ceramics. A good example is MgAl2O4, which has high thermal stability, and is used as a refractory material.
In this investigation, the inverse spinel CoxZn7-xSb2O12 was studied. Substitution of Zn2+ by Co2+ is possible, leading to the for-mation of a substitutional solid solution between the two elements. This occurs as both the cations have the same oxidation state and the difference between their ionic radius is ~ 2.7%. This spinel has been used in important applications in the electronic industry, and is a secondary phase in ZnO varistors.
Conventional methods to obtain ceramic materials are not ap-propriate for obtaining many advanced ceramics, due to reduced reactivity, limited reproducibility, heterogeneities and poor control of stoichiometry. Better results can be obtained by using chemical synthesis routes, which render good stoichiometric precision, powder morphology control and phase purity2.
A chemical synthesis method based on metal chelation was developed by Pechini3. In this method a polymeric chain is formed from a reaction between polyalcohol and a polycarboxylic acid with metallic cations distributed homogeneously along the chain. Heating of the polymeric resin above 300 °C leads to polymer breakage and
an further heat treatments to formation of a fine oxide powder. In this investigation, the spinel phase Zn7Sb2O12 was synthesized, substituting Zn2+with Co2+, taking into consideration the stoichiom-etry of CoxZn7-xSb2O12 (x = 0 to 7). The Pechini method of synthesis was used.
2. Experimental Procedure
The precursors used were citric acid (Vetec), ethylene glycol (Reagen), antimony oxide (Vetec), cobalt acetate (Vetec) and zinc acetate (Vetec).
An aqueous solution of citric acid was diluted in ethylene gly-col (in the proportion, 60/40 wt/wt)2,5 under agitation and heated at 50 - 60 °C. After complete dissolution, antimony oxide was added along with some drops of nitric acid to aid dissolution. Then zinc acetate and/or cobalt nitrate was added to the solution in stoichio-metric amounts. After dissolution, the temperature was increased to 90 - 110 °C, leading to.
Primary calcination of the resin was done at 350 °C for one hour. After de-agglomeration (200 mesh), the material was analyzed using simultaneous thermogravimetric and differential thermal analysis (TA-Instruments – SDT 2960), with a heating rate of 10 °C.min-1, in a current of air.
To determine crystallite size and lattice parameter, X-ray dif-fraction peaks were fitted using a pseudo-Voigt function. Lattice parameters were measured using the Win-Index and Win-Metric programs provided by SIEMENS.
Relative crystallinity was calculated using diffraction peak in-tensities, according to Equation 1.
(1)
where: I100 is the intensity of the most intense peak of the most crys-talline sample; I0 is the intensity of the most intense peak of the least crystalline sample and l is the intensity of the most intense peak of other samples.
Crystallite size (t) was measured using the most intense dif-fraction peak of the plane (2 2 2), according to Scherrer equation (Equation 2).
(2) where: t is the crystallite size, is the wavelength (Cu K 1), is the diffraction angle and is equal to:
(3)
where: Bobs is the full width to half maximum of the diffraction peak of the sample and b is the full width to half maximum of the diffrac-tion peak of the standard (quartz).
3. Results and Discussion
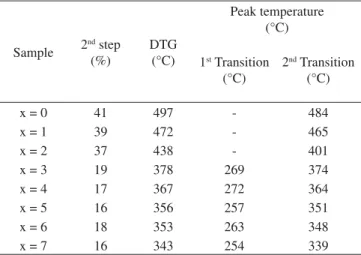
Thermogravimetric curves of the spinel powders (CoxZn7-XSb2O12, x = 0 - 7) are shown in Figure 1. Three thermal decomposition steps can be observed. The first step is due to loss of water and adsorbed gases. The second step is due to decomposition of organic material and the third step, above 800 °C for x > 3, is due to decomposition of carbonates or oxide. Two decomposition peaks were observed in the second step, with the smaller one at lower temperatures. This second decomposition peak was only observed in DTG curves (Table 1), probably due to the presence of organic chains with different sizes.
Upon substitution of zinc with cobalt, two different mass losses are observed in the second decomposition step. For x = 0 - 2, a high mass loss is obtained during pyrolisis and for x = 3 - 7, the mass loss is much smaller (Table 1).
A variation of 18% in the mass loss is observed between x = 2 and x = 3. This variation may be related to the amount of cobalt in the polymeric structure. Both cobalt and zinc present tetrahedral
and octahedral coordination. Preference for tetrahedral sites by Zn2+ and for octahedral sites6 by Co2+ was observed6. A change in cation coordination may be altering the polymeric structure of the resin.
The variation in DTG peak temperature with cobalt content is similar to mass loss variation with cobalt content: in the absence of cobalt, this temperature is 497 °C and when no zinc is present, the temperature decreases to 343 °C. This suggests that the addition of cobalt causes a less stable polymeric structure to form, requiring less energy for pyrolisis. A discontinuity in the linearity of the curve is observed between x = 2 and x = 3 (Figure 2).
All samples show exothermic transitions in the DTA curves. The sample without cobalt (x = 0) presents a peak at 484 °C and the sample without zinc (x = 7) presents a peak at 339 °C (Table 1), indicating a decrease in temperature as cobalt is added to the resin. This result is in agreement with the thermogravimetric data (Figure 3).
In the presence of carbon, an additional peak is observed during thermal decomposition with increasing sample temperature. This leads to faster crystallization and to an increase in particle as well as crystallite size. As samples with different amounts of cobalt present different mass losses, an isothermal study was necessary to determine the ideal temperature and time for carbon reduction (Table 2). These samples were calcined prior to crystallization, at temperatures below 360 °C, to have the same amount of carbon as the sample with x = 7 (16%).
Formation of crystalline phases (Figures 4 and 5) was studied by X-ray diffraction using JCPDS index-cards 15-517 and 15-687.
All the samples containing zinc and cobalt revealed the presence of a solid solution. According to Kroger Vink7 notation, the substitu-tion reacsubstitu-tion can be represented by Equasubstitu-tion 4.
(4)
Samples calcined at 600 °C were amorphous. Crystalliza-tion occurred at 700 °C, with the appearance of the spinel phase [(Co, Zn)2.33Sb0.67O4], along with a small amount of ilmenite [(Co, Zn)Sb2O6], in samples with x = 5 and 7. At 800 °C, the samples were crystalline. The sample Zn7Sb2O12presented the highest degree of crystallinity at this temperature. At 900 and 1000 °C, a decrease in the degree of crystallinity was observed, due probably to decomposition of the Zn2.33Sb0.67O4 phase to ZnO and Sb2O5 (Figure 4).
For samples with x = 1, 2, 3 and 4, only the (Co, Zn)2.33Sb0.67O4 phase was observed at 900 and 1000 °C. The other samples (x = 5, 6 and 7) also indicated the presence of the secondary phase (Co, Zn)Sb2O6, identified by the JCPDS index-card 18-0403 (Figure 5).
Figure 1. Thermogravimetric curves of samples Zn7-xCoxSb2O12 (x = 0 - 7).
Table 1. TG/DTG/DTA results for samples in the 2nd decomposition step.
Sample 2nd(%) step DTG(°C)
Peak temperature (°C)
1st Transition (°C)
2nd Transition (°C)
x = 0 41 497 - 484
x = 1 39 472 - 465
x = 2 37 438 - 401
x = 3 19 378 269 374
x = 4 17 367 272 364
x = 5 16 356 257 351
x = 6 18 353 263 348
This phase was also observed when Nobre8 synthesized the spinel Zn6CoSb2O12.
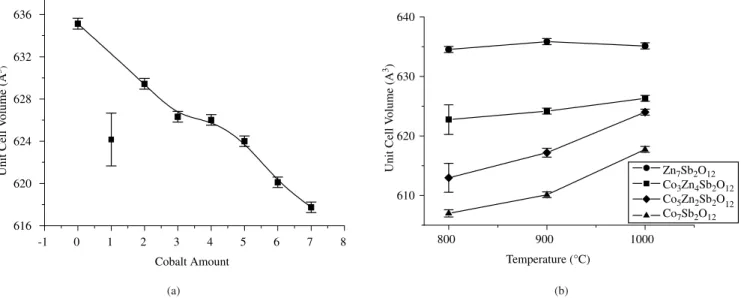
Using the lattice parameter results, graphs of unit cell volume as a function of calcination temperature and cobalt content were plotted (Figure 6a and 6b). According to the JCPDS index-card, the unit cell volumes of the phases Zn2.33Sb0.67O4 and Co2.33Sb0.67O4 are 632.73 and 622.84 Å3, respectively.
When the amount of cobalt in the structure increased, the unit cell volume decreased linearly, as shown in Figure 6a. This behavior can be explained by considering the ionic radius of cobalt and zinc. The ionic radius of zinc (Zn2+: rIV= 0.074 e rVI= 0.089 nm) is higher than that of cobalt (Co2+: rIV = 0.071 e rVI = 0.088 nm), in both the octahedral and tetrahedral positions, favoring thus a decrease in unit cell volume, as the cobalt concentration increases. Therefore, the lattice contracts when cobalt substitutes zinc. Figure 6a also shows a small discontinuity in the curve when 3 x 4. This can be related
to the entrance of cobalt in the tetrahedral site, as observed by Poleti9, Gama10 and Hie11.
The unit cell volume as a function of calcination temperature was also determined (Figure 6b). Nobre synthesized Zn7Sb2O12and observed an increase in unit cell volume with increase in temperature. The unit cell volumes changed from 636.28 to 636.94 Å3 at 920 and 1020 °C for 1 hour, respectively. In this investigation, no change was
Figure 2. Decomposition peak temperature (DTG) as a function of cobalt
amount.
M
.
Q
Figure 4. X-ray diffraction of the sample Zn7Sb2O12 as a funciton of tem-perature.
Figure 3. DTA peak temperature as a function of cobalt amount.
Table 2. Calcination time and temperature for carbon reduction.
Sample Temperature (°C) Time (min)
x = 0 360 95
x = 1 360 120
x = 2 320 100
x = 3 290 126
x = 6 290 58
Q
Figure 5. XRD after calcination at 1000 °C: a) Zn7Sb2O12; b) Co1Zn6Sb2O12,
c) Co2Zn5Sb2O12; d) Co3Zn4Sb2O12; e) Co4Zn3Sb2O12; f) Co5Zn2Sb2O12; g) Co6Zn1Sb2O12; h) Co7Sb2O12.
observed in the samples without cobalt. Samples with x = 3, 5 and 7, showed an increase in unit cell volume above 900 °C – higher the amount of cobalt, greater the volume. This increase can be attributed to the entrance of cobalt in the tetrahedral site, leading to an increase in lattice parameter.
(a)
(b)
Figure 6. Unit cell volume results: a) Variation as a function of cobalt amount, after calcination at 1000° C; b) Variation as a function of temperature. low crystallinity. While zinc has a preference for tetrahedral sites12,
cobalt has a preference for octahedral sites. In samples with only zinc or only cobalt, the cations are forced to get into less favorable positions and this makes crystallization more difficult.
The discontinuity in curve linearity, observed in the unit cell volume versus cobalt content, is also observed in the plots of relative crystallinity as a function of cobalt content, at 3 x 4 (Figure 7a). This is probably due to the occupation of tetrahedral sites by Co2+, as explained before.
Increase in temperature results in higher crystallinity, as shown in Figure 7b. This is due to the elimination of defects, and is a conse-quence of higher diffusion rates. Relative crystallinity of the sample Zn7Sb2O12 is higher at 800 °C, probably due to phase decomposition, as stated before. In the other samples (x = 3, 5 and 7), the highest crystallinity is observed at 1000 °C.
Variation of crystallite size as a function of cobalt content is presented in Figure 8a. In samples with x = 0 and 7, the crystalliza-tion process is more difficult, as shown earlier. This could lead to the formation fewer nuclei, which grow faster and result in bigger
crystallites. When x = 3 and 4, Zn2+ and Co2+ are in positions of lower energy, making crystallization easier. In this case, more crystallites nucleate, grow slowly and result in smaller crystallites.
The difference in crystallite size can be also attributed to cation mobility, as cation coordination changes diffusion rate. Colinas and Aréan12 observed that preference of Zn2+ for tetrahedral sites and preference of Ni2+ for octahedral sites makes cation migration more difficult, due to energy loss of the preferential site, when cation dif-fuses from a tetrahedral to an octahedral site. Behavior of Co2+ is similar to that of Ni2+.
On the basis of this theory, when x = 0, Zn2+ has higher mobility between sites and the crystallites are bigger. When 1 x 3, cobalt sub-stitutes zinc in the octahedral site. With 3 x 4, cobalt also occupies the tetrahedral sites. At this point, cation migration becomes more dif-ficult and crystallites are smaller. For x 4, Co2+ substitution increases, leading to higher mobility between sites. At x = 7 (Co7Sb2O12), it attains its highest mobility, leading to highest crystallite size. Ion mobility in this composition is higher than in the sample Zn7Sb2O12, due to the smaller size of Co2+ and lower bonding energy.
(a) (b)
Figure 8b shows the variation of crystallite size as a function of temperature. Crystallite size increases with temperature. An inflexion point can be observed at 900 °C. The same result was observed by Gama10, for the spinel Zn
3Ni4Sb2O12. This inflexion point can be at-tributed to a change in mass transport mechanism.
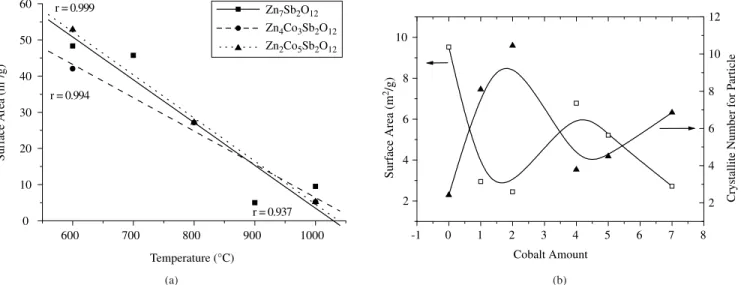
The surface area results are presented in Figure 9. The surface area increases linearly with temperature (Figure 9a). Two different behaviors can be observed in terms of cobalt content (Figure 9b). When x = 0 - 3, a decrease in surface area is observed. At x = 4, an increase is observed, followed by a linear decrease between x = 4 and 7. When the number of crystallites per particle is evaluated, the behavior is just the opposite. This result indicates that particle size increase is due to sintering among particles.
Infrared spectroscopy results of samples with x = 0 to 7, calcined at 1000 °C, are shown in Table 3. Thermal evolution results are shown in Figures 10 and 11.
Data from literature were used to associate the four vibrational bands, characteristic of the spinel phase, to cobalt and zinc in octahe-dral and tetraheoctahe-dral sites and to antimony in octaheoctahe-dral sites13,14,15.
According to these data, 1 vibration frequency can be related only
to antimony in octahedral sites - [SbO6]. According to Preudhome and Tarte16, if spinel contains different cations in the tetrahedral position, vibrational frequencies of the groups XO4 and YO4 are similar. In this case, splitting may occur17. Therefore
2 e 2’ are probably related to zinc and cobalt in tetrahedral sites – (ZnO4) and (CoO4). On the other hand, the cation position cannot be commented about, due to band enlargement. The low frequency band 3 was related to [CoO6], while 4 was attributed to (ZnO6) and (CoO6)16. In the Zn7Sb2O12spectrum 3 is not observed.
(a) (b)
Figure 8. Crystallite size results: a) Variation as a function of cobalt amount, after calcination at 1000° C; b) Variation as a function of temperature.
(a) (b)
Figure 9. Surface area results: a) Variation as a function of temperature; b) Variation as a function of cobalt amount.
Table 3. Vibrational frequency bands of the samples CoxZn7-xSb2O12 (x = 0 - 7) calcined at 1000 °C.
x = 0 x = 1 x = 2 x = 3 x = 4 x = 5 x = 6 x = 7
1 (cm
-1) 652 634 635 635 634 633 627 625
2(cm
-1) 485 480 483 488 485 485 493 495
2(cm
-1) 432 433 433 433 433 432 433 433
3(cm
-1) - 272 286 293 294 299 305 308
4(cm
(a) (b)
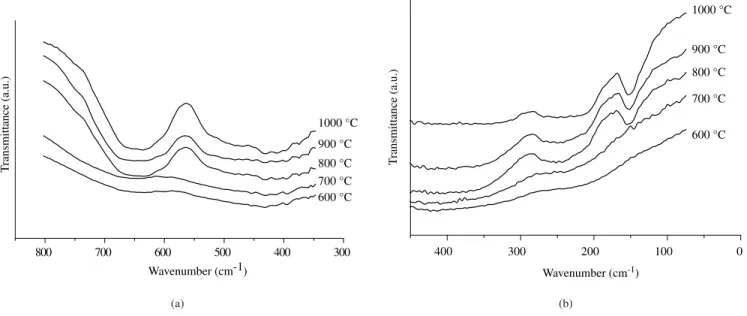
Figure 10. Infrared spectrum of the sample Zn7Sb2O12 calcined at 600 to 1000° C: a) frequency range of 800 to 400 cm-1; b) frequency range of 400 to
100 cm-1.
(a) (b)
Figure 11. Infrared spectrum of the sample Co7Sb2O12 calcined at 600 to 1000 °C: a) frequency range of 800 to 400 cm-1; b) frequency range of 400 to
100 cm-1.
Figures 10 and 11 reveal the effect of calcination temperature. The bands tend to dislocate to lower frequencies, with increase in temperature. No absorption band was observed at 700 °C, indicating the disordered behavior of the material. This result is in agreement with XRD that indicated an amorphous material until 700 °C. With increase in temperature, the 1, 2 and 4bands appear, indicating the formation of polyhedral coordination. After calcination at 1000 °C,
2’ appears at 485 cm-1, due to 2 splitting (Figure 10).
The sample Co7Sb2O12 (Figure 11) presented four bands that can be attributed to the spinel structure. These were in the regions:
1 = 623 - 656 cm-1, 2 = 433 - 456 cm-1, 3 = 199 - 309 cm-1 and 4= 162 - 187 cm-1. Splitting of 2’ indicates absorption in the range 485-504 cm-1. Additional bands were observed at 653 cm-1 and 555 cm-1for samples with x = 7, calcined at 600 and 700 °C. For samples calcined at 800 °C, another band was observed at 212 cm–1. Lenglet and Lefez18, Djambazov et al.19 and Jun et al.20 observed that
Co3O4 absorbs in the regions near 210, 216, 560 and 660 cm-1. Thus, the additional bands can be related to the presence of Co3O4, which was not observed by X-ray diffraction.
These bands disappear with increase in temperature, probably due to decomposition of Co3O4, as observed in the thermogravimet-ric results (Figure 1). Co3O4 formation probably delays the entrance of cobalt into tetrahedral sites. These results are in agreement with lattice parameter data, where an inflexion was observed at 900 °C, for samples with x 3, associated with the entrance of cobalt into tetrahedral sites.
4. Conclusions
of cobalt into tetrahedral sites. Infrared spectroscopy results indicated the presence of Co3O4, which decomposes above 800 °C, and enters the spinel unit cell.
Acknowledgments
The authors acknowledge CAPES and CNPq for the financial support.
References
1. Eppler R. A. Inverse Spinel Pigments. Journal of the American Ceramic Society. 1983; 66 (11):794-801.
2. Leite E R, Souza C M G, Longo E, Varela J. A. Influence of Polymeriza-tion on the Synthesis of SrTiO3: Part I: Characteristics of the Polymeric Precursors and their Thermal Decomposition. Ceramics International. 1995; 21(3):143-152.
3. Pechini M P. US Patent, n. 3.330.697 (1967).Pechini M P. US Patent, n. 3.330.697 (1967).
4. Dana J D. Variação na Composição dos Minerais. In:Dana J D. Variação na Composição dos Minerais. In: Manual de Minera-logia. 1. ed. Rio de Janeiro: Livros Técnicos e Científicos S.A.; 1974. 5. Petrucelli G C, E. Leite R, Longo E,Varela JA.Petrucelli G C, E. Leite R, Longo E, Varela J A. Síntese e Caracterização do
Es-pinélio Invertido Zn4-xCoxNi3Sb2O12 In: 45º Congresso Brasileiro de Cerâmica,
n. 030, 2001, Florianópolis - SC. Anais... São Paulo: 2000. p. 1-12. 6. Orgel L E.Orgel L E. Introdução à Química dos Metais de Transição. São Paulo:
Edgar Blücher LTDA; 1970. p. 60 – 71.
7. Chiang Y M, Kingery W D, Birnie D P III. Physical Ceramics – PrinciplePhysical Ceramics – Principle for Ceramic Science and Engineering.USA: John Wiley & Sons; 1997.USA: John Wiley & Sons; 1997. p. 110-111.
8. Nobre M A L.Nobre M A L. Estudo da Formação de Fases no Sistema ZnO.Sb2O3 por Síntese Química e Efeito de Cátions de Metais de Transição sobre a Cristalinidade.[Tese de Mestrado em Química não publicada]. São Paulo: Universidade Federal de São Carlos; Brazil; 1995.
9. Poleti D, Vasovié D, Karanovié L J, Brankovié Z. Synthesis and Charac-terization of Ternary Zinc-Antimony-Transition Metal Spinels. Journal of Solid State Chemistry, SEP 1994; 112(1):39-44.
10. Gama L F V.Gama L F V. Estudo e Caracterização da Síntese do Espinélio Zn7Sb2O12 dopado com Níquel pelo Método Pechini. [Tese de Doutorado não pub-licada]. São Paulo: Universidade Federal de São Carlos; Brazil; 2000. 11. Hie A, Antie B, Poleti D, Rodie D, Petrovié-Prelevié I, Karanovié Lj.
Cation Distribution and Magnetic Properties of Ternary Zn2,33-xCoxSb0,67O4 Spinels. Journal of Physcal Ceramic Matterial; APR 1 1996; 8(14):2317-2325.
12. Colinas J M, Areán CO, Kinetics of Solid-State Spinel Formation: Effect of Cation Coordination Preference. Journal of Solid State Chemistry. MAR 1994; 109(1):43-46.
13. Rulmont A, Tarte P, Almou M. Low Frequency Vibrational Spectra of Cristalline and Glassy Metaborates Ba2MII(B
3O6)O2 (MII = Mg, Ca, Ni,
Co, Cd). In:In:Spectrochimica Acta, 1993. p.1695-1702.
14. Nakamoto K. Infrared Spectra of Inorganic and Coordination Com-pounds. Ed.. New York: John Willey and Sons, 1970. p.143.
15. Zheng W, Pang W, Meng G. Hydrothermal Synthesis and Characteriza-tion of Perovskite – Type Ba2SbMO6 (M = In, Y, Nd) Oxides. Materials Letters. 1998; 37(4-5):276-280.
16. Preudhomme J, Tarte P. Infrared Studies of Spinels - II: The Experimental Bases for Solving the Assignment Problem. In: Spectrochimica Acta, 1971. p.845-851.
17. Kustová G N, Burgina E B, Volkova G G, Yurieva T M, Plyasova L M. IR Spectoscopic Investigation of Cation Distribution in Zn – Co Oxide Catalysts with Spinel Type Structure. Journal of Molecular Catalysis A: Chemical. 2000; SEP 8 158(1):293-296.
18. Lenglet M, Lefez B. Infrared Optical Properties of Cobalt (II) Spinels. Solid State Communications. 1996; 98(8):689-694.
19. Djambazov S, Ivanova Y, Yoleva A. Ceramic Pigments on the Base of the CoO-ZnO-SiO2 System Obtained by a Sol-Gel Method. Ceramic International. 1998; 24(4):281-284.