A concrete element when kept under sustained load presents progressive strain over time, associated to the creep. In reinforced concrete col-umns, such deformations cause the stress increase in the steel bars of the reinforcement and may induce the material to undergo the yielding phenomenon. The pioneering formulations about the creep effect, developed on the base of creep coeficient, are applicable, especially, when the stress magnitude remains constant. Its application to reinforced concrete members, which exhibits change in stress magnitude, requires simplii -cations of which result the memory models, which have the disadvantage of requiring the storage of the stress history. To overcome the dificulties related to the excessive demand for computer memory, State models have been developed that dispense such robustness of storage. The subject of this work is the analysis of creep deformations in reinforced concrete columns on the base of a state model ixing its physical parameters from results obtained through the NBR 6118/07 formulation. The results showed that, in the elapse of the phenomenon, occurs stresses transfer from the concrete mass to the reinforcement steel bars which, in turn, have the effect of restrain the creep strains, conirming, in some cases, an im -minent material yielding condition.
Keywords: reinforced concrete, column, creep, simulation.
Um elemento de concreto quando mantido sob tensão apresenta deformação progressiva no decorrer do tempo, aditiva à deformação imediata ao carregamento. Em pilares de concreto armado, as deformações por luência promovem o acréscimo de tensões nas barras de aço, podendo induzir o material a experimentar o escoamento. As formulações pioneiras do efeito de luência, desenvolvidas com base no coeiciente de lu -ência, são aplicáveis, sobretudo, quando as tensões se mantêm constantes. Sua aplicação a elementos de concreto armado, que apresentam variações de tensões, requer simpliicações das quais resultam os modelos de memória, que têm a desvantagem de exigir o armazenamento do histórico de tensões. Para suplantar as diiculdades ligadas à excessiva demanda de memória de computador, foram desenvolvidos os modelos de estado que dispensam tal robustez de armazenamento. O objetivo deste trabalho é a análise das deformações por luência em pilares de concreto armado, realizada com base em um modelo de estado, com parâmetros ixados a partir da formulação da NBR 6118/07. Os resultados obtidos revelaram que, no decorrer do fenômeno, veriica-se a transferência de esforços do concreto para as barras da armadura de aço, que por sua vez exercem o efeito de contenção das deformações correlatas, conirmando-se, em alguns casos, o estabelecimento de uma condição de iminente escoamento do material.
Palavras-chave: concreto armado, pilar, luência, simulação.
Creep strains on reinforced concrete columns
Deformações por luência em pilares de concreto armado
E. L. MADUREIRA a
T. M. SIQUEIRA a
E. C. RODRIGUES a
Abstract
1 Introduction
The state of stresses due to sustained load, promotes strains in concrete members which progresses over time, character-izing the phenomenon known as creep.
Such kind of deformations results, particularly, from the vis-cous behaviour associated to the adsorbed water layer at the cement grains surface, in the hardened concrete (Mc-GREGOR, 1997), apud [8].
The creep deformations are more pronounced in the first months of the structure lifetime, when develop under higher rates. It can extend for periods of time up to ten years, al-though in more advanced stages, it evolves over modest rates. There are cases in which the creep deformations can take magnitudes greater than three times the deformation at the instant of loading, inducing structural displacements of simi-lar magnitude [8].
Among the relevant factors that influence the creep deforma-tion it may include environmental moisture, the ratio of the ap-plied stress to the concrete strength, and the reinforcement. In the case of reinforced concrete members, the deforma-tions due to creep can modify significantly the stress fields in their constituents. In columns, specifically, it can promote the stress reduction on the mass of the concrete and the stress increase in the steel bars, which can induce the latter to ex-perience the yielding phenomenon.
The pioneering formulations for creep deformation model-ling were developed from the creep coefficient concept. They are applied, in particular, to elements for which the stresses on the concrete remain constant over time. Their adequacy for reinforced concrete members, which exhibit stress variations during the phenomenon, depends on the application of simplifier artifices that result on memory mod-els. These kinds of formulations are so named because they demand, in its calculation, the history of stresses storage, resulting in large-scale storage amount that can become the modelling unfeasible.
In order to overcome the difficulties related to the storage robustness, it was developed the state models that provide the use, exclusively, of the stresses at the moment before the considered instant.
The aim of this work is the simulation of the creep strain on reinforced concrete columns, based on a state model, whose parameters were fixed from results obtained by NBR 6118/07 formulation, focused, above all, for the analysis of the rein-forcement and moisture rate influences on the phenomenon.
2. Modelling
2.1 Concrete response to loading
The numerical analysis was performed according to incre-mental iterative procedure and finite element approach. The adopted mathematical modelling is based on the orthotropic nonlinear formulation proposed by Kwak and Filippou [7] in plane state of stress, from which the constitutive matrix ele-ments to be used are defined through equations similar to those employed in uniaxial state of stress, however, taking as
a reference, the equivalent deformations “εei”, that, for every one of the principal directions are given by:
(1)
iij ij i
ei
e
D
e
/
D
e
=
+
The “i” and “j” indexes refer to principal plane direction. The “Dij” parameters represent the constitutive matrix elements.
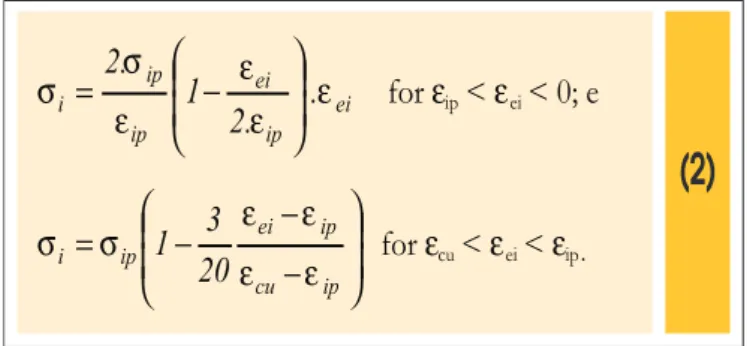
For the simulation of concrete in compression it was adopted the constitutive relationships proposed by Hognestad [3], presented in the form:
(2)
eiip ei
ip ip
i
1
.2
.
.2
e
e
e
e
s
s
÷
÷
ø
ö
ç
ç
è
æ
-=
for
e
ip<
e
ei< 0; e
÷
÷
ø
ö
ç
ç
è
æ
-=
ip cu
ip ei ip
i
1
20
3
e
e
e
e
s
s
for
e
cu<
e
ei<
e
ip.The parameters “σip” and “εip” represent the concrete peak stress and its correspondent strain beyond every “i” principal direction, and “εcu” is the ultimate strain. These equations represent the hard-ening and softhard-ening branches, OA and AB, respectively, of the curve in igure 1.
For the representation of the concrete behaviour in tensile stress, was adopted the smeared crack model, whose advantages are consider the continuity of the displacement ields, and to dispense modiications of topological character in inite element mesh, in the course of the processing inherent to its stages of calculation, as shown in [7].
In addition, it was adopted the multidirectional cracking pattern, represented by a system of mutually orthogonal cracks, in which the inclination of their plans depends on the current state of stress and may change according the loading stage.
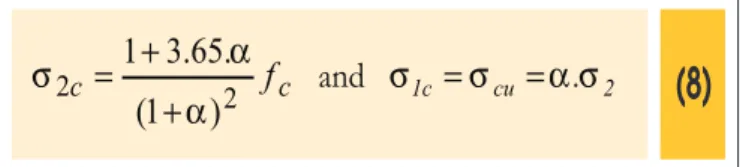
where, β1=σ1/fc and β2=σ2/fc are the principal stresses with
0 > σ1 > σ2. “fc” is the concrete uniaxial compressive strength. If in
equation 7 it is considered
α
=
σ
1/
σ
2, the concrete peak stresses,on the principal directions, will be given by:
(8)
c
c
2
f
2
)
1
(
.
65
.
3
1
a
a
s
+
+
=
and
s
1c=
s
cu=
a
.
s
2The strains related to peak stresses in biaxial compression state, “ε2p” and “ε1p”, according to [7], are obtained from the expressions:
(9)
and
(
3
22
)
co p
2
=
e
b
-e
(
13 12 1)
co p
1
e
1
.
6
b
2
.
25
b
0
.
35
b
e
=
-
+
+
where
c p 1 1
f
σ
β
=
andc p 2 2
f
σ
β
=
. The parameter “εco” is thecorresponding deformation to the stress peak compression in uni-axial state of stress.
For concrete subjected to biaxial state of stress, it was adopted the constitutive relationship on incremental form proposed by Desai and Siriwardance, (apud [7]), written by equation 10.
(10)
.
).G
-(1
0
0
0
E
.
E
0
E
1
1
12
2
1
2
2
2
1
2
1
1
2
12
2
1
g
e
e
n
n
n
n
t
s
s
d
d
d
E
E
E
d
d
d
-=
The concrete behaviour, for deformations lower than that corre-sponding to the tensile strength, segment OC of the curve in igure
1, is considered to be linear elastic. For deformations of higher magnitude, its behaviour is plastic with softening, being represent-ed by segment CD, deined, even, as the value of the ultimate
tensile deformation, “εo”.
The cracked concrete ultimate deformation, assuming that the stiff-ness is uniform on the entire inite element, would be given by:
(3)
t f o
=
2
.
f
G
e
Where the “ft” e “Gf” parameters represent, respectively, the tensile strength and the fracturing energy per unit of area of concrete, the latter deined according to the CEB-FIP model code 1990 criteria [2]. However, the cracking pattern promotes disturbance on the unifor-mity and continuity of the mass of concrete, inducing variation of mechanical properties within the inite element. The larger the size of the inite element, the greater will be the variation of stiffness in its interior. In order to compensate the errors arising from such variations, in this work, for elements greater than 75 mm length, it is used the proposed resource by Kwak and Filippou [7], by setting the ultimate tensile strain from:
(4)
)
b
075
,
0
.(
f
)
b
/
075
,
0
ln(
.
G
.
2
t f
o
=
-e
to which “b” is the inite element dimension expressed in meters.
The adopted concrete deformation module is the secant modulus, “EC”, that is obtained from:
(5)
0 c
0
,
85
E
E
=
Where the “Eo” parameter is the initial deformation modulus, that is expressed according to [1], on the form of equation:
(6)
(MPa)
f
5600
Ε
0=
ckIn which the “fck” parameter is the concrete characteristic compres-sive strength.
The concrete ultimate stresses are deined from the failure enve -lope proposed by Kupfer and Gerstle [6], igure 2, whose analytical representation in biaxial compression state is:
(7)
0
65
.
3
)
(
b
1+
b
2 2-
b
2-
b
1=
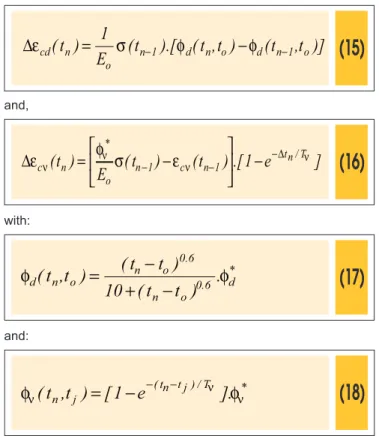
and “φv(t,τ)” represent their respective creep coeficients. In their
incremental versions these parcels are presented in the form:
(15)
)]
t,
t(
)
t,
t
(
).[
t(
E
1
)
t
(
n 1 d n o d n 1 oo n
cd
=
s
-f
-
f
-e
D
and,(16)
]
e
1
.[
)
t(
)
t(
E
)
t(
tn/T1 n c 1 n o * n
cn
f
ns
e
n D ne
D
- -ú
-
-û
ù
ê
ë
é
-=
with:(17)
* d 6 . 0 o n 6 . 0 o n o n d.
)
t
t
(
10
)
t
t
(
)
t,
t
(
f
f
-+
-=
and:(18)
* T / ) j t n t ( jn
t,
)
[
1
e
].
t
(
n nn
f
f
=
-
--Where “φ* d” and “φ
*
v” are the asymptotic creep coeficient values for
those two parcels, and “Tv” the retardation time. “tn” is the instant for which the creep deformations are being calculated, “tn-1” is the discrete instant, immediately preceding the instant “tn”, and “to” is the concrete age at the instant of loading.
At every instant “tn” the creep strains are described according:
(19)
)
t
(
)
t
(
)
t
(
n c n 1 c nc
e
D
e
e
=
-+
On equation 10 “dσ1”, “dσ2” e “dτ12” are the stress increments on
the principal directions. The “Ei’s” parameters are the tangent de-formation modules relating to such directions and “ν” is the Pois -son’s ratio. The “G” parameter is the transversal deformation mod-ule that is given by:
(11)
(
1 2 1 2)
2).
G
0
.
25
E
E
2
E
.
E
1
(
-
n
=
+
-
n
In this analysis were adopted the quadratic approximation isopara-metric inite elements.
The mass of concrete region is represented by plane eight-node quadrilateral elements Q8, as shown in igure 3.a.
2.2 Steel response to loading
The steel behaviour is considered as elastic perfectly plastic. Due to the great transverse lexibility of the reinforcement steel bars, only axial stiffness is considered, and then they are simulated by bar three-node elements L3, igure 3.b. In this way, the related
stiffness matrix “K” is expressed by:
(12)
ú
ú
ú
û
ù
ê
ê
ê
ë
é
=
2
1
1
-1
1
0
1
0
1
L
AE
2
K
where the parameter “E” represents the steel Young’s modulus, which is considered equal to 210,000 MPa. “A” is the reinforcement cross section area, while “L” represents the bar inite element length.
2.3 Creep strains
The creep strains, “εc(t)”, are simulated from the state model proposed by Kawano and Warner [5], and they are obtained by equation 13.
(13)
)
t
(
)
t
(
)
t
(
cd cvc
e
e
e
=
+
(14)
ò
-=
t 0 d ocd
(
t
)
E
1
d
f
d
(
t
,t
t
)
s
(
t
)
d
t
e
and
ò
-=
t 0 oc
(
t
)
E
1
d
f
d
(
t
,t
t
)
s
(
t
)
d
t
e
nn
Where “εcd(t)” and “εcv(t)” are the deformations parcels due to hard-ening and visco-elastic effects, respectively. The functions “φd(t,τ)”
Figure 3 – Finite elements: a) Plane Q8; b) bar L3
where “
∆
ε
c(
t
n)
” is the incremental strain and is obtained from:(20)
)
t
(
)
t
(
)
t
(
n cd n c nc
D
e
D
e
ue
D
=
+
For the purposes of this work is assumed that, during every time interval, the stress magnitudes will remain constant. Its variation over all period of the observation of the phenomenon is expressed in terms of a step kind function.
3. Computer support
With a view to the acquisition of the results aimed at the fulilment of the objectives of this work, it was employed the software named “Análise Constitutiva Não-Linear” – ACNL [8]. Such program was structured according to incremental and iterative procedure and the Finite Elements Method (FEM), on a Nonlinear Orthotropic Formulation in plane state of stresses[7]. It even covers, in its al-gorithmic framework, the element formulations described in item 2.
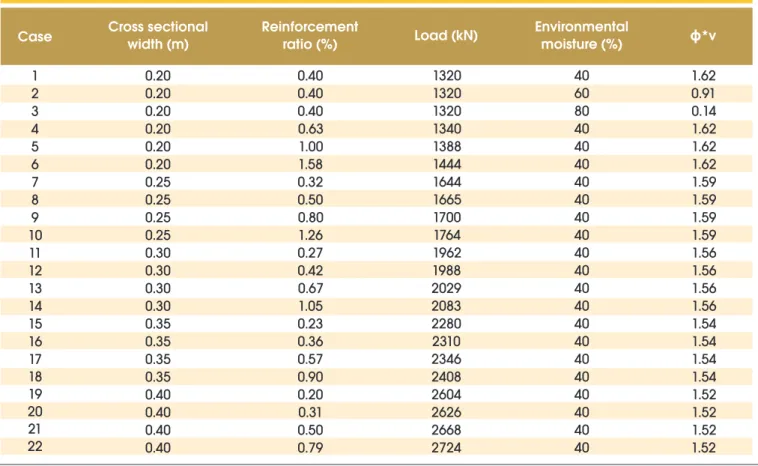
4. Analysed models
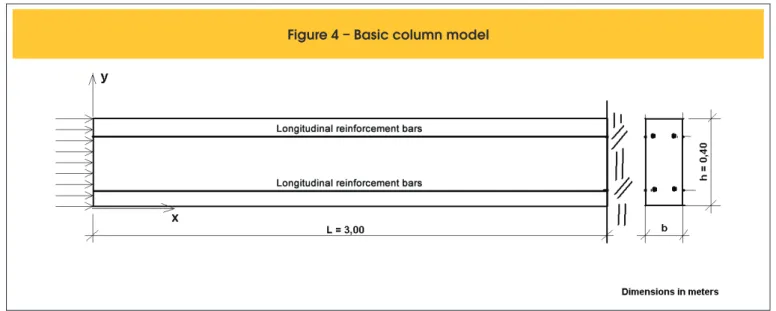
The models studied are columns 3.00 m length and rectangular cross section 0.40 m height and base that differs case-by-case, cast in concrete C 40, reinforced with CA-50 A steel bars, igure 4.
The structural member is subjected to a gradual loading process, by the action of a uniform distributed load along the height of the top section, whose magnitude progresses from zero to a inal value of 40% of the ultimate compressive stress of the concrete, table 1, taking into account the limitations, in terms of stresses, of the NBR 6118/07 creep model.
The analysis was performed on twenty-two cases, distinguished by the cross-sectional dimension, by the reinforcement ratio and the moisture of the environment, as shown in columns 2, 3 and 5, respectively, on table 1.
The problem domain has been deined from the rectangle whose horizontal dimension is equal to the column length, and the vertical
dimension is equal to its cross section height, and its discretization was performed on the basis of plane and bar elements, both 0.10 m dimensioned, resulting the mesh composed by 120 plane and 60 bar elements, igure 5. It is observed that in this case, as it hap -pens in the igures relating to stress and displacement ields, the structural member is being represented with its longitudinal axis coinciding with the horizontal direction on the plane of the page (“x” direction).
The age of the concrete at the instant of loading was set as 30 days. It was considered that all the perimeter of the column surface is exposed to the environment contact. The retardation time was valued as Tv = 600 days. The asymptotic hardening creep coef-icient was considered as being φd* = 2,00, as recommended by Kawano and Warner [5]. The asymptotic creep coeficient related to visco-elastic effects, φν*, exhibit distinct values case to case, table 1, being obtained by the difference between the total asymp-totic creep coeficient of NBR 6118/07 and the asympasymp-totic harden -ing creep coeficient.
The analysis was performed according to the “Plane State of Stresses”.
The chart in igure 6 shows the curves of the creep coeficient evo -lution with time, drawn from results obtained by the NBR 6118/07 model and the state model adopted in this work. It is noted a good agreement between them, conirming up that the values adopted for the state model parameters were properly ixed.
For the purposes of assessing the creep phenomenon longevity, the maximum age limit of concrete was set as 3000 days, which corresponds to the time from which the creep coeficient, virtually, stabilizes, igure 6. For the numerical simulation purposes such period of time was discretized from instant observation at 60, 120, 250, 500, 1000, 2000 and 3000 days.
5. Program validation
The program eficiency was checked from the comparison of its results with their corresponding obtained from a simpliied algo -rithm, based on the Solid Mechanics principles. In the design of the latter is considered, above all, the Bernoulli hypothesis accord-ing which the sections initially planes remain in this fashion duraccord-ing
the loading stage and after having achieved the equilibrium for the inal load.
In the simpliied model the creep strain “εf (t1 , t0)” developed be-tween the moment of loading “to” and the irst instant of analysis
“t1” is given from:
(21)
)
t,
t
(
E
)
t,
t
(
1 0c 0 0 1
f
s
f
e
=
Where “σo” is the stress on the concrete in the instant of loading, “Ec” is the concrete deformation module at 30 days and “φ(t1 , to)”
is the creep coeficient between the instants “to” and “t1”. The strain increase “Δεf(tk , tk-1)” between the “tk-1” e “tk” time stage will be:
(22)
[
]
å
-= -1 k 1 i i 1 k i k ci
(
t
t,
)
(
t
t,
)
E
f
f
s
D
[
-]
-
=
k 0-
k 1 0+
c 0 1 k k
f
(
t
t,
)
s
E
f
(
t
t,
)
f
(
t
t,
)
e
D
Where “Δσi” represents the stress magnitude variation given by:
Table 1 – Characterization of the studied cases
Case
Cross sectional
width (m)
Reinforcement
ratio (%)
Load (kN)
Environmental
moisture (%)
ɸ
*v
1
2
3
4
5
6
7
8
9
10
11
12
13
14
15
16
17
18
19
20
21
22
0.20
0.20
0.20
0.20
0.20
0.20
0.25
0.25
0.25
0.25
0.30
0.30
0.30
0.30
0.35
0.35
0.35
0.35
0.40
0.40
0.40
0.40
0.40
0.40
0.40
0.63
1.00
1.58
0.32
0.50
0.80
1.26
0.27
0.42
0.67
1.05
0.23
0.36
0.57
0.90
0.20
0.31
0.50
0.79
1.62
0.91
0.14
1.62
1.62
1.62
1.59
1.59
1.59
1.59
1.56
1.56
1.56
1.56
1.54
1.54
1.54
1.54
1.52
1.52
1.52
1.52
1320
1320
1320
1340
1388
1444
1644
1665
1700
1764
1962
1988
2029
2083
2280
2310
2346
2408
2604
2626
2668
2724
40
60
80
40
40
40
40
40
40
40
40
40
40
40
40
40
40
40
40
40
40
40
(23)
1i i i
=
s
-
s
-s
D
In addition, “φ(tk , ti)” is the creep coeficient between any instants
“ti” and “tk”. Equations 21 and 22 were corrected with the purpose to consider the steel reinforcement effect, resulting:
(24)
ss c c
c c o
1 f o 1 corr ,
f
(
t
t,
)
= e
(
t
t,
)
E
A
E
+
A
E
A
e
and
(25)
s s c c
c c 1
k k f 1 k k corr ,
f
(
t
t,
-)
=
D
e
t(
t,
-)
E
A
E
+
A
E
A
e
D
where the “EcAc” and “EsAs” products represent the concrete and the steel axial stiffness, respectively.
The strains are then obtained from:
(26)
å
=
-+
=
i
2 k
1 k k corr , f 0
1 corr , f i
f
(
t
)
e
(
t
t,
)
D
e
(
t
t,
)
e
For the validation purpose were considered the cases 3 and 6, table 1, noting up good agreement of results, igure 7. In case 6, the differences at 60 days and 3000 days were, exceptionally, the largest, reaching percentages about 4.5% and 6%, respectively. For the other concrete ages of the case 6 and all ages of the case 3, the differences did not reach the percentage of 2.5%. The ob-tained results from the program were comparatively bigger, which can be attributed to the fact that this computational tool take into account, distinctly of the simpliied analytical algorithm, the warp
-ing of the cross sections, which, indeed, is signiicant in the column top vicinity, and is intensiied during creep deformations.
6. Results and discussion
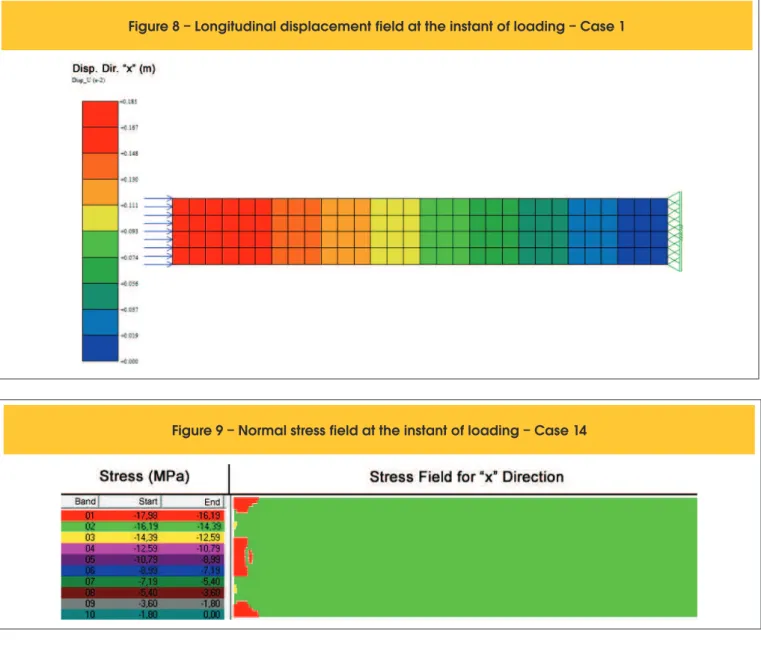
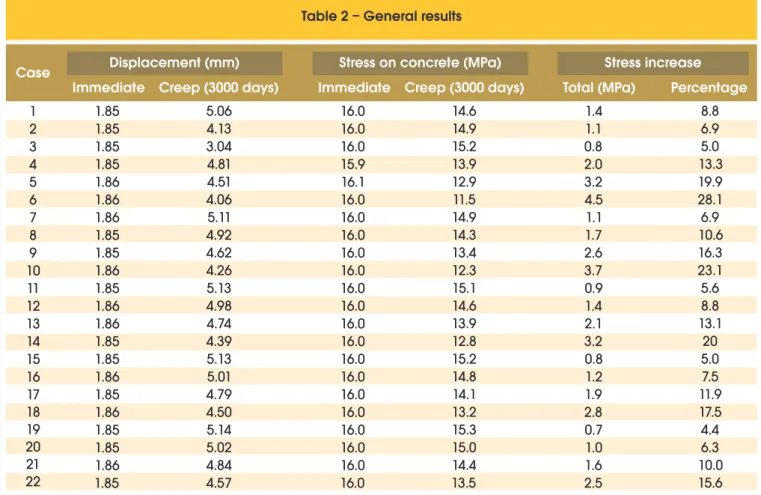
When the equilibrium coniguration referring to inal load was reached, the axial displacements and normal stresses ield took the morphologies shown in igures 8 and 9, respectively. For all studied cases, the displacement magnitude at the top of the col-umn and the stress on the mass of the concrete, were about 1.85 mm and 16 MPa, respectively, table 2.
By examining the stresses ield, igure 9, it may be noted that the overall solid features, shows discrete stress variations, except on the region near its top, which is the loading introduction zone, where it may be observed tenuous disturbance.
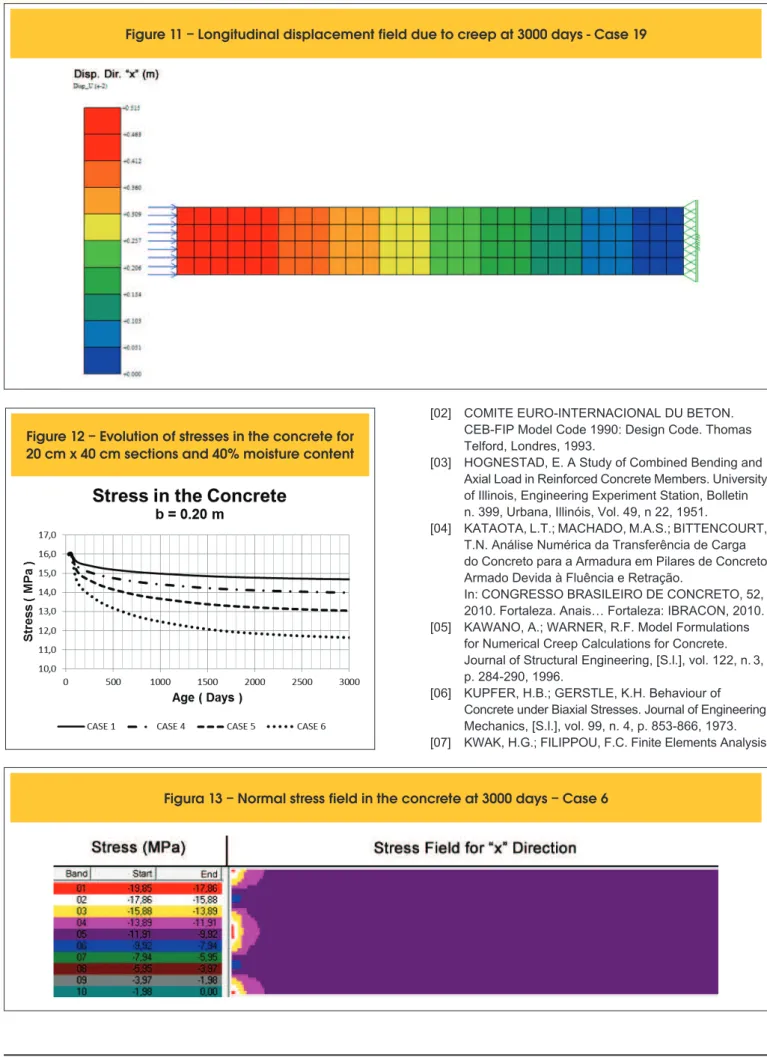
The displacement curves over time has showed similar trend, reg-istering the inal values given in table 2. For cases 1, 4, 5 and 6, the creep strains evolved according the curves of igure 10. At 3000 days the corresponding ields took over distribution similar to that presented in igure 11. The smallest increase of creep dis -placements was about 3 mm, corresponding to 1.7 times the dis-placement at the instant of loading that was registered for case 3, which refers to the highest moisture content. The largest creep displacement was about 5 mm, which is 2.8 times the presented displacement at the instant of loading, that was noted for the case 19, concerning to the lowest moisture content and the lowest rein-forcement ratio.
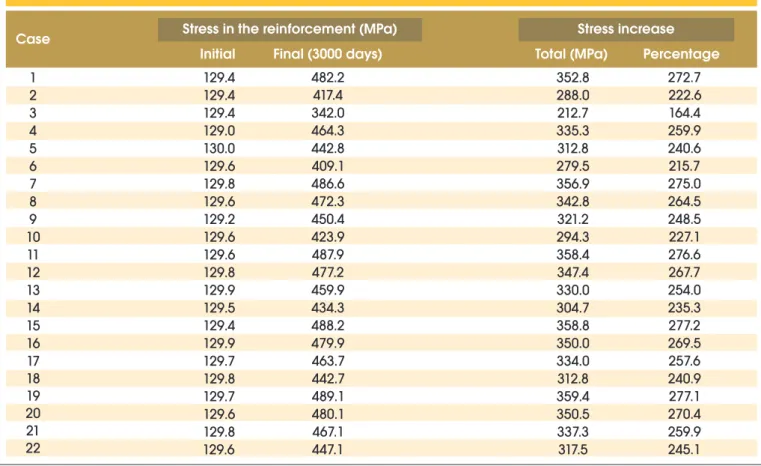
Due to creep deformations the mass of the concrete experienced stress relief. For cases 1, 4, 5 and 6, the magnitudes evolved in accordance to the curves of igure 12. For the other cases, the curves display similar fashion, differing mainly with regard to its values, table 2. The stresses ield have stabilised at 3000 days, showing a similar way as illustrated in igure 13. The lower stress relief was about 4%, registered in case 19, while the highest was about 28%, veriied to the case 6, referring to the lowest and high -est reinforcement ratio, respectively. It is observed that the creep strains intensiied the stress disturbance at the column top region. The stresses on the reinforcement steel bars, in the cases 1, 4, 5 and 6, evolved according the curves of igure 14, noting up vertiginous increases, after elapsed 3000 days. For the other cases the shapes
of curves were similar, however, with different magnitudes, table 3. The smallest overstress was registered to the case 3, referring to the largest environmental moisture content, whose variation was about 164%, while the largest was observed in case 15, which corresponds to the lowest reinforcement ratio, culminating in a variation about 277%, table 3. For cases 1, 7, 11, 12, 15, 16, 19 and 20, which are associated with the lowest moisture content and the lowest reinforce-ment ratio, table 1, ocurrs the proximity of the steel yielding condition, representing imminent risk of the structural member collapse, table 3. From the analysis of the curves in igure 15, it is noted that the creep displacements on the column top are smaller for larger reinforcement ratios, revealing its strain restraint effect. It should be noted that to reinforcement ratio about 1.58% the effective creep coeficient inal value, that is deined as the ratio between the column shortening due to creep and its value at the instant of loading, was about 2.18, and, therefore, 40% lower than their corresponding, evaluated for the concrete with no reinforcement, which is equal to 3.62, table 4. With respect to the environmental moisture inluence on creep dis -placements, igure 16, it was showed its inhibiting trend on the
phenomenon intensity, given that, for the case of reinforcement ra-tio about 0.4% and cross-secra-tion 0.20 m wide, the effective creep coeficient was about 2.73 for moisture content about 40%, 2.23 for moisture content about 60% and 1.65, for moisture content about 80%, so that it was observed a reduction of up to 40% on that parameter value.
7. Conclusions
This work refers to the creep strains analysis in reinforced concrete column, on the basis of a state model, from a non-linear orthotropic formulation and the inite element approximation.
In order to the fulilment of this subject, it was studied some cases differentiated among themselves by the adopted reinforcement and the environmental moisture content.
The obtained results showed that for the environmental conditions adopted and the parameters of the cases analysed, the creep strains virtually stabilises themselves at 3000 days of the concrete age. Furthermore, it was noted the occurrence of stress relief in the
con-Figure 8 – Longitudinal displacement field at the instant of loading – Case 1
crete according to values as greater as higher the adopted rein-forcement ratio, agreeing with the trend reported in [4].
The analysis object of this study even pointed out the occurrence of stress increase on the steel bars that, for lower reinforcement
ratio cases, culminated with the approach of the material yielding condition, although this aspect has not been reported in [4]. In addition, it was observed that the effective creep coeficient, de -ined as the ratio between the column shortening due to creep and the observed contraction at the instant of loading, assumed values as lower as higher the reinforcement ratio, thus conirming its effect of deformation restraint.
The obtained results corroborated the trend reported by the scien-tiic literature on the subject, with regard to the moisture content in -luence on the creep effect, since the related deformation observed was as higher as smaller the value of this parameter.
8. Acknowledgements
This report is part of a research work on the numerical simulation of the creep strains on reinforced concrete members supported by the Fundação Coordenação de Aperfeiçoamento de Pessoal de Nível Superior – CAPES and by the Pró-Reitoria de Pesquisa da Universidade Federal do Rio Grande do Norte – UFRN. Their sup -port is gratefully acknowledged.
9. References
[01] ASSOCIAçãO BRASILEIRA dE NORMAS TéCNICAS. NBR 6118: Projeto de Estruturas de Concreto -
Table 2 – General results
Case
Displacement (mm)
Stress on concrete (MPa)
Stress increase
Immediate
Creep (3000 days)
Immediate
Creep (3000 days)
Total (MPa)
Percentage
1
2
3
4
5
6
7
8
9
10
11
12
13
14
15
16
17
18
19
20
21
22
1.85
1.85
1.85
1.85
1.86
1.86
1.86
1.85
1.85
1.86
1.85
1.86
1.86
1.85
1.85
1.86
1.85
1.86
1.85
1.85
1.86
1.85
16.0
16.0
16.0
15.9
16.1
16.0
16.0
16.0
16.0
16.0
16.0
16.0
16.0
16.0
16.0
16.0
16.0
16.0
16.0
16.0
16.0
16.0
1.4
1.1
0.8
2.0
3.2
4.5
1.1
1.7
2.6
3.7
0.9
1.4
2.1
3.2
0.8
1.2
1.9
2.8
0.7
1.0
1.6
2.5
5.06
4.13
3.04
4.81
4.51
4.06
5.11
4.92
4.62
4.26
5.13
4.98
4.74
4.39
5.13
5.01
4.79
4.50
5.14
5.02
4.84
4.57
14.6
14.9
15.2
13.9
12.9
11.5
14.9
14.3
13.4
12.3
15.1
14.6
13.9
12.8
15.2
14.8
14.1
13.2
15.3
15.0
14.4
13.5
8.8
6.9
5.0
13.3
19.9
28.1
6.9
10.6
16.3
23.1
5.6
8.8
13.1
20
5.0
7.5
11.9
17.5
4.4
6.3
10.0
15.6
[02] COMITE EURO-INTERNACIONAL dU BETON. CEB-FIP Model Code 1990: design Code. Thomas Telford, Londres, 1993.
[03] HOGNESTAD, E. A Study of Combined Bending and Axial Load in Reinforced Concrete Members. University of Illinois, Engineering Experiment Station, Bolletin n. 399, Urbana, Illinóis, Vol. 49, n 22, 1951.
[04] KATAOTA, L.T.; MACHADO, M.A.S.; BITTENCOURT, T.N. Análise Numérica da Transferência de Carga do Concreto para a Armadura em Pilares de Concreto Armado devida à Fluência e Retração.
In: CONGRESSO BRASILEIRO dE CONCRETO, 52, 2010. Fortaleza. Anais… Fortaleza: IBRACON, 2010. [05] KAWANO, A.; WARNER, R.F. Model Formulations
for Numerical Creep Calculations for Concrete. Journal of Structural Engineering, [S.l.], vol. 122, n.3, p. 284-290, 1996.
[06] KUPFER, H.B.; GERSTLE, K.H. Behaviour of Concrete under Biaxial Stresses. Journal of Engineering Mechanics, [S.l.], vol. 99, n. 4, p. 853-866, 1973. [07] KWAK, H.G.; FILIPPOU, F.C. Finite Elements Analysis
Figure 11 – Longitudinal displacement field due to creep at 3000 days - Case 19
Figure 1
2 – Evolution of stresses in the concrete for
20 cm x 40 cm sections and 40% moisture content
Case
Stress in the reinforcement (MPa)
Stress increase
Initial
Final (3000 days)
Total (MPa)
Percentage
1
2
3
4
5
6
7
8
9
10
11
12
13
14
15
16
17
18
19
20
21
22
129.4
129.4
129.4
129.0
130.0
129.6
129.8
129.6
129.2
129.6
129.6
129.8
129.9
129.5
129.4
129.9
129.7
129.8
129.7
129.6
129.8
129.6
352.8
288.0
212.7
335.3
312.8
279.5
356.9
342.8
321.2
294.3
358.4
347.4
330.0
304.7
358.8
350.0
334.0
312.8
359.4
350.5
337.3
317.5
482.2
417.4
342.0
464.3
442.8
409.1
486.6
472.3
450.4
423.9
487.9
477.2
459.9
434.3
488.2
479.9
463.7
442.7
489.1
480.1
467.1
447.1
272.7
222.6
164.4
259.9
240.6
215.7
275.0
264.5
248.5
227.1
276.6
267.7
254.0
235.3
277.2
269.5
257.6
240.9
277.1
270.4
259.9
245.1
Table 4 – Longitudinal displacement on the column top
Case
Displacement (mm)
Creep coefficient
Initial
Creep (3000 days)
Effective
NBR
Difference (%)
Figure 16 – Creep displacements according the
environmental moisture for 0.40% reinforcement ratio
Figure 1
4 – Evolution of stresses in the reinforcement
for 20 cm x 40 cm sections and 40% moisture content
Figure 15 – Creep displacements according the
reinforcement ratio for 40% moisture content
of Reinforced Concrete Structures Under Monotonic Loads. Report UCB/SEMM-90/14, Berkeley, Califórnia, 1990. [08] MADUREIRA, E.L. Simulação Numérica do
Comportamento Mecânico de Elementos de Concreto Armado Afetados pela Reação Álcali-Agregado. 2007. Tese (doutorado em Engenharia Civil) – departamento
de Engenharia Civil - Universidade Federal de Pernambuco, Recife, 2007.