Abstract
A mineral deposit can be exploited by underground methods or by open pit methods, deined according to their characteristics, especially in relation to depth and geometry of the ore body and the economic feasibility of the methods. However, there are cases in which the alternative that represents the best return for the project is the application of combined methods, i.e., the open pit followed by underground mining. In these situations, the major dificulty is the deinition of the transition point of meth-ods, seeking to maximize the net present value of the project and the use of mineral resources. The premature suspension of activities in the open pit, as well as advanc-ing beyond the optimum depth, can derail the implementation of the combination of methods, so it is important to analyze the project not only individually but also in an integrated way.
Keywords: mine planning; open pit optimization; underground mining; methods transition.
Resumo
Um depósito mineral pode ser explorado por métodos subterrâneos ou por mé-todos a céu aberto, sendo tal ação deinida de acordo com as suas características, principalmente em relação à profundidade e à geometria do corpo de minério e aos aspectos econômicos de viabilidade dos métodos. Contudo existem casos em que a alternativa que representa melhor retorno para o projeto é a aplicação dos métodos combinados, ou seja, a lavra a céu aberto seguida da lavra subterrânea. Nessas situa-ções, a grande diiculdade é a deinição do ponto de transição de métodos, de forma a maximizar o valor presente líquido do projeto e o aproveitamento dos recursos mi-nerais. A suspensão prematura das atividades a céu aberto, bem como o avanço além da profundidade ideal, pode inviabilizar a aplicação da combinação de métodos, portanto é importante que o projeto seja analisado não só de forma individual, mas, também, de forma integrada.
Palavras-chave: planejamento de mina; otimização de cava; lavra subterrânea; transição de métodos.
Project optimization
Otimização de projeto
Carla De Carli
Universidade Federal do Rio Grande do Sul, Mining Engineering
Porto Alegre – Rio Grande do Sul - Brazil [email protected]
Peroni Rodrigo de Lemos
Universidade Federal do Rio Grande do Sul, Mining Engineering
Porto Alegre – Rio Grande do Sul - Brazil [email protected]
http://dx.doi.org/10.1590/0370-44672015680018
1. Introduction
The OP mining methods have many advantages comparing to UG mining methods, such as the level of mecha-nization, the lower dilution and larger recovery of the deposit, lexibility and others (Bakhtavar et al., 2008). These advantages make the application of the OP methods more usual than the UG methods, even when the latter one
pres-ents also some favorable aspects, mainly related to reduction of the environmen-tal impact (Chadwick, 2008). Aiming to maximize the resources and/or the economical results of the mining enter-prise, several times the characteristics of the ore body suggest the application of combined methods. When it occurs, it is very important to ind out the right
moment of transition from OP to UG methods, because if this point is not well deined it can implicate in material losses as well as in the impossibility of applying underground mining after extraction by open pit due to the lack of remaining resources (Bakhtavar & Shahriar, 2007; Bakhtavar et al., 2008; Visser & Ding, 2007; Camus, 1992).
2. Methodology
In the process of looking for the optimal transition point from OP to UG mining, in scenarios where the combina-tion opcombina-tion gives better results than the individual application of the methods, different pits should be assessed with
their remaining resources, in order to determine the combination that presents the higher net present value for the project and maximizes the recovery of mineral resources. The scenarios of mining only by OP or only by UG methods should
also be analyzed, to conirm which op-tion generates the best return. Figure 1 shows a schematic example of different combinations of pits with their respective remaining UG resources and necessary development to access the ore body.
Figure 1
Combination of different scenarios (De Carli, 2013)
Figure 2 shows the lowchart of the sequence of steps suggested in this study to determine the optimal
transi-tion point of methods.
These steps will be applied to a gold deposit as case study, which
has a mineral body with charac-t e r i s charac-t i c s for charac-t h e appl i c acharac-t io n of combined methods.
DEFINITION OF ECONOMIC PARAMETERS
CUT OFF GRADE FOR OP
ECONOMIC VALUATION OF BLOCKS FOR OP
ECONOMIC VALUATION OF BLOCKS FOR UG
CUT OFF GRADE FOR UG
DEFITION OF OPTIMAL PIT
DEFITION OF REMAINING RESOURCES
UG DEVELOPMENT
SCENARIOS ANALYSIS
NEW SCENARIOS ANALYSIS REDEFINITION OF OPTIMAL PIT Figure 2
Flowchart of the sequence of steps used in the methodology
The Studio 3 and NPV Scheduler softwares were applied to assist in the search of required results in most of the steps.
As shown in Figure 2, the irst step is determining the economic parame-ters. Once these parameters are deined, it is possible to ind the minimum ore
grade that pays for all costs involved in the production, called Breakeven Cut Off Grade (BCOG), according to the equation (Rendu, 2008):
BCOG
=
C
M+
C
P+
C
G&AR
( -
P
CR)
Where:
C
M – Mining cost for ore (OP)C
P– Processing costC
G&A– General and administrative costsR
- RecoveryP
– Selling priceC
R – Reining costAlso, it is necessary to ind the Marginal Cut-Off Grade (MCOG),
considering that the extraction capacity is not restricted in a mine, according to
MCOG=
Inc + C
p+ C
G&AR
( -
P
CR)
Where: Inc – Incremental cost of transport
Each block of the model receives an economic value, according to its
clas-siication (Halatchev, 1999), applying the proit function (PF):
To generate the optimal pit, the software Studio 3 is applied. The mine life and the NPV can be found
determin-ing the block extraction sequence inside the pit.
For the UG scenario, the BCOG
is calculated with the same equation utilized in the OP scenario, but applying the economic parameters for UG mining:
Evaluated is the total of resources from topography, in the case of applying only UG methods, and also the remain-ing resources after pit exhaustion, in the case of applying combined methods.
To create the UG development, it is necessary to generate the grade shells, which are envelopes intended to make a separation of ore and waste contained in the ore body, based on cut-off grade, to cover only the material that should be
mined. The grade shells, as well as the ramps of development, can be created by software Studio 3. In this study, only the main access ramps were considered. In case the UG methods present the best economic results for the project, it is im-portant to detail the UG development. This study analyzes a deposit con-sidering just its measured and indicated resources, and three scenarios were generated: mining by OP, by UG and
by combined methods.
The results were compared to ind the best economic return to the proj-ect. Also, the results were compared to optimal transition depth obtained by OSR and ASR (Bakhtavar et al., 2008), a method that suggests that, to respect the viability of an OP project, the Overall Stripping Ratio should be always below the maximum Allowable Stripping Ratio.
3. Results
The economic parameters applied to the study case are shown in Table 1.
PF (ORE) = (AU * R * (P - C
R) - (CM + CP + C
G&A)
PF ( MARGINAL) = (AU * R * (P - C
R)) - ( INC + CP + C
G&A)
PF (WASTE) = - (C
MW)
Where: CMW– Mining cost for waste (OP)
BCOG
=
C
M+
C
P+
C
G&AR
( -
P
CR)
Where: CM – Mining cost for ore (UG)
CP – Processing cost
CG&A– General and administrative costs
R - Recovery
P – Sale price
CR – Reining cost
Mining cost- Ore US$ 2.9/t
Mining cost- Waste US$ 1.4/t
Processing cost+ G&A US$ 7.22/t treated
Refining cost US$ 11.00/oz Au (US$ 0,35/g Au)
Processing recovery 93%
Mining recovery 98%
Sale price Au US$ 1,200.00/oz Au (US$ 38.60/g Au)
Based on the economic parameters mentioned, the Breakeven Cut Off Grade
(BCOG) and the Marginal Cut Off Grade (MCOG) were calculated.
The results are in Table 2.
BCOG MCOG
0.285 g/t 0.245 g/t Table 2
BCOG and MCOG for OP.
The next step is the determination of the economic value of each block, applying the PF. As long as they are
economically evaluated, the optimal pit can be deined by running the pit optimization software (NPV Scheduler),
considering some premises related to geotechnical and production aspects according Table 3.
Slope angle Annual production Annual discount rate
Region 1: 45°/Region 2: 25° 1,500,000 t 7%
Region 3: 36°/Region 4: 47° Table 3
Input data to generate optimal pits.
The pits were generated up to 150% of its initial gold price, creating new pits at every 5% increment.
The pit of 100% of the gold price represents the maximum net present value for the open pit scenario (traditionally
considered the ultimate pit).
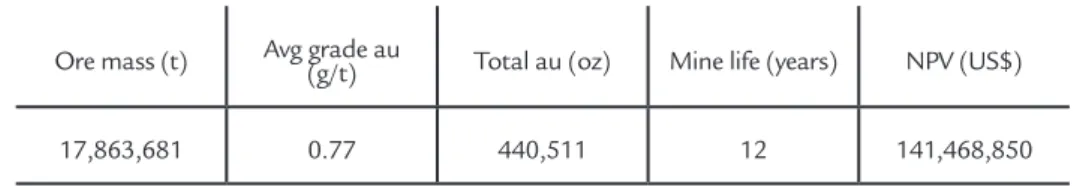
Table 4 shows the results of OP for the case study.
Ore mass (t) Avg grade au (g/t) Total au (oz) Mine life (years) NPV (US$)
17,863,681 0.77 440,511 12 141,468,850 Table 4
Results of final pit (100%).
The Overall Stripping Ratio (OSR) in the deposit must be smaller than the Allowable Stripping Ratio (ASR) to respect the viability of the method,
which means, the application of OP is more economical than the application of UG, since this relationship is respected. The ASR is characterized by the
maximum stripping ratio practiced in an open pit mine.
This relationship can be deter-mined by applying the equations:
Where: Cug – Prime cost of 1 ton of the mined mineral via UG (US$)
Cop – Prime cost of 1 ton of the mined mineral via OP (US$)
Cw – Total costs of 1 ton of ground re-moval via OP (US$)
ASR =
Cug - Cop
Cw
OSR =
Tw
To
Where: To – Tonnes of ore (US$) Tw – Tonnes of waste (US$)
The OSR was compared to the ASR, applying the equation above, and it was
lower than ASR, respecting the viability of the method, as shown in Table 5.
Table 5
Comparison of OSR and ASR.
Overall Stripping Ratio (OSR) Allowable Stripping Ratio (ASR)
5.3 26.5
The next scenario evaluated is the UG option alone. The BCOG of the deposit was calculated applying the same equation used in the irst scenario, however changing the OP mining costs for UG mining costs, and the result found was a BCOG of 1.33 g/t.
From the calculation of the BCOG, generated are the grade shells and the UG development (main ramps and crosses) to access them. Only when this step is concluded, is it possible to esti-mate the remaining resources, from the original topography and also from the
inal pit, considering the application of combined methods and the preliminary UG development necessary to access the main grade shells.
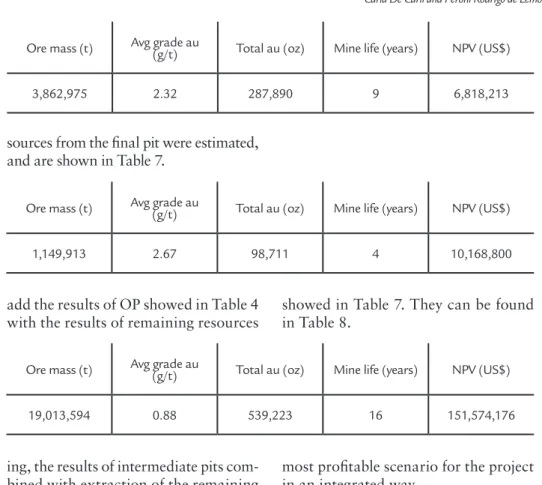
Ore mass (t) Avg grade au (g/t) Total au (oz) Mine life (years) NPV (US$)
3,862,975 2.32 287,890 9 6,818,213
Table 6 Resources for application of only UG methods.
In the case where combined methods were being applied, the remaining
re-sources from the inal pit were estimated, and are shown in Table 7.
Ore mass (t) Avg grade au (g/t) Total au (oz) Mine life (years) NPV (US$)
1,149,913 2.67 98,711 4 10,168,800
Table 7 Underground remaining resources from the final pit.
To find the total results of the combined methods, it is necessary to
add the results of OP showed in Table 4 with the results of remaining resources
showed in Table 7. They can be found in Table 8.
Table 8 Results of combined methods.
Ore mass (t) Avg grade au (g/t) Total au (oz) Mine life (years) NPV (US$)
19,013,594 0.88 539,223 16 151,574,176
In the case study, the combination of methods will be examined in more detail, since this scenario is the best option and a small variation of transi-tion depth represents a considerable variation of inal NPV. Along with the combination of optimum pit generated in scenario 1, with underground
min-ing, the results of intermediate pits com-bined with extraction of the remaining resources by UG methods will also be generated.
This approach is the main pro-posal in the methodology, since the analysis of what is determined as "op-timal pit" may not necessarily be the
most proitable scenario for the project in an integrated way.
The pits 60%, 70%, 80%, 90% and 100% of the price of gold were evaluated with their respective remain-ing resources, considerremain-ing the difference in total development for each case. The results are shown in Table 9.
Table 9 Results of different combinations of OP and UG.
Pit 100%+UG Pit 90%+UG Pit 80%+UG Pit 70%+UG Pit 60%+UG
Ore mass (t) 19,013,594 18,402,229 17,862,103 17,259,284 14,766,371
Grade Au
(g/t) 0.88 0.90 0.91 0.93 1.01
Total Au (oz) 539,223 530,382 522,304 515,777 477,580
Mine Life
(years) 16 16 15 15 13
NPV (US$) 151,574,176 151,903,449 153,308,887 152,404,996 146,168,595
Only OP Only UG Pit 80%+UG
Ore mass (t) 17,863,681 3,862,975 17,862,103
Grade Au (g/t) 0.77 2.32 0.91
Total Au (oz) 440,511 287,890 522,304
Mine Life (years) 12 9 15
NPV (US$) 141,468,850 6,818,213 153,308,887
Received: 19 November 2013 - Accepted: 24 September 2014.
4. Conclusions
The analysis of the deposit using the suggested methodology incurred some situations related to the geometry of the bodies and the connectivity of the mineralized zone between supericial and deep areas. Due to the characteristics of the deposit, different transition depths were analyzed. The results prove that, in some cases, what is considered optimum for OP is not necessarily so for the project in an integrated way. The best NPV was not found with the combination of the pit considered optimal in a scenario of OP,
but with the combination of the pit that represents 80% of the gold price with the succeeded mining by underground methods of its respective remaining resources. Besides providing the high-est NPV, this scenario also has the bhigh-est use of resources and consequently an extended mine life, increasing the time that the enterprise will spend on that site, which is important for environmental issues, depreciation, social development, among others.
The proposed methodology
deter-mines that the depth of transition should be analyzed through the use of a cyclical calculation of COGs integrating the use of mining softwares, considering the difference between the blocks of ore and waste in each one of the mining methods, since the operational costs involved in open pit and underground mining are not the same. This differentiation provides to the economic models and the decision making process greater precision in the deinition of transition depths and sce-nario interaction.
5. Acknowledgements
We would like to thank the LPM (Mine Planning and Mineral Research Laboratory) from UFRGS, as well as
the people from LPM, for the support and infrastructure provided to develop this study. Also, we thank the PPGE3M
(post graduating program) and the CNPq for the scholarship grant.
6. References
BAKHTAVAR, E., SHAHRIAR, K. Optimal ultimate pit depth considering an un-derground alternative. In: AACHEN International Mining Symposia- High Perfor-mance Mine Production, 4. Aachen, 2007
BAKHTAVAR, E., SHAHRIAR, K., ORAEE, K. An approach towards ascertaining open-pit to underground transition depth. Journal of Applied Sciences, v. 8, p. 4445–4449, 2008.
BAKHTAVAR, E., SHAHRIAR, K., & ORAEE, K. A Model for determining opti-mal transition depth over from open pit to underground mining. In: INTERNA-TIONAL CONFERENCE AND EXHIBITION ON MASS MINING. 5. Lulea, 2008. p. 393–400.
BAKHTAVAR, E., SHAHRIAR, K., ORAEE, K. An approach towards ascertaining open pit to underground transition depth. Journal of Applied Sciences, v. 8, p. 4445-4449, 2008.
CAMUS, J. P. Open pit optimization considering an underground alternative. In: IN-TERNATIONAL APCOM SYMPOSIUM, 23. Tucson, 1992. p. 435-441. CHADWICK, J. Open pit or underground (going underground, or not). International
Mining Magazine, p. 48–54, 2008.
De CARLI, C. Análise de projetos limite: lavra a céu aberto x lavra subterrânea. 2013. 124p. Porto Alegre: Universidade Federal do Rio Grande do Sul, 2013. 124p. (Dis-sertação de Mestrado em Engenharia de Pós-Graduação em Engenharia de Minas, Metalurgia e de Materiaias).
HALATCHEV, R. Company strategy – a basis for production scheduling of an open pit complex. In: PROCEEDINGS OF OPTIMIZING WITH WHITTLE. THIRD BIENNIAL CONFERENCE - STRATEGIC MINE PLANNING. Perth, 1999 p. 81-95.
RENDU, J. M. An Introduction to Cut-off Grade Estimation. Littleton: SME - Socie-ty for Mining, Metallurgy and Exploratioin, 2008. 112p.