RBCDH
Licence Creative Commom
CC
1 Universidade Federal do Paraná. Programa de Pós-Graduação em Educação Física. Curitiba, PR. Brasil.
2 Universidade Federal do Paraná. Centro de Pesquisa em Exercício e Esporte. Curitiba, PR. Brasil.
3 Universidade Federal de Santa Catarina. Programa de Pós-Gradu-ação em EducPós-Gradu-ação Física. Florianó-polis, SC. Brasil.
Received: 09 October 2012 Accepted: 13 April 2013
Hypertension and its association with
overweight and obesity among
adolescents: a school-based survey
Prevalência de hipertensão arterial e sua associação com
sobrepeso e obesidade: estudo de base escolar
Rafael Vieira Martins1,2
Wagner de Campos1,2
Rodrigo Bozza1,2
Valter Cordeiro Barbosa Filho3
Michael Pereira da Silva1,2
Abstract– his study aimed to investigate the association of overweight and obesity with hypertension in adolescents from public schools in Curitiba, southern Brazil. he sample comprised 1,549 randomly selected adolescents aged 12 to 18 years (744 males). Body mass index (BMI) was calculated and classiied according to Conde and Monteiro (2006). Blood pressure was measured by the auscultation method on two occasions (diferent days) and was classiied according to the fourth report of the National High Blood Pressure Education Program (NHBPEP). Prevalence ratio was used as a measure of association. Overweight and obesity were observed in 23% and 5.8% of boys, respectively. Among girls, 18.8% were overweight and 5.6% were obese. Ater two measurements, 7% of boys had prehypertension and 10.5% had hypertension. Prehypertension and hypertension were observed in 5.2% and 9.9% of girls, respectively. Obesity was signiicantly associated with high blood pressure among boys (PR = 1.19, 95% CI = 1.07-1.32). Overweight (PR = 1.11, 95% CI = 1.04-1.17) and obese (PR = 1.26, 95% CI = 1.13-1.40) girls were more likely to have high blood pressure levels in comparison to normal weight adolescents. hese results showed alarming estimates of hypertension among young people and that the reduction of obesity during adolescence should be focused on public policies for hypertension prevention in the population.
Key words: Adolescent; Hypertension; Obesity; Overweight.
Overweight, obesity and hypertension in adolescents Martins et al.
INTRODUCTION
Hypertension is characterized by high and sustained levels of blood pres-sure on artery walls and is associated with several functional and metabolic changes, resulting in a high risk for cardiovascular diseases1.
he high estimates of hypertension in the adult population of several countries have led it to become one of the main public health problems in the world2. Additionally, nearly 13% of all deaths occurring each year (7.5
million of deaths) may be attributed to high blood pressure2. However,
increasingly more alarming levels of hypertension are also found in the initial years of life3. Since high blood pressure values in childhood and
ad-olescence are closely related to hypertension in adulthood4, the prevention
of this condition during adolescence should be a priority.
he literature presents some risk factors that may cause changes in blood pressure among young people, such as: excessive intake of foods with high caloric and salt content, sedentary lifestyle, family history, smoking, and drinking5. However, a factor that has been receiving special attention
is the presence of overweight or obesity in childhood and adolescence. hese conditions are directly related to changes in the current morbidity and mortality proile, especially with the onset of cardiovascular problems (type-2 diabetes, dyslipidemias and hypertension itself) already in the initial years of life2,6
. Although with little scientiic evidence, the
pathophys-iological aspects of hypertension show that high blood pressure is linked to body weight gain, because excess fat helps to increase sympathetic ner-vous activity, which, in turn, increases renin-angiotensin system activity. Moreover, insulin resistance may cause increased blood pressure, since insulin contributes to circulation through vasodilatation, a phenomenon that shows to be deicitary in obese individuals7.
Despite the indications that overweight and obesity are associated with hypertension in the young population, these pieces of evidence are primar-ily obtained from epidemiological surveys with important methodological limitations in the classiication and in the way of measuring blood pressure8,
because it is frequent to ind in the literature studies measuring blood pressure on a single visit, as well as diferent measuring methods and sev-eral cut-of points for classiication. However, surveys with representative samples of a young population and that adopted a methodology to control these limitations related to blood pressure measurement are still scarce. herefore, the present study aimed to investigate the prevalence of hyper-tension and its association with overweight and obesity in a representative sample of adolescents from public schools in Curitiba, southern Brazil.
METHODOLOGY
Population and sample
primary school classes and 106 to high school classes.
Sample size was calculated according to the criteria described by Luiz and Magnanini9: a) population of 115,524 adolescents; b) 95% conidence
interval; c) sampling error of 2% and prevalence of 7.4%10
. hese parameters
indicated a minimum sample size of 654 adolescents. Since the sample was obtained by multiple stages, we chose to consider a design efect of 1.5, which resulted in a sample of 982 adolescents. A further 30% of individuals were added to this estimate in order to minimize possible losses related to those who refused to participate in the study, did not provide a free and informed consent signed by parents or guardians up to the day of data collection, or were excluded due to the presence of one of the exclusion criteria. Hence, the total sample size comprised 1,276 adolescents.
At the second stage, 5 schools were drawn in each of the 9 regions, one school for each grade (6th, 7th and 8th grades of primary school, and 1st
and 2nd grades of high school), from morning and aternoon shits. At the
third stage, 1 to 3 classes (clusters) were randomly selected, considering the number of adolescents per administrative region of the city. All students from these classes were invited to participate in the study.
his process of sample selection yielded a sample of 1,812 adolescents. he following exclusion criteria were considered for the present study: i) age below 12 years and above 18 years; ii) regular use of anti-hypertensive drugs, or pregnancy; iii) missing one or both blood pressure measurements. herefore, the inal sample comprised 1,549 adolescents, 744 males and 805 females, aged between 12 and 17.9 years and enrolled in 44 schools in Curitiba.
he present study was registered and approved by the Research Ethics Committee of the Department of Health Sciences at Universidade Federal do Paraná under the number 624.161.08.09. he participation of the ad-olescents was authorized by parents/guardians, who signed the free and informed consent.
Anthropometric measures
Height and body mass were measured according to standardized proce-dures11. Body mass index (BMI) was calculated by dividing body mass by
height squared (Kg/m²). BMI was classiied (underweight, normal weight, overweight and obesity) according to speciic cut-of points for gender and age, proposed by Conde and Monteiro for Brazilian adolescents12. For
anal-ysis purposes, adolescents classiied as underweight were grouped together with normal weight adolescents.
Blood pressure
Systolic and diastolic blood pressures were measured by the auscultation method and classiied according to the guidelines established by the 4th
Overweight, obesity and hypertension in adolescents Martins et al.
Measurements were taken from the right arm of the adolescents, using an aneroid sphygmomanometer positioned at the heart level of the subjects, and a stethoscope placed above the brachial artery. Systolic blood pressure was deined as Korotkof sound phase 1 (K1), and diastolic blood pressure as Korotkof sound phase 5 (K5).
Blood pressure was classiied considering NHBPEP standards13. his
classiication was performed according to age, gender, and height per-centile13. he classiication of the height-for-age percentile considered the
curves proposed by the Center for Diseases Control and Prevention14.
Before the inal classiication of adolescents regarding hypertension, a second visit was made to reassess individuals who showed high blood pressure values. his new measurement (conducted on the day following the irst measurement) was important for the pressure characterization of these subjects, because high pressure tends to decrease due to the reduced anxiety degrees resulting from a new visit. In addition, all measurements were taken by a single evaluator, in order to eliminate any type of inter-rater error.
Statistical analysis
Descriptive statistics, with mean and standard deviation, was used to characterize the sample and present the data. he Komolgorov-Smirnov test was used to test data normality. he Student’s t test was applied to compare descriptive variables between the genders. Simple and relative frequency analysis was used to present the prevalences of overweight and obesity and the prevalences of hypertension. In order to examine the association of overweight and obesity with hypertension, prevalence ratio was used, determined through Poisson regression with robust variance. For the association analyses, prehypertensive and hyperten-sive individuals were grouped into a single category (adolescents with hypertension).
he Statistical Package for the Social Science (SPSS) sotware, version
18.0, was used for all analyses, and the level of signiicance was set up at p<0.05.
RESULTS
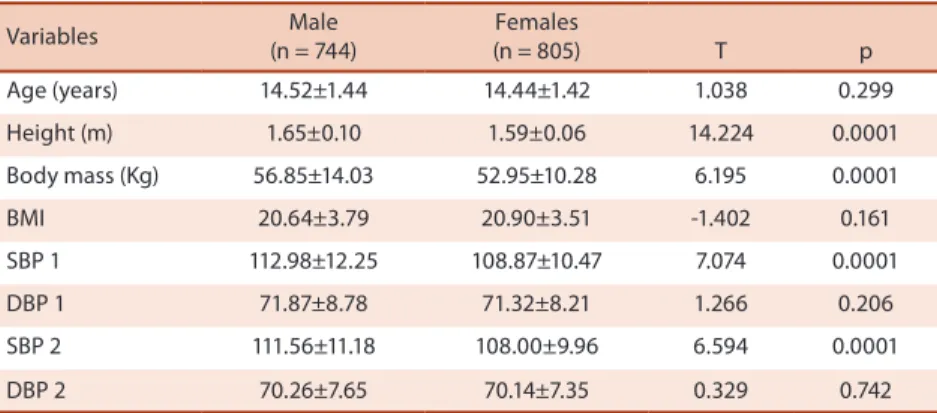
Table 1 shows means and standard deviations for anthropometric variables, as well as mean and standard deviation for blood pressure at the irst and second measurements, according to gender. Mean values for height, body mass, SBP 1 and SBP 2 were signiicantly higher in male adolescents in comparison to their female counterparts.
(n = 744) (n = 805) T p
Age (years) 14.52±1.44 14.44±1.42 1.038 0.299
Height (m) 1.65±0.10 1.59±0.06 14.224 0.0001
Body mass (Kg) 56.85±14.03 52.95±10.28 6.195 0.0001
BMI 20.64±3.79 20.90±3.51 -1.402 0.161
SBP 1 112.98±12.25 108.87±10.47 7.074 0.0001
DBP 1 71.87±8.78 71.32±8.21 1.266 0.206
SBP 2 111.56±11.18 108.00±9.96 6.594 0.0001
DBP 2 70.26±7.65 70.14±7.35 0.329 0.742
BMI: Body mass index; SBP 1: Systolic blood pressure at the irst visit;
DBP 1: Diastolic blood pressure at the irst visit; SBP 2: Systolic blood pressure at the second visit; DBP 2: Diastolic blood pressure at the second visit.
Table 2. Simple and relative frequency of adolescents in each body mass index classiication, Curitiba, Brazil (n= 1,549).
BMI classiication Total (n = 1,549)
Male (n = 744)
Female (n = 805)
n % n % n %
Underweight 18 1.1 1 0.1 17 2.1
Normal 1,121 72.4 529 71.1 592 73.5
Overweight 322 20.8 171 23.0 151 18.8
Obese 88 5.7 43 5.8 45 5.6
BMI: body mass index.
Table 3 shows absolute and relative frequency values for blood pres-sure classiications at the irst and second visits, respectively. he number of individuals classiied as prehypertensive and hypertensive was lower at the second visit in comparison to the irst visit, regardless of gender.
Table 3. Simple and relative frequency of adolescents in each blood pressure classiication, according to the day of visit, Curitiba, Brazil (n= 1,549).
Blood pressure clas-siication
Total (n = 1.549)
Male (n = 744)
Female (n = 805)
n % n % n %
First visit
Normal 1,063 68.7 484 65.0 579 71.9
Prehypertensive 225 14.6 119 16.0 106 13.2
Hypertensive 261 16.8 141 19.0 120 14.9
Second visit
Normal 1,297 83.7 614 82.5 683 84.9
Prehypertensive 94 6.1 52 7.0 42 5.2
Hypertensive 158 10.2 78 10.5 80 9.9
Overweight, obesity and hypertension in adolescents Martins et al.
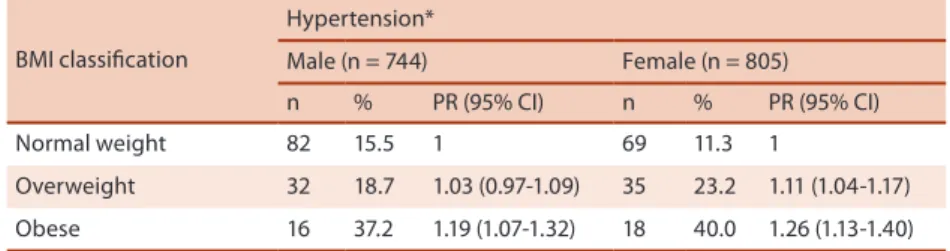
1.04-1.17) and obese (PR= 1.26, 95% CI = 1.13-1.40) girls were more likely to have high blood pressure levels in comparison to their normal weight counterparts.
Tabela 4. Prevalence of hypertension and its association with overweight and obesity in adolescents, Curitiba, Brazil (n= 1,549).
BMI classiication
Hypertension*
Male (n = 744) Female (n = 805)
n % PR (95% CI) n % PR (95% CI)
Normal weight 82 15.5 1 69 11.3 1
Overweight 32 18.7 1.03 (0.97-1.09) 35 23.2 1.11 (1.04-1.17)
Obese 16 37.2 1.19 (1.07-1.32) 18 40.0 1.26 (1.13-1.40)
*Undesirable (systolic blood pressure and/or diastolic blood pressure ≥90th); BMI = body mass index; PR (95% CI) = prevalence ratio and 95% conidence interval.
DISCUSSION
he prevalence of excess weight (overweight or obesity) found in the pres-ent study (26.5%) was close to those obtained in adolescpres-ents from other Brazilian cities, such as Cubatão, state of São Paulo (24%)15 and Fortaleza,
state of Ceará (19.5%)16. Generally speaking, these estimates show that
adolescents from diferent regions of the country are already belonging to a group at risk for developing future diseases resulting from the excessive accumulation of body fat2,16.
In comparison to international data, it becomes evident that the problem of overweight and obesity at the initial years of life is not limited to Brazilian adolescents. In the United States, for example, data for 2007 show that excess weight (overweight or obesity) were observed in 31.6% of children17. On the other hand, in a research conducted by Ottova et al.18
in diferent countries of Europe, the mean prevalence of overweight in children and adolescents was 14.2%, ranging from 9.4% (France) to 17.6% (Spain). he discrepancies between the studies may be explained by behav-ioral and cultural diferences, which imply diferences in the nutritional status of young people from diferent regions. However, methodological diferences (age group, BMI classiication criteria) may also explain these diferences.
Epidemiological data on hypertension in children and adolescents are also widely reported by the national and international literature19,20.
Nonetheless, it is frequent to ind a wide variation in the prevalence of hy-pertension in this population, and these diferences may be directly related to the methodology used in the studies8. Because of that, in the present
research two visits were made for measuring blood pressure, following internationally accepted recommendations13, and most studies use two or
more measurements on the same day.
An investigation conducted by Queiroz et al.19 found a prevalence of
in 18.6% of the adolescents investigated. However, the comparison of the above-mentioned studies with the present research should be made with caution, since these blood pressure measurements were taken on the same day, diferently from the measurements obtained in the present study.
International data on hypertension in children and adolescents show that prevalence rates ranged from 4.2% to 16.3%8,22,23
. Considering the
above-mentioned prevalences of hypertension, it should be taken into ac-count that, in the present research, the irst blood pressure measurement showed higher values. A decrease in prevalence rates was observed in the second measurement, probably due to the reduction in anxiety and the familiarization with the procedures13. Nonetheless, it becomes evident that
blood pressure screening and control should be made already in the irst years of life, because even the child and/or adolescent classiied as prehy-pertensive already belongs to a risk group with potential for developing hypertension and its associated comorbidities13,24.
Several factors are associated with increased blood pressure levels in children and adolescents5,12. Among these factors, some of the most
remarkable are overweight and obesity, because excessive accumulation of body fat has been growing dramatically among this population all over the world in the last years10.
he present study identiied a signiicant association between obesity and hypertension among boys. For girls, both overweight and obesity showed to be signiicantly associated with hypertension. hus, it is observed that both overweight and obese girls were more likely to have high blood pressure in comparison to normal weight girls, a fact that, for boys, occurred only with obese subjects in comparison to overweight and normal weight boys. A possible explanation for these diferences between the genders may be linked to hormonal actions resulting from the onset of puberty, as well as to the excess gain in fat mass that occurs during this period, because girls at pubertal age have more body fat, especially at the hip area and visceral fat, while boys increase their muscle mass during this period25.
International surveys have also observed a trend of excess weight representing a risk condition for cardiovascular health, including the pres-ence of hypertension in children and adolescents. For instance, in a study conducted by Salvadori et al.20 in Canada, obesity in children aged 6-13
years was associated with prehypertension and hypertension.
he pathophysiological mechanisms through which hypertension resulting from excess body weight develops have been little explored yet. Some authors suggest that hyperinsulinemia and insulin resistance may be factors involved in the genesis of obesity, which, in turn, is associated with increased blood pressure7. In obese individuals, the maintenance
Overweight, obesity and hypertension in adolescents Martins et al.
occurs in the kidneys and, consequently, the heart works harder, due to the increase in cardiac output7.
Moreover, insulin is a hormone that helps in vasodilatation, contribut-ing to the increase in blood low to skeletal muscles; however, this physiolog-ic mechanism does not function normally in obese individuals26. Another
factor linked to increased blood pressure values is the higher release of free fatty acids into the portal vein; this physiological dysfunction is found in individuals with high body fat levels, especially in the abdominal area27.
It is important to highlight some possible methodological limitations of the present study. he present research used BMI to classify nutritional status. Although BMI is a reliable variable used in several studies, the use of indicators of fat distribution in diferent areas of body (such as abdomi-nal or subcutaneous) could have been a factor that would help to provide an answer about the association of overweight and obesity with increased blood pressure. Previous studies have reported this association28,29. Another
possible limitation refers to the lack of assessment of maturational stage, because the age range analyzed in the present study comprises a period during which physiological changes, resulting from the onset of puberty, become more evident, contributing thus to the increase in body fat, espe-cially in girls, a fact that may collaborate to increase blood pressure levels25.
Still regarding possible limitations, the levels of physical activity and physical itness of the sample were not analyzed. hese variables could have inluenced the results for blood pressure, since overweight and obesity are closely related to low levels of physical activity and physical itness in children and adolescents11.
However, one of the strengths of the present study was measuring blood pressure on diferent days. his methodological approach was diferent from those adopted in most national and international investigations8
. his
approach is recommended by the NHBPEP13, which advocates the use of
more than one measurement for the diagnosis of hypertension in order to avoid overestimating its prevalence in the young population. Another strength of the present study was the estimation of hypertension prevalence in a representative sample of adolescents from public schools in Curitiba. Several studies in the national and international literature did not work with representative samples of their respective populations, which may imply erroneous estimates of hypertension prevalence and its associated factors.
CONCLUSIONS
he present study found that obese adolescents, regardless of gender, were more likely to have hypertension (prehypertension or hypertension) already during adolescence. In addition, overweight girls were also more likely to have hypertension, in comparison with their normal weight counterparts.
present in this population. Future investigations should take into account the blood pressure measurement on more than one occasion, because the results showed that, in many cases, blood pressure decreases on the second measurement. his evidence was also observed in the present study. hus, the use of several measurements on the same day may lead to diagnostic errors in the estimated rates of hypertension among young people.
REFERENCES
1. Sociedade Brasileira de Hipertensão, Sociedade Brasileira de Cardiologia, Socie-dade Brasileira de Nefrologia. 6ª Diretrizes Brasileiras de Hipertensão Arterial 2010;17(1):4-60.
2. World Health Organization. Global health risks: mortality and burden of disease attributable to selected major risks. Geneva; 2009.
3. Molina MCB, Faria CP, Montero MP, Cade NV, Mill JG. Fatores de risco cardio-vascular em crianças de 7 a 10 anos de área urbana, Vitória, Espírito Santo, Brasil. Cad Saúde Pública 2010;26(5):909-17.
4. Chen X, Wang Y. Tracking of blood pressure from childhood to adulthood : a systematic review and meta-regression analysis. Circulation 2008;117(25):3171-80.
5. Araújo TL, Lopes MVO, Moreira RP, Cavalcante TF, Guedes NG, Silva VM. Pressão arterial de crianças e adolescentes de uma escola pública de Fortaleza – Ceará. Acta Paul Enferm 2007;20(4):476-82.
6. Redwine KM, Daniels SR. Prehypertension in adolescents: Risk and progression. J Clin Hypertens 2012;14(6):360-364.
7. Aneja A, El-Atat F, Mcfarlane SI, Sowers AR. Hypertension and obesity. Recent Progress in Hormone Research 2004;59:169-205.
8. Christofaro DGD, Andrade SM, Fernandes RA, Cabrera MAS, Ritti-Dias RM. Prevalência de pressão arterial elevada em crianças e adolescentes: revisão sis-temática. Rev Bras Saude Mater Infant 2011;11(4):361-7.
9. Luiz RR, Magnanini MMF. A lógica da determinação do tamanho da amostra em investigações epidemiológicas. Cad Saúde Colet 2000;8(2):9-28.
10. Silva KS, Farias Júnior JC. Fatores de risco associados à pressão arterial elevada em adolescentes. Rev Bras Med Esporte 2007;13(4):237-40.
11. Alvarez BR, Pavan AL. Alturas e comprimentos. In: Petroski EL. Antropometria: Técnicas e Padronizações. Porto Alegre: Palotti; 2009. p. 9-29
12. Conde WL, Monteiro CA. Valores críticos do índice de massa corporal para clas-siicação do estado nutricional de crianças e adolescentes brasileiros. J Pediatr (Rio J) 2006;82(4):266-72.
13. National high blood pressure education program working group on high blood pressure in children and adolescents. he Fourth Report on the Diagnosis, Evalua-tion, and Treatment of High Blood Pressure in Children and Adolescents. Pediatrics 2004;114(2):555-76.
14. Kuczmarski RJ. Ogden CL, Grummer-Strawn LM, Flegal KM, Guo SS, Wei R. et al. CDC growth charts: United States. Adv data 2000;314:1-28.
15. Silva MCP, Ramos CHB, Costa RF. Estado nutricional e níveis pressóricos de escolares adolescentes da cidade de Cubatão – SP, Brasil. Rev Bras Crescimento Desenvolv Hum 2008;18(3):288-97.
16. Campos LA, Leite AJM, Almeida PC. Prevalência de sobrepeso e obesidade em adolescentes escolares do município de Fortaleza, Brasil. Rev Bras Saúde Mater Infant 2007;7(2);183-90.
Overweight, obesity and hypertension in adolescents Martins et al.
Corresponding author
Rafael Vieira Martins
Centro de Pesquisa em Exercício e Esporte. Departamento de Educação Física da UFPR. Jardim Botânico. Rua Coração de Maria, 92.
CEP: 80215-370 - Curitiba, PR, Brasil. Email: [email protected]
18. Ottova V. Erhart M, Rajmil L, Dettenborn-Betz L, Ravens-Sieberer U. Overweight and its impact on the health-related quality of life in children and adolescents: results from the European KIDSCREEN survey. Qual Life Res 2011;20(4):59-69.
19. Queiroz VM, Moreira PVL, Vasconcelos THC, Vianna RPT. Prevalência e preditores antropométricos de pressão arterial elevada em escolares de João Pessoa – PB. Arq Bras Cardiol 2010;95(5):629-34.
20. Salvadori M. Sontrop JM, Garg AX, Truong J, Suri RS, Mahmud FH et al. Elevated blood pressure in relation to overweight and obesity among children in a rural Canadian community. Pediatrics 2008;122(4):820-8.
21. Romanzini M, Reichert FF, Lopes AS, Petroski EL, Farias Júnior JC. Prevalên-cia de fatores de risco cardiovascular em adolescentes. Cad Saúde Pública 2008;24(11):2573-81.
22. Pileggi C, Carbone V, Nobile CGA, Pavia M. Blood pressure and related cardio-vascular disease risk factors in 6–18 year-old students in Italy. J Paediatr Child Health 2005;41(7):347-52.
23. Genovesi S. Giussani M, Pieruzzi F, Vigorita F, Arcovio C, Cavuto S et al. Results of blood pressure screening in a population of school-aged children in the province of Milan: role of overweight. J Hypertens 2005;23(3):493-7.
24. Campana EM, Brandão AA, Magalhães, ME, Freitas EV, Pozzan R, Brandão AP. Pré-hipertensão em crianças e adolescentes. Rev Bras Hipertens 2009;16(2):92-102.
25. Malina RM, Bouchard C, O Bar-Or Growth, maturation and physical activity. Champaign: Human Kinetics; 2004.
26. Barreto-Filho JAS, Colombo FMC, Lopes HF. Hipertensão arterial e obesidade: causa secundária ou sinais independentes da síndrome plurimetabólica? Rev Bras Hipertens 2002;9(2):174-84.
27. Oliveira AMA, Oliveira AC, Almeida MS, Almeida FS, Ferreira JBC, Silva CEP et al. Fatores ambientais e antropométricos associados à hipertensão arterial infantil. Arq Bras de Endoc Metab 2004;48(6):849-54.
28. Hirschler V, Aranda C, Calcagno ML, Maccalini G, Jadzinsky M. Can waist cir-cumference identify children with the metabolic syndrome? Arch Pediatr Adolesc Med 2005;159:740-4.