VALORIZATION OF URBAN HERITAGE: MODELING UAV 3D DATA FOR
MOBILE PLATFORMS
Luís Filipe Marques
Researcher at Centre de Política de Sòl i Valoracions (CPSV), Universitat Politècnica de Catalunya, Spain | Centro Interdisciplinar de Ciências Sociais CICS.NOVA - Faculdade de Ciências Sociais e Humanas - Universidade NOVA de Lisboa (CICS.NOVA.FCSH/UNL), Portugal
Avenida de Berna, 26 C, Lisboa, 1069-061, Portugal [email protected]
+351 964577071
José António Tenedório
Professor at Faculdade de Ciências Sociais e Humanas, Universidade NOVA de Lisboa | Centro Interdisciplinar de Ciências Sociais CICS. NOVA - Faculdade de Ciências Sociais e Humanas - Universidade NOVA de Lisboa (CICS.NOVA.FCSH/UNL), Portugal
Postal Adress: Avenida de Berna, 26 C, Lisboa, 1069-061, Portugal [email protected]
+351 966110536
Malcolm C. Burns
European Projects Office, Universitat Politècnica de Catalunya
Edifici h (etseib), Planta 5, Av. Diagonal, 649, Barcelona, 08028, Spain [email protected]
+34 934011642 (ES)
João Marques
Geodrone
Postal Adress: Rua Palmira Bastos, n7, Almada, 2810-268, Portugal [email protected]
+351 912616502 (PT)
Key words: Heritage, 3D Modeling, UAV, Mobile Platforms
Abstract
elements of a city. The selected architectural elements are those related with the water supply system in Lisbon built from XVIII to the XIX century.
The inclusion of these elements in a mobile platform requires 3D modelling, improving the visualization and alphanumeric information access (e.g. historical) very useful to the agents (in particular to the city visitors). 3D models were created based on terrestrial and UAV surveys, considering rapid and authentic data acquisition. The stages of building the models were: i) Data acquisition (UAV - flight planning and image acquisition); ii) Data processing; iii) Data visualization (App/AR). The created models are very realistic. However, the results may differ when processing the data in different software, especially concerning the level of detail. The technical challenge is to simplify the models to use in mobile platforms and maintain the level of realism. The Communication will present a case study of 3D modelling with UAV data and their representation in an Augmented Reality environment through mobile platforms.
Introduction
The comprehension of an individual’s mental images of the urban systems and their elements
(which may change if the circumstances of observation are different); the level of those images and their quality; and the development and inter-relations, all contribute to build a wider satisfactory physical environment for everyone. Modelling, or remodelling, should be accompanied by a definition of a “Visual Plan” for the city or metropolitan area: embracing a set
of recommendations and controls that would be concerned with the visual scale in urban form, illustrating the relevant public images, basic visual problems, opportunities, critical elements of the images, interrelationships of elements with their detailed qualities and possibilities for transformation (Lynch, 1960). According to Golledge (1997) if we are aware of people’s
preferences, perceptions and attitudes, better matches can be made between planning and
policy making, addressing the population’s needs (for whom plans are made). Knowing something about people’s perceptions, preferences and images, provides fundamental information that complements planners’ and managers’ intuition guidelines and legal restrictions
(Gärling and Golledge in Golledge, 1997).
The effectiveness of external representation is influenced by how it supports cognitive perceptions (Hahn and Kim, 1999 in Khatri et al., 2006). Perceptions capture an extensive range of sensory variation having a huge epistemological importance, being at the very source of all human empirical knowledge. From a cognitive point of view, the structure of geographic information and cartography can provide auspicious premises to approach how humans perceive, represent and interact with their spatial environment, regarding the valuable evidence to the properties of the underlying mental structures and processes for spatial cognition (Berendt et al., 1998).
Zhang (1997, 2001) in Khatri et al., (2006) argues that “Most work in cognition assumes that the mind has mental representations analogous to computer data structures”. As in cognitive
geometry and position. Computers allow us to conduct reproducible experiments, introduce or modify variables and change conditions in a way that is not possible in the physical world itself. Technological advances, especially regarding the ability to extend (represent) the physical world and computer modelling capabilities, have led to the creation of an increasing number of models of objects and environments (Koller et al., 2009). The use of Digital Representations (DR) in research offers a number of advantages, especially the ability to create detailed models of possible pasts and futures. By modelling a number of different variables, we can test and change them to explore different hypothetical situations. This is, of course, impossible in the real world, as circumstances on site are unpredictable and constantly changing (Eve, 2012).
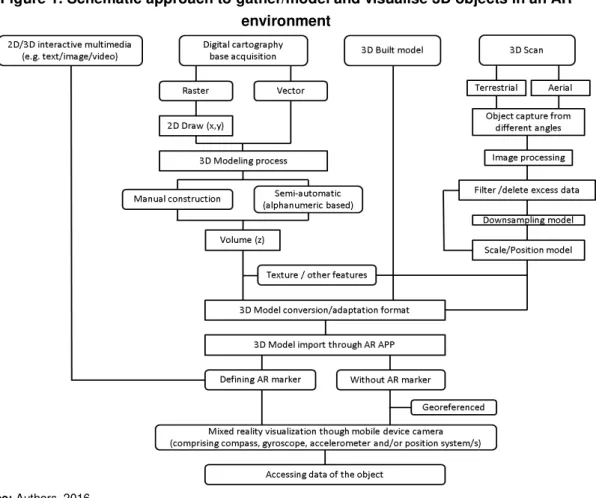
Schematic approach to model, represent and visualise 3D objects in an
AR environment
Figure 1. Schematic approach to gather/model and visualise 3D objects in an AR environment
Source: Authors. 2016
Considering the fluxes of data, based on digital cartography, in the case of the 2D vector, the
volume associated with alphanumerical “z” values can been created (in the case of a building
having, for example, the number of floors, the user can assign a medium height and multiply to
calculate an estimation of the building’s volume), while on raster documents (e.g. satellite
be associated with real coordinates (a georeferenced 3D model) and eventually enable the possibility to access more information about the object.
The experiments permit verifying the potential of this technology as parts of an ongoing mobile application development. It is intended to integrate the most adequate solutions for the mobile application and therefore understand the potential of these technologies when applied for heritage valuation. It is planned to direct specific interviews and/or inquiries to validate these assumptions not only to common users but also specialised technicians, opinion/decision makers, promoters and other stakeholders.
3D data acquisition and modelling
The most prominent manifestation of humans’ pattern recognition capabilities concerns
visualisation, revolutionising our behaviour and way of communicating, travelling, organizing and even managing space (Portugali, 1996). 3D representations generate more intuitive methods of interaction between the user and the represented data. 3D environments can increase the engagement of the user, making it much easier to understand, interact and participate by visualizing interactively, for example, volumes, textures, shadows, sights and their relation. This principally occurs because of its high level of similarity to reality, congregating detailed information (Level of Detail - LoD) and volume property, stimulating more enthusiasm and simplifying creative solutions for detected problems after a walk-drive-fly-through re-presentation (embodying the user in that environment or presence), improving comprehension and communication (adapted from Geertman, 2002; Crampton, 2001; Neves and Camara, 1999; Jacobson, 1992 in Zhang, 2004). Thus, 3D representations and analysis tools are more adequate for volume variation and enrich the spatial representations (Zhang, 2004).
The technical-scientific advances of measuring the physical world and computer modelling capabilities, have led to the creation of an increasing number of high quality 3D models of existing cultural heritage objects and environments. These are often supplemented by additional metadata information, as well as synthetic reconstructions of missing data. Heritage representations depend on efficient access, interoperability and scientific endorsement of the 3D models.
Progress in geographic information acquisition and development (hardware and software), allows innovative perspectives for territorial management using third dimension, enabling advanced possibilities of visualisation and analysis in virtual, immersive, or mixed environments (Valencia et al., 2015). The association of 3D modelling and cultural heritage has been growing in interest, partly due to the broader use of LiDAR (laser scanning) and photogrammetry. These technologies allow to record objects remotely, efficiently and accurately, often difficult to perform with previous survey methods (Dore et al., 2012).
systems (e.g. GPS, GLONASS, BeiDou for navigation, point cloud coordinates and possibly geopositioning) constitutes some of the main characteristics for the success of this technology (Nex and Remondino, 2014).
3D point cloud data automatically generates 3D models, including: Digital Terrain Models (DTM - plain terrain), Digital Surface Models (DSM - including the elevations of objects above the ground), and 3D models (from isolated or collective objects). 3D point clouds are mostly generated directly from a laser scan or through stereo image matching, processing imagery algorithms by overlapping (terrestrial or airborne). This means that it is possible to acquire relevant urban parameters at low-cost, from 3D point cloud data acquisition to the extraction of parameters (Tenedório et al., 2014).
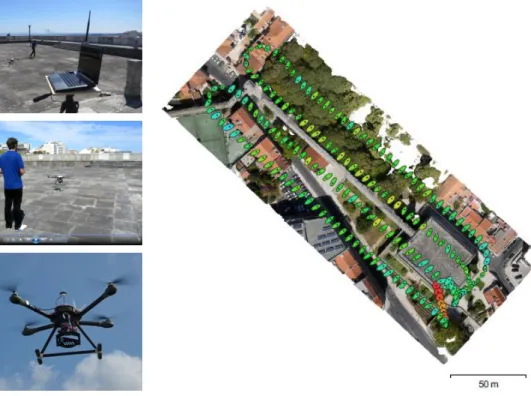
UAV 3D data acquisition
To conduct the UAV survey, the following steps in data acquisition were taken: Flight plan parameters (height, overlapping, time, focal distance, camera data, spatial resolution) and collecting data survey (concerning planning aspects such as safety, interferences and calibration).
The UAV survey was conducted in September of 2015 at a height of 50.3 meters and gathered 198 images with the following parameters:
- Resolution of 5456 x 3632 pixels; - Focal length of 16 mm;
- Pixel size: 4.4 x 4.4 um;
- Overlapping: 75% and 65% (lateral).
Based in the information collected through UAV was conducted several experiments using different advanced processing software for to develop the 3D models of the Lisbon aqueduct structures. The workflow processes and results are quite dissimilar regarding Agisoft Photoscan and Bentley.
Figure 2 UAV data acquisition in Mãe de Água reservoir (Lisbon Aqueduct Structure): Setting the UAV flight plan (left) and camera locations (right).
Source: images from the authors. 11-09-2015.
Procedure workflow:
A) Loading photos; inspecting loaded images and removing unnecessary images; B) Aligning photos;
C) Building dense point cloud;
D) Building mesh; 3D polygonal model; E) Texturing the 3D model;
F) Calculating DEM and DTM; G) Ortho image;
H) Export results. Area: 298.000m x 309.000m Dots: 105 million dots
Average density: 1747,104 point/m2 Size: 2,6GB
ii) Bentley ContextCapture Procedure workflow:
A) Loading photos (georeferenced); B) Aerotriagulation;
C) Building mesh (47 tiles);
Area: 298.000m x 309.000m Dots: 680 million dots
Average density: 13829,761 point/m2 Size: 18,5GB
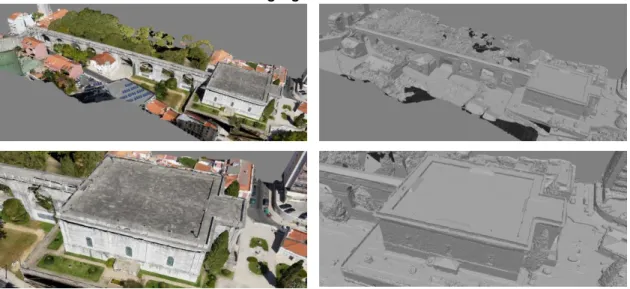
Considering the same base information the workflow is more extend in the Agisoft than in Bentley and for the same area and data (number / quality of images), the Bentley creates a tiling mesh superior in density and overall number of point cloud, however the size is also higher. The results can be visualised in the figures 3 and 4 with approximately the same angle permit to verify that they are quite dissimilar, especially when observed in detail and without texture.
Figure 3. 3D modelling form the Mãe de Água (Lisbon Aqueduct System) and detailed area results using Agisoft Photoscan software
Source: images from the authors. 12-03-2016
Figure 4. 3D modelling form the Mãe de Água (Lisbon Aqueduct System) and detailed area results using Bentley software
When placed side by side and compared both models produced, there are substantial differences visible (figures 3 and 4) especially in the detailed area without texture (bottom down, right images). However, the size of the model produced and structure (tiled) can constitute a difficulty to represent in an Augmented Reality (AR) environment, especially when using mobile devices.
3D modelling and visualisation in an Augmented Reality environment
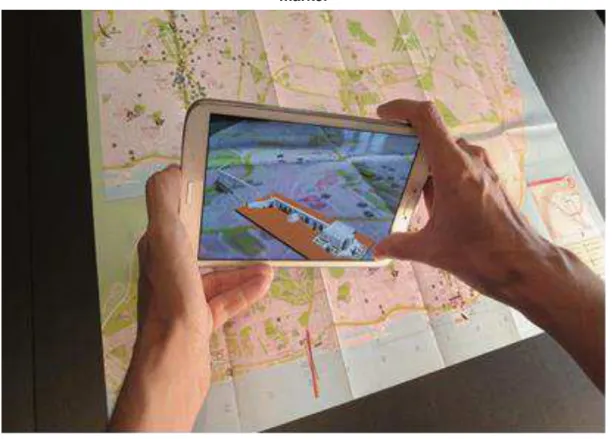
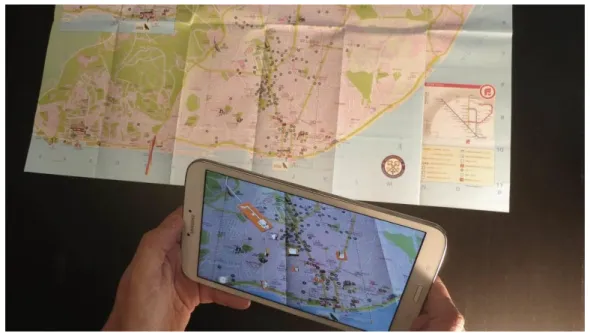
The visualisation of 3D models in an AR environment can be achieved by recognising features of an image such as a city map which is free and available. The existence of this structure in the city is not obvious, especially because it is not visible (mostly underground) and the main objective was to visualise the structure and 3D models of their elements using a mobile device and AR environment, enabling the possibility to access more information about the object. This procedure is carried out with the digitalisation of the city map and the definition of samples of image targets, which will then be detected by the AR software development kit allowing for the 3D objects rendering on top of it, by the recognition of key elements in the image target.Figure 5. Mãe de Água reservoir 3D model and AR environments using the city map as a marker
Figure 6. 3D models (terrestrial and using UAV) from the main structural elements of the Lisbon Águas Livres Aqueduct
Source: images from the authors. 17-10-2015.
This way, users are able to simply open the application (App), point the camera at the paper city map and visualise the 3D models that represent the different elements of the aqueduct system (e.g. main aqueduct, reservoirs and fountains) and access additional multimedia information related with each one of these elements (e.g. description, photos, historic cartography), as well as manipulate the 3D model (e.g. 3D rotation, zoom).
Figure 7. Ancient cartography georeferenced with the aqueduct path
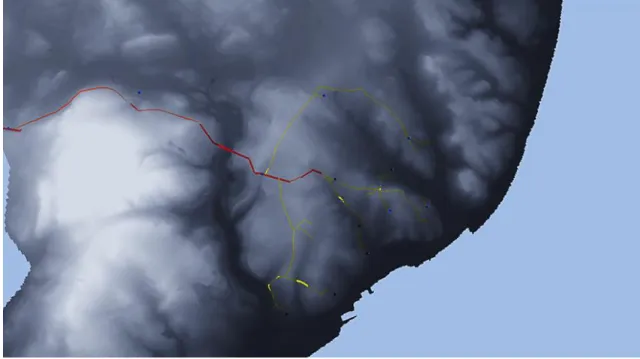
Figure 8 Detail of the 3D representation of the Lisbon Digital Terrain and the plan of the Lisbon Águas Livres Aqueduct.
Source: images from the authors. 17-10-2015.
Besides the visualisation of the 3D models of the aqueduct elements, the importance of identifying the heritage corridor and its configuration led to the use of the dataset with the representation of the entire system path, identifying sections which are both over and underground, and the ones which can be visited. This information was gathered using georeferenced ancient cartography (Figure 7). AR techniques were also used to overlay the Lisbon Digital Terrain Model (DTM) on the city map (distributed freely in paper) to evaluate the earth surface and recognise the parts which were over (+) and under (-) the ground (Figure 8).
Conclusion
The Geographic Information Technology advances are placing the world on a fast track to having knowledge of where all physical objects are located on the earth not only in present (and real) time, but also in the past or the future, especially regarding the interaction of web-based and mobile technologies (Sui and Goodchild, 2011).
elements of visible and non-visible cultural heritage, not only in the present, but also in the past and future (re-present).
The use of advanced processing software for 3D modelling available in the market may produce different results regarding the same base information. The most visible differences between the software used consist in higher level of detail, but also in size. To reproduce 3D models in and Augmented Reality environment, the model size constitutes an important advantage to the usability of the application when applied to mobile platforms. The technical challenge is to compact the information and maintain the level of quality.
These emerging representations of the physical (regarding external affordances at different moments) and even the mental world (through internal minds or imagined/simulated/synthetized) are also creating the opportunities for the development of virtual and real environments (mixing DR with the real world), not only on desktop computers,
but growing also to people’s daily using mobile devices (with the potential of being mobile and
gradual increase in use).
Uncertainty remains to understand people’s overall perceived added value attributed to cultural
heritage, through technology resources and digital representations. The interaction between the human/device/mixed environments can be applied for the majority of users. However, this interaction is dissimilar and inapplicable, presently, to all devices (regarding their characteristics) and should be available to everyone as part of the democratic access to technology and information. Nevertheless, technology is in a constant state of change and this means becoming reachable in a geometric progression. These are the main topics currently under debate within the principal scientific events, which allow for the prediction of a nearly revolutionary combination between the real and VE, especially applied to cultural heritage (Tenedório et al., 2014).
References
BERENDT, B.; BARKOWSKY, T.; FREKSA, C.; and KELTER, S. Spatial representation with
aspect maps. [online] Date of consultation: October 2012. In FRESKA C., HABEL C. and
WENDER K. F. eds. Spatial Cognition and Interdisciplinary Approach to Representing and Processing Spatial Knowledge. Berlin: Springer, 1998. pp. 313-336. Available at: <http://linkinghub.elsevier.com/retrieve/pii/S0169204608002326> ISSN: 01692046.
DORE, C. and MURPHY M. Integration of HBIM and 3D GIS for Digital Heritage Modelling
[online] Date of consultation: October 2015. In: Virtual Systems and Multimedia (VSMM), 2012 18th International Conference On Edinburg, Scotland, 2012. pp. 22-23. Available at: <http://ieeexplore.ieee.org/xpls/abs_all.jsp?arnumber=6365947>.
EVE, S. Augmenting Phenomenology: Using Augmented Reality to Aid Archaeological
Phenomenology in the Landscape. [online] Date of consultation: October 2015. In: Journal of
Archaeological Method and Theory. 19, no.4. 6, July, 2012. pp. 582–600. Available at: <http://www.springerlink.com/index/10.1007/s10816-012-9142-7> doi:10.1007/s10816-012-9142-7.
KHATRI, V.; RAM S. and SNODGRASS R.T. On Augmenting Database Design-support Environments to Capture the Geo-spatio-temporal Data Semantics. [online] Date of consultation: January 2012. In: Information Systems. N.31, (2) 2006. pp. 98–13. Available at: <http://www.sciencedirect.com/science/article/pii/S0306437904000961>.
KOLLER, D.; FRISCHER B.; HUMPHREYS G. Research Challenges for Digital Archives of 3D
Cultural Heritage Models. [online] Date of consultation: January 2012. In: Journal on Computing
and Cultural Heritage. 2 (3) (December 1), 2009. pp. 1–17. Available at: <http://portal.acm.org/citation.cfm?doid=1658346.1658347> doi:10.1145/1658346.1658347.
LYNCH, K. The Image of the City. MIT Press. 1960. 205 p.
MARQUES, L.; TENEDÓRIO, J. A., BURNS, M. C., ROMÃO, T.; BIRRA, F.; MARQUES, J.; PIRES, A. 2013. Cultural Heritage 3d Modelling and Visualisation Within an Augmented Reality
Environment, Based on Geographic Information Technologies and Mobile Platforms in ACE
Arquitectura, Ciudad y Entorno (Accepted to be published in 2016).
NEX, F. and REMONDINO, F. UAV for 3D Mapping Applications: A Review. [online] Date of
consultation: October 2015. In: Applied Geomatics. 6, 2013. pp. 1-15. Available at: <http://dx.doi.org/10.1007/s12518-013-0120-x>.
PORTUGALI, J. The Construction of Cognitive Maps. Dordrecht; Boston: Kluwer Academic
Publishers. 1996. 367 p.
SUI D. and GOODCHILD M. The convergence of GIS and social media: challenges for GIScience. [online] Date of consultation: July 2013. In: International Journal of Geographical Information Science. 25:11, 2011. pp. 1737-1748. Available at: <http://www.geog.ucsb.edu/~good/papers/516.pdf>.
TENEDÓRIO, J. A.; REBELO, C.; ESTANQUEIRO, R.; HENRIQUES, C.; MARQUES, L.;
GONÇALVES, J. A. Geographical Information Technologies in Urban and Spatial Planning:
Process: methods and tools. In: PINTO, N.; TENEDÓRIO, J.A.; ANTUNES, A.P.; ROCA, J.,
Eds. Technologies in Urban and Spatial Planning: Virtual Cities and Territories. Hershey/Pennsylvania, IGI Global, 2013. pp. 342. DOI: 10.4018/978-1-4666-4349-9.
VALENCIA, J.; MUÑOZ-NIETO A. and RODRÍGUEZ-GONZÁLVEZ , P. Virtual modeling for cities of the future. State-of-the art and virtual modeling for cities of the future. State-of-the art an. [online] Date of consultation: October 2015. In: ISPRS - International Archives of the
Photogrammetry, Remote Sensing and Spatial Information Sciences XL–5/W4. 18, February, 2015. pp. 179–85. Available at: <http://www.int-arch-photogramm-remote-sens-spatial-inf-sci.net/XL-5-W4/179/2015/> ISSN: 2194-9034.
ZHANG, X.Designing a Geographic Visual Information System (GVIS) to Support Participation
in Urban Planning. [online] Date of consultation: July 2015. Phd, University of Salford, UK.