*e-mail: [email protected]
Evaluation via Multivariate Techniques of Scale Factor Variability in the Rietveld
Method Applied to Quantitative Phase Analysis with X Ray Powder Diffraction
Terezinha Ferreira de Oliveiraa*, Roberto Ribeiro de Avillezb,
Eugenio Kahn Epprechtc, Joaquim Carlos Barbosa Queiroza
a
Departamento de Estatística, Universidade Federal do Pará, Campus Universitário do Guamá,
Rua Augusto Correa, 1, Guamá, 66075-110 Belém - PA, Brazil
b
Departamento de Ciências de Materiais e Metalurgia,
Pontifícia Universidade Católica do Rio de Janeiro,
Rua Marquês de São Vicente, 225, Gávea, 22453-900 Rio de Janeiro - RJ, Brazil
c
Departamento de Engenharia Industrial,
Pontifícia Universidade Católica do Rio de Janeiro, Rua Marquês de São Vicente, 225,
Gávea, 22453-900 Rio de Janeiro, RJ - Brazil
d
Departamento de Estatística, Universidade Federal do Pará,
Campus Universitário do Guamá, Rua Augusto Correa, 1, Guamá,
66075-110 Belém, PA - Brazil
Received: January 13, 2006; Revised: October 24, 2006
The present work uses multivariate statistical analysis as a form of establishing the main sources of error in the Quantitative Phase Analysis (QPA) using the Rietveld method. The quantitative determination of crystalline phases using x ray powder diffraction is a complex measurement process whose results are influenced by several factors. Ternary mixtures of Al2O3, MgO and NiO were prepared under controlled conditions and the diffractions were obtained using the Bragg-Brentano geometric arrangement. It was possible to establish four sources of critical variations: the experimental absorption and the scale factor of NiO, which is the phase with the greatest linear absorption coefficient of the ternary mixture; the instrumental characteristics represented by mechanical errors of the goniometer and sample displacement; the other two phases (Al2O3 and MgO); and the temperature and relative humidity of the air in the laboratory. The error sources excessively impair the QPA with the Rietveld method. Therefore it becomes necessary to control them during the measurement procedure.
Keywords: Quantitative Phase Analysis, Rietveld method, experiment design, multivariate statistical analysis
1. Introduction
1.1. Rietveld method and Quantitative Phase Analysis
(QPA)
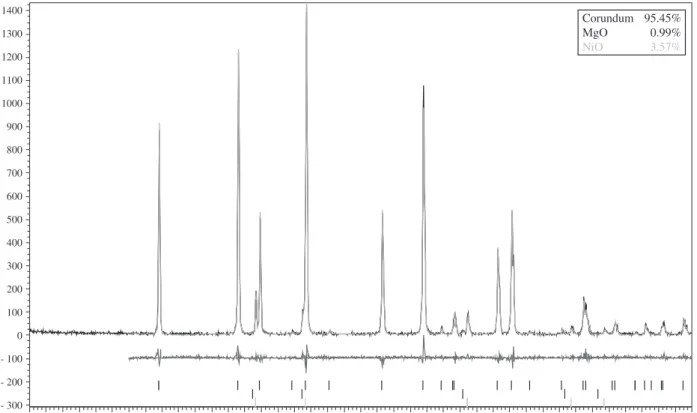
In x ray analysis, the Rietveld method of refinement is used to calculate structural parameters from observed data (Figure 1). This method employs a point-to-point adjustment of experimental intensities of the whole pattern to the calculated intensities based on the crystalline structures (spatial groups, types of atoms and site occupancy) present in the mixture1 and it also provides the weight fractions from each crystalline phase2,3.
In the Bragg-Brentano diffraction geometry, the sample and the detector rotate with a coupled θ-2θ° angular movement and thus only the crystallite planes parallel to the sample surface satisfy the Bragg’s diffraction law4. All the apertures are kept fixed and, therefore, the number of x ray photons that reach the detector (x ray intensity) is the experimental quantity measured as a function of the 2θ sample position.
This intensity is the fundamental quantity for structural refine-ments of the experimental diffraction pattern. The calculated intensity yci in the x ray powder diffraction pattern of the phase is mainly determined by the structure-factor, |Fk|2, plus corrections due to
geo-metrical effects, polarization, absorption, preferred orientation in the neighborhood of the reflection position calculated by the Bragg law, plus the background. For a single phase the intensity can be expressed by:
y
| | 2 2
y S L F2 P A
ci t Pk
k
k { ii ik k bi
=
!
^ - h + (1)where
St is the scale factor;
k is the Miller index for Bragg’s reflection; LPk represents Lorentz-polarization correction; ϕ is the profile reflection function;
Pk is the preferred orientation function; A is the absorption factor;
Fk is the structure-factor for k-th Bragg’s reflection; and ybi is the background intensity in the i-th interaction.
reflec-tion lines. This method consists in the adjustment of the experimental pattern to the whole profile, obtaining the quantitative information of phases through the scale factors, followed by the use of Equation 2 for each phase of the mixture2,3. For crystalline phase mixtures, the weight fraction of the phase t, wt, in a mixture of n phases is given by:
(2)
where Zt is the number of molecules per unit cell, Mt the molecular weight per formula unit, Vt the volume of the unit cell and St is the Rietveld scale factor.
The diffraction peak shapes can be adjusted by mathematical empirical equations or by semi-empirical descriptions of the opti-cal geometry of the diffractometer. In the empiriopti-cal adjustment, the method uses functions such as Gauss, Lorentz, Voigt, Pseudo-Voigt and Pearson VII to model the peak shape1.
The present work considers only the method of fundamental parameters proposed by Cheary and Coelho5 and available in the
TOPAS 2.1 computer program6. The adjustment through fundamen-tal parameters enables line profiles to be modelled and fitted to the observed data over the full 2θ° range in the x ray diffraction pattern for a wide range of instrumental configurations. A convolution approach is used to synthesize line profiles in terms of the CuKα emission profile, the geometry of the diffractometer and the physical variables of the specimen.
2. Multivariate Analysis
Multivariate statistical methods can be applied to several practical problems with the objective of measuring the effects of a large number of factors on a “response variable” or system output, or with the objec-tive of determining the relationships among multiple variables7.
The analysis of a group of data by multivariate methods can provide information concerning the structure of the measurement process. This approach has already been used in other measurement processes such as Nuclear Magnetic Resonance8.
This article analyzes the variability of the scale factor using mul-tivariate techniques, because it is not possible to evaluate the effects of each influencing factor without considering the interactions among the several factors in Equation 1 and, consequently, in Equation 2.
In powder analysis by x rays diffraction, multivariate methods are already being used in phase identification, for example in phar-maceutical and industrial analyses9.
In the present work, Factor Analysis was employed to identify the correlation of the refinement parameters of the TOPAS 2.1
com-puter program and the temperature and relative humidity of the air in the laboratory.
The method used in the Factor Analysis was Principal Com-ponents Analysis (PCA), with varimax rotation, with the objective of finding a rotation of the factors that simplifies their interpreta-tion7,10.
3. Materials and Method
3.1. Experimental design
In order to guarantee the traceability of the measurement system, the experimental design considered three phases with established purity (BAM-Certified Reference Material): Al2O3 (ZRM2), MgO (ZRM-RS 6M) and NiO (ZRM-RS5).
The response variables were the errors in the estimated weight fraction of each phase, wˆ
t, relative to the conventional true value, wnt, for different levels of variability between the weight fractions of the different phases11.
90 88 86 84 82 80 78 76 74 72 70 68 66 64 62 60 58 56 54 52 50 48 46 44 42 40 38 36 34 32 30 28 26 24 22 20 18 16 14 12 10 1400
1300
1200
1100
1000
900
800
700
600
500
400
300
200
100
0
- 100
- 200
- 300
Corundum 95.45%
MgO 0.99%
NiO 3.57%
In the decision about the number of samples to analyze, the costs of analyzing a sample, the availability of trained operators and the temperature and relative humidity of the air in the laboratory favorable to the analysis were taken into account.
The determination of the levels of each phase or fraction was based on the article of Madsen et al.12, who use a mixture model and an experimental design that enables analyzing the effects of phase weight fraction variation using few experiments13.
The complete cubic model for three components mixtures (w1 + w2 + w3 = 1) is given by:
w w
w b w b w w b w
i j
i j 1
1 3
1 3 3
1 3 3 3
i i
ij j
i j
i j ijk
k
j k
k
= + +
# # #
= = =
t
!
!
!
!
!
!
(3)This model expresses how the values of the variables of interest wˆ change with the values of three experimental factors that are being investigated.
The least possible number of experiments to estimate the coef-ficients of the model above is ten experiments including mixtures with two components; a modification of this special cubic model provides a total of seven experiments13.
The use of few experiments is only justified in the stage of evalu-ation of the robustness14 of the method in order to verify if its results are affected by small variations in the operation conditions15,16. When the analysis comes to this stage, the method is already optimized, so only few factors or interactions are significant. This is called sparsity effect and only in such cases an experiment can be projected with a
minimum number of observations15.
This idea was used for the creation of groups of samples. Three sample groups were created with different degrees of variation in the weight fraction of the three constituents: Group A (highest variation): 95, 4 and 1%, Group B (intermediate variation): 55, 30 and 15%, and Group C (least variation): 35, 33 and 32%. In each group, all the permutations of the levels for the phases were considered. Group D was also created with samples of only one phase, with the objective of giving support to the analyses of peak characteristics. In agree-ment with the experiagree-mental design, each phase weight fraction was obtained by individually weighing the material in a Bel Engineering Mark 210 A Model analytical balance (Capacity: 100 mg to 210 g; division: 0.0001 g; tare: 210 g; reproducibility: 0.1 mg and linear-ity: ± 0.3 mg). For each sample of the experimental design, three independent replicates of 1.0 g were prepared and mixed, adding up to a total of 63 samples.
The material was scattered over a stainless steel sample holder 2 mm deep according to the procedure by Klug and Alexander15.
4. Diffractometer Calibration
The samples were read in a Siemens D-5000 diffractometer, with a fine focus, CuKα (λ= 1.54178 Å) radiation tube with graph-ite monochromator, Bragg-Brentano geometry, scans from 22 to 90° with 2θ steps of 0.05° and acquisition time of 4 s per step. The equipment was calibrated mechanically according to the manufacturer specifications.
5. Computational Program and Refinement
Parameters
The computer program TOPAS 2.1 (Bruker AXS GmbH,
Ger-many) was used for Rietveld refinement using the fundamental parameters method. The zero error (2θ), the sample displacement, the absorption (1/cm) and the lattice parameters of the phases were allowed to vary to provide the best fitting. The March-Dolase model
in Bruker (2003) was used for preferred-orientation correction. The
background was fitted by a fifth-order Chebychev polynomial.
The results of the Rietveld adjustment, for each phase in the sample, were: the scale factor (St), the lattice parameters, the volume of the unit cell (Vt) and the weight fraction of the phase (wt).
In addition to these results, the influence quantities: temperature and relative air humidity within the radiation protection box of the goniometer were also considered as variables.
The statistical analyses were performed in the Statistical Package for Social Sciences - SPSS 10.0 for Windows17.
6. Results
The analyses of the data considered three replications of each experiment (treatment) in the groups A, B and C, adding up to 54 samples.
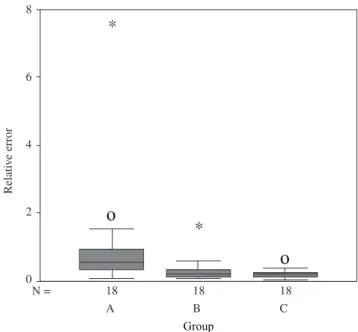
The group whose relative error presented the greatest variability was Group A (Figure 2). The relative error of each sample was ob-tained by the sum of the absolute values for each phase. Table 1 shows the statistics of the relative error per group. The Kruskall-Wallis test showed significant differences between the errors of the groups A, B and C (H = 13.144 and p = 0.001).
Table 2 shows the means and standard errors of the linear absorp-tion coefficient, of the density and of the mass absorpabsorp-tion coefficient for each phase. It is known that linear absorption coefficients play a decisive effect in the absorption18,19.
Table 3 presents the analysis of the Pearson correlation coeffi-cients between the scale factors of the three phases, St, t = 1, 2 and 3,
18 18
18 N =
Group
C B
A
Relati
v
e error
8
6
4
2
0
*
*
O
O
Figure 2. Box-plot of relative errors per group. The box length is the inter-quartile range. Outliers (values between 1.5 and 3 box lengths far from the upper or lower edge of the box) are indicated by “ο” and extremes (values more than 3 box lengths far from the upper or lower edge of the box) are indicated by “*”.
Table 1. Descriptive statistics of relative error to the QPA. Group M-Estimate (1) Median Interquartile
range σ
ˆ
A 0.535 0.554 0.605 1.698
B 0.205 0.233 0.230 0.365
C 0.173 0.198 0.184 0.170
H = 13.14 and p = 0.001
the absorption (A), the zero error of the goniometer (Zero error of 2θ), the displacement of the sample (D), the relative humidity of the air (U%) and the temperature (T).
Significant correlations can be observed in the Table 3 between the scale factors of Al2O3 and MgO, and between the scale factors of MgO and NiO, even though the correlation between Al2O3 and NiO is not significant.
The absorption, on the other hand, is significantly correlated with the scale factor of the Al2O3 and with the scale factor of the NiO (Table 2).
The zero error of 2θ has a very strong correlation with the sample displacement. This was already expected because the sample displace-ment error is corrected with a function that also alters the 2θ offset given by Klug and Alexander16 and by Cheary and Coelho5:
cos
2 180
D2 r
D i
=
i °
^ h
(4)
where D is the displacement of the sample in mm and θ is the dif-fraction angle in degrees.
The correlation between the absorption and the relative humid-ity of the air inside the radiation protection box of the goniometer is negative.
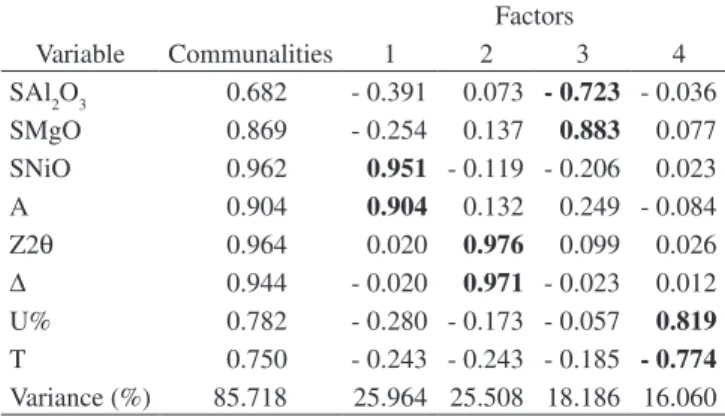
The Factor Analysis resulted in four factors (see Table 4) repre-senting 85.718% of the total variance, all with values greater than one and each factor representing a variance structureof the measure-ment process.
In the Factor Analysis, the variance of each variable can always be divided into two portions: one due to common factors and the other due to individual factors.
The variance due to the common factors is called communality7,10. The communality values in the first column of Table 4 are high, with the smallest value being equal to 68.200%, for the scale factor of Al2O3, and the largest value being equal to 96.400%, for the zero error of 2θ, which means that the Factor Analysis adequately describes the variability of the process.
Indeed, the Kaiser-Meyer-Olkin measure of adherence of the model to the data7,10 was 0.664, above 0.500, for the complete matrix,
indicating the adequacy of the model, and the Bartlett’s spheric-ity test presented a value of 718.327 for the χ2 with 28 degrees of freedom.
The factors are presented in Table 4 in the order of extraction, which coincides with the order of importance. In other words, the first factor, representing the absorption and the scale factor of NiO estimated by the Rietveld method, is the most important for the meas-urement process since it is responsible alone for 25.964% of the total variance of the measure. The second factor represents the zero error of 2θ and the sample displacement from the parafocal position. The third factor represents the two other phases and respective weight fractions. The fourth factor represents the temperature and relative humidity of the air in the laboratory.
7. Discussion
The results of the Factor Analysis allow the following inferences concerning the determined factors:
The greatest weight was given to the scale factor and the absorp-tion associated to the NiO, that jointly explain 25.964% of the total variance of the process. Greater absorption reduces the intensity of the peak in Equation 1. NiO has the greatest linear absorption among the three different phases, 276.292 ± 1.682 (1/cm) (Table 2), which is about twice the values obtained for the other phases; this probably explains its major effect on the measured errors.
7.1. Factor 2: Instrumental characteristics
The second factor was formed by the variables that represent the 2θ zero offset of the goniometer and the displacement of the sample, which jointly explain 25.508% of the variance of the measurement
Table 3. Correlation matrix of the scale factors, absorption, zero error of the goniometer, displacement of the sample, temperature and air relative humidity during sample reading in the diffractometer.
SAl
2O3 SMgO SNiO A Zero 2θ D U% T
SAl
2O3 1.000 - - -
-SMgO - 0.340 1.000 - - - -
-SNiO - 0.235 - 0.417 1.000 - - -
-A - 0.407 0.070 0.776 1.000 - -
-Zero 2θ - 0.056 0.190 - 0.118 0.168 1.000 -
-D 0.014 0.087 - 0.109 0.082 0.937 1.000
-U% - 0.022 0.013 - 0.183 - 0.331 - 0.113 - 0.083 1.000
T 0.089 - 0.249 - 0.143 - 0.214 - 0.232 - 0.160 - 0.281 1.000
Boldface values correspond to significant correlation at the level α = 5%.
Table 4. Factors obtained by PCA with varimax rotation of the refinement parameters.
Factors
Variable Communalities 1 2 3 4
SAl2O3 0.682 - 0.391 0.073 - 0.723 - 0.036
SMgO 0.869 - 0.254 0.137 0.883 0.077
SNiO 0.962 0.951 - 0.119 - 0.206 0.023
A 0.904 0.904 0.132 0.249 - 0.084
Z2θ 0.964 0.020 0.976 0.099 0.026
D 0.944 - 0.020 0.971 - 0.023 0.012
U% 0.782 - 0.280 - 0.173 - 0.057 0.819
T 0.750 - 0.243 - 0.243 - 0.185 - 0.774
Variance (%) 85.718 25.964 25.508 18.186 16.060 Table 2. Linear and mass absorption coefficients and density obtained by
Rietveld refinement.
Phase Linear absorption coefficient (1/cm)
Mass Absorption coefficient (cm2/g)
process. The 2θ zero offset is due to the misalignment of the equip-ment with the rotational axis in the circle of the goniometer. The displacement of the sample from the parafocal condition of the goniometer may be due to an incorrect positioning of the sample holder on its support or to the incorrect level of the sample inside the sample holder. If the equipment is correctly adjusted, the misalign-ment of the equipmisalign-ment and the incorrect positioning of the sample holder are associated with the intrinsic variations of the equipment mechanics and can be regarded as systematic errors. However, the displacement caused by the incorrect level of the sample is an error associated with the preparation method. Training the operators can minimize this error.
7.2. Factor 3: Other phases
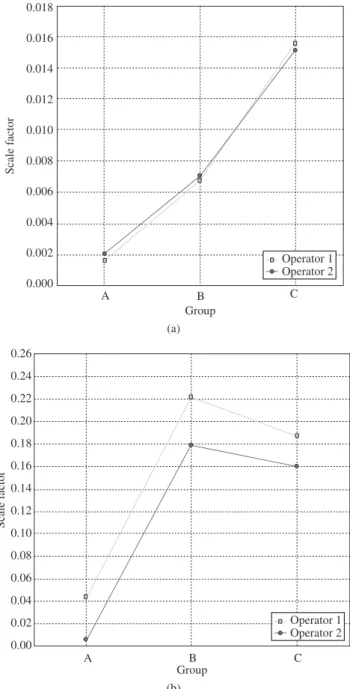
This third factor was formed by the variables related to Al2O3 and MgO (both with absorption coefficient per unit mass smaller than the one of NiO), which jointly explain about 18.186% of the total variance of the measurement process. High negative factor loadings for Al2O3 can also be observed in this factor, as can be evaluated by the graphs in Figures 3a and 3b. The negative correlation between Al2O3 and MgO may be due to other influences like the high counting statistics in the region of the (2 0 0) reflection of the MgO phase, which is strongly affected by the preferred orientation and also corresponds to the strongest reflection for MgO11.
This fourth factor was formed by the variables that represent the temperature and the humidity inside the diffractometer, which jointly explain about 16.060% of the variance of the measurement process. High negative factor loadings for the temperature can also be observed. The main effect would be the adsorption of water in the sample. Even though the x ray absorption coefficient of water is small (light elements), the adsorption of water will alter the apparent density of the sample with effect on the absorption and hence, on the scale factor. The increase of the temperature usually causes a reduction of the amount of water adsorbed, resulting in a negative correlation.
8. Conclusion
The evaluation of scale factor variability by x ray powder dif-fraction based on the Rietveld method using multivariate techniques proved effective in the identification of the occurrence of variation in the measurement process, identifying the principal critical varia-tion sources that should be considered in the QPA. The analysis has shown the importance of the linear absorption on the determination of the scale factors, which for each phase are dependent on the other phases in the mixture, and also the importance of a careful calibration of the equipment and preparation of the sample as well as the control of the environmental conditions in the laboratory.
Therefore, since the scale factors of the phases are correlated, it is necessary to use other multivariate techniques that make possible to work with orthogonal matrices20,21 e.g. Partial Least Squares (PLS), to determine how factors like absorption, instrumental characteristics and environmental conditions affect the scale factor and, as a conse-quence, the Quantitative Phase Analysis by the Rietveld Method.
Acknowledgments
The authors are grateful to the CNPq (Conselho Nacional do Desenvolvimento Científico e Tecnológico), the CAPES (Comissão de Aperfeiçoamento de Pessoal de Nível Superior) and the FAPERJ (Fundação de Apoio à Pesquisa do Estado do Rio de Janeiro) for the financial support, and to the BAM (Bundesanstalt für Materi-alforschung und -prüfung) for the material standards employed in this research.
References
1. Young R. The Rietveld Method. New York: Oxford University Press Inc.;
1995.
2. Bish L, Howard A. Quantitative Phase Analysis Using Rietveld Method.
Journal of Applied Crystallography. 1988; 21(2):86-91.
3. Cullity BD. Elements of X-ray diffraction. London: Addison-Wesley Pub. Company Inc.; 1967.
4. Hill R, Howard C. Quantitative phase analysis from neutron powder diffraction data using the Rietveld Method. Journal of Applied Crystal-lography. 1987; 20(6):467-474.
5. Cheary R, Coelho A. A fundamental parameters approach to X-Ray line-profile fitting. Journal of Applied Crystallography. 1992; 25(2):109-121. 6. Bruker AXS GmbH. Topas: General profile and structure analysis
soft-ware for powder diffraction data. Karlsruhe; 2003.
7. Hair J, Anderson R, Tathan R, Black W. Multivariate Data Analysis. 5th.
ed. New Jersey: Prentice Hall; 1998.
Figure 3. Scale factor of a) Al2O3 per groups and operators; and b) MgO per groups and operators.
0.018
0.016
0.014
0.012
0.010
0.008
0.006
0.004
0.002
0.000
Scale f
actor
A B C
Group
Operator 1 Operator 2
(a)
0.26
0.24
0.22
0.20
0.18
0.16
0.14
0.12
0.10
0.08
0.06
0.04
0.02
0.00
Scale f
actor
A B C
Group
Operator 1 Operator 2
8. Malinowski ER. Factor Analysis in Chemistry. New York: John Wiley; 1991.
9. Barr G, Dong W, Gilmore C. High-throughput powder diffraction. II. Ap-plications of clustering methods and multivariate data analysis. Journal of Applied Crystallography. 2004; 37(2):243-252.
10. Johnson R, Wichern D. Applied Multivariate Statistical Analysis. London:
Prentice-Hall; 1982.
11. Oliveira TF. Análise das incertezas na quantificação de fase pelo método de Rietveld em análise de pó por difração de raios X. [Doctoral thesis on the Internet]. Rio de Janeiro: PUC-Rio; 2005. Available from http://www. maxwell.lambda.ele.puc-rio.br
12. Madsen I, Scarlett N, Cranswick L, Lwint T. Outcomes of the Interna-tional Union of Crystallography Commission on Powder Diffraction Round Robin on Quantitative Phase Analysis: samples 1a to 1h. Journal of Applied Crystallography. 2001; 34(4):409-426.
13. Barros Neto B, Scarminio I, Bruns R. Como fazer experimentos: pesquisa e desenvolvimento na ciência e na indústria. Campinas: Editora da Uni-camp; 2001.
14. International Organization for Standardization. International Vocabulary of basic and general terms in Metrology. 2nd ed. Geneva; 2003.
15. Nijhhuis A, van der Knaap H, de Jong S, Vanderginste B. Strategy for rug-gedness tests in chromatographic method validation. Analytica Chimica Acta. 1999; 391(2):87-202.
16. Klug H, Alexander LE. X-Ray Diffraction Procedures. New York: John
Wiley; 1974.
17. Norusis M. SPSS 11.0: Guide to Data Analysis. New Jersey: Prentice
Hall; 2002.
18. Brindley G. On the Effect of Grain or Particle Size on X ray Reflections.
Philosophical Magazine. 1945; 36(1):347-369
19. Taylor J, Matulis C. Absorption Contrast Effects in the Quantitative XRD Analysis of Powder by Full Multiphase Profile Refinement. Journal of Applied Crystallography. 1991; 24(1):14-17.
20. Sena M, Collins C, Collins K, Scarmino I. Aplicação de Métodos Quimi-ométricos na Especiação de Cromo(VI) em Solução Aquosa. Química Nova. 2001; 24(3):331-338.
21. Valderra P. Avaliação de figuras de mérito em calibração multivariada na determinação de parâmetros de controle de qualidade em indústria alcooleira por espectrometria no infravermelho próximo. [Master thesis