Determination of Film Thickness Through Simulation of Vickers Hardness Testing
Maxwell Santana Libórioa, Avelino Manuel da Silva Diasa,*, Roberto Martins Souzab
Received: December 23, 2015; Revised: September 28, 2016; Accepted: March 12, 2017
In recent decades, changes in the surface properties of materials have been used to improve their tribology characteristics. However, this improvement depends on the process, treatment time and, essentially, the thickness of this surface ilm layer. Physical vapor deposition (PVD) has been used to increase the surface hardness of metallic materials. The aim of the present study was to propose a numerical-experimental method to assess the thickness (l) of ilms deposited by PVD. To reach this objective, Vickers experimental hardness data (HV) assays were combined with numerical simulation to study the behavior of this property as a function of maximum penetration depth of the indenter (hmax) into the ilm/substrate conjugate. A strategy was developed to combine the numerical results of the H
x hmax/l curve with Vickers experimental hardness data (HV). This methodology was applied to a TiN-coated M2 tool steel conjugate. The mechanical properties of the studied materials were also determined. The thickness results calculated for this conjugate were compatible with their experimental data.
Keywords: Thin Films, Finite Element, Vickers Hardness, Thickness measurement
* e-mail: [email protected]
1 Introduction
Thin ilms are currently been used in a signiicant number of industrial applications and research, e.g., to increase surface resistance to corrosion and improve the tribological properties of mechanical components, to increase the surface strength of cutting tools, and to introduce a biocompatible layer in medical implants and electromagnetic devices.1, 2
To this end, knowledge of the mechanical properties of conjugates composed of thin ilms deposited onto metallic substrates is necessary to predict the mechanical behavior of these coated systems and their numerous applications.2 However,
in such conjugates, traditional standard tensile testing cannot be applied to obtain their mechanical properties. The instrumented indentation test has been increasingly applied to determine the mechanical properties of these ilm/substrate conjugates.3-9 This
technique can be used to characterize the mechanical properties of thin ilms, as it characterizes the material locally from only a small volume. Furthermore, sample preparation to apply indentation tests is usually simple. Two diferent procedures can be applied to characterize these conjugates. The irst consists of conducting several instrumented indentation tests.3-4, 6 The
second involves performing a few indentation tests, followed by a numerical methodology to determine these mechanical properties.7-8 The mechanical properties of the materials used
in the present study were obtained by applying the latter methodology, developed by Dias and Godoy (2010).7 I.e., these
properties were determined in the present work by combining experimental and numerical Berkovich testing.
Among the numerous mechanical properties of these conjugates, surface hardness is one of the most important, given that it reveals the resistance of the material to penetration, and has recently been linked to the useful life of the ilm, primarily in relation to its delamination.10-11 However, conjugates composed of thin ilms have limitations in the conventional use of surface hardness. Whether due to the geometry of the indenter or to the capacity of the ilm to fracture during experimental testing, the surface hardness of these conjugates depends on the thickness of the ilm and on the load used during the hardness test.5, 12
The instrumented indentation technique has also been used to determine the hardness of these conjugates composed of thin ilms deposited on metallic substrates.5 Depending upon the conjugate ilm with substrate, the efects of their mechanical properties tend to establish a critical ratio between maximum penetration depth (hmax) and ilm thickness (l), so that the substrate does not interfere in the assessment of ilm properties.13-14 On the other hand, determining ilm thickness becomes diicult due to the need for speciic instruments and costly, protracted tests, such as scanning electron microscopy (SEM) and Calowear testing, in addition to instrumented indentation testing.15-16
Accordingly, the present study used the Finite Element Method (FEM) to simulate the indentation testing in a conjugate composed of Titanium Nitride (TiN) ilm deposited by plasma processing onto a tool Steel (M2). In an initial step, by simulating the Berkovich indentation testing and using the methodology proposed by Dias and Godoy (2010), the mechanical properties of this conjugate were determined.7
Then, in a second step, the simulation of Vickers indentation was conducted to numerically assess the penetration depth
a Department of Mechanical Engineering, Federal University of Rio Grande do Norte (UFRN),
59072-970, Natal, RN, Brazil
b Department of Mechanical Engineering, Polytechnic School of University of São Paulo (USP-SP),
as a function of the hardness. Finally, it was proposed a simple experimental-numerical methodology to determine the thickness of these ilms by comparing this numerical result with experimental Vickers hardness testing.
2 Methodology
To achieve the objective of the present study, a numerical analysis was developed, followed by an experimental hardness test in the ilm/substrate conjugate (TiN/M2).
2.1 Numerical procedure
Numerical analysis was developed with MARCTM Finite Elements commercial software (2015).17 In this study, discrete
models were used to reproduce the contact between the Vickers and Berkovich indenter and the sample. In accordance with Dias and Godoy (2010), these models did not consider the problems of indentation pile-up or sink-in.7 According to the literature, among others parameters, these features depend on the coeicient of friction between the indenter and the sample, which in the present study was considered to be zero, as friction has little inluence on indentation load.18-19
Both the Vickers and Berkovich indenters were modeled as a rigid plate, with a square or triangular base, respectively.7, 20 The
sample materials were considered isotropic and homogeneous with elastic-plastic behavior, as per Equation (1). This is a classical expression described in the literature, for example by Hosford and Caddell (1993).21 The samples were modeled with three-dimensional elements, as used by Libório (2015).12 As boundary
conditions, the nodal displacements at the base of the sample were restricted. The other conditions were established using 1/4 of the symmetry for the Vickers model and 1/6 for the Berkovich model.7, 20, 22 The Vickers analysis was modelled with a mesh
with 17,480 nodes and 15,930 brick elements. The Berkovich model used a mesh with 6,584 nodes and 5,472 brick elements.
( )
E
elastic phase
K
plastic phase
1
. n 1 0
v
f
f
=
Q
Q
V
V
G
In Equation (1), σ, ε and E are efective stress, efective
strain and Young’s Modulus, respectively. K and n are constants that describe the strain-hardening characteristics of the material, n being its coeicient.8, 11, 12, 18, 20, 23 Table 1 shows the Young’s Modulus (E) and the Poisson coeicient
(ν) that were obtained in the literature and were used in the present simulation.24-25 The values of K and n were obtained from Equation (2), by combining the experimental results of the Berkovich test with numerical simulations.7
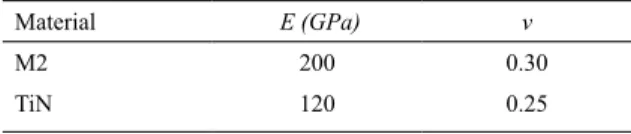
Table 1. Mechanical properties of M2 tool steel substrate and
TiN ilm.24-25
Material E (GPa) v
M2 200 0.30
TiN 120 0.25
In this Equation (2), εu is the ultimate strain, εois the
yield strain, σu is the ultimate strength, σois the yield stress
and n is the strain-hardening coeicient, as seen previously.
These values were obtained using the experimental numerical methodology developed by Dias and Godoy (2010).7
2.2 Determination of ilm thickness
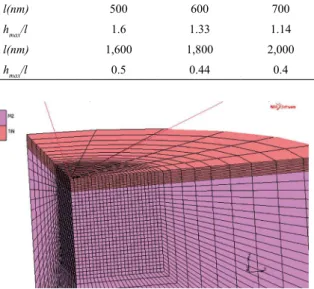
After determining the mechanical properties of both the ilm (TiN) and substrate (M2), Vickers hardness testing was simulated on the surface of the TiN/M2 conjugate. Given that the thickness of the Titanium Nitride ilm was initially unknown, in the simulations of the Vickers test a ixed value for penetration depth was assigned as 0.8 µm.12 The aim was to obtain a surface hardness range that relects the contribution from the ilm and the substrate. This Vickers hardness was computed as numerical load (P) divided per area of the residual impression on surface (Ar) using the known Equation (3).20, 26 Next, the ilm thickness (l) was varied in the numerical analysis and the hardness behavior was determined as a function of the ratio between maximum penetration depth and ilm thickness (hmax/l). The values adopted for the ratio in the diferent simulations of the Vickers test are presented in Table 2. Figure 1 illustrated one of the meshes used in the present work. In this case, the indentation depth was 2.5 µm.
( ) , , ln ln where and K n 2 n n u u 0 0 0 0 0 0 v v f f f v f f v v = = = T T T Y Y Y ( ) H P Ar 3 V=
Originpro™ 8 software was used to analyze the numerical behavior of the relationship between numerical Vickers hardness (HV) and the hmax/l ratio.27 The power curve obtained by this analysis was exponential as shown in Equation (4). Constants
A1, A2, t1, t2 and HV0 are the coeicients of this expression.
The ordinate axis represents the numerical Vickers hardness values and the x axis (abscissas) the independent variable
(hmax/l). In this expression, constant HV0 was included in order to it the curve, without further considerations regarding its physical meaning, at least at this point.
( )
HV=A e1 t1+A e2 t2+HV0 4
\ \
-
-This expression was one of the main results obtained in this study, due to the fact that this numerical HV curve as a function of hmax/l was used to determine ilm thickness by
Table 2. Used values in a FE simulation for diferent thickness (l) and for the ratio hmax/l.
l(nm) 500 600 700 900 1,000 1,200 1,350
hmax/l 1.6 1.33 1.14 0.88 0.8 0.66 0.59
l(nm) 1,600 1,800 2,000 2,350 2,500 3,000 8,000
hmax/l 0.5 0.44 0.4 0.34 0.32 0.26 0.1
Figure 1. Numerical mesh used to simulate the Vickers indentation testing with hmax/l = 0.34, using 1,308 brick elements for TiN ilm
and 5,742 elements for M2 substrate.
Figure 2. The low chart used to combine numerical and experimental
procedures to determinate the thickness of ilm.
experimental procedures to determinate the ilm thickness. First it was estimated the depth of penetration (hmax) to perform numerical simulation, varying the ilm thickness (l) and calculating their surface hardness (HV). Next, it was determined the HV versus hmax/l curve. An experimental Vickers hardness was entered to the numerical curve and was obtained the ilm thickness.
3 Results and Discussions
Based on the experimental results obtained in the instrumented indentation test with a Berkovich indenter, a number of numerical simulations was carried out in order to determine the mechanical properties for of both Titanium Nitride (TiN) and M2 tool steel substrate. As discussed previously, the methodology developed by Dias and Godoy (2010) was used to ind the yield limit (σo),
strain hardening exponent (n) and K constant for the TiN/M2
conjugate.7 Table 3 shows the mechanical properties found for
the aforementioned materials. Given the doubts still existing in the literature when an experimental numerical methodology is used to determine the mechanical properties of surface ilms, it was decided to verify and validate these mechanical properties. For example, an analysis of the result obtained for the yield limit of M2 steel indicated that it was within the range of values indicated in the literature, that is, between 1,650 MPa and 3,500 MPa.25 Furthermore, Table 4 shows a comparison
between experimental and numerical values for the indentation load and penetration depth of the Berkovich test in the M2 tool steel substrate. The diference between the mean maximum experimental load obtained with a mean penetration depth of 2,860 nm was about 1% when compared with the respective numerical value (Pnum), for a penetration depth of 2,900 nm. In summary, this numerical result indicates that the simulation of the Berkovich test is compatible with its experimental behavior for the substrate.
Obviously, the comparison between the experimental and numerical values of Berkovich indentation testing was not used for TiN ilm, given that ilm thickness was unknown. According to the literature, ilm thickness inluences the mechanical response of the conjugate when submitted to the indentation test.4, 23, 28 In other words, the simulations performed assessed not only ilm behavior, but also that of the M2/TiN conjugate. The mechanical proprieties in Table 3, as well as the properties exhibited in Table 1, served as input parameters for the FE software.17 After determination of these properties
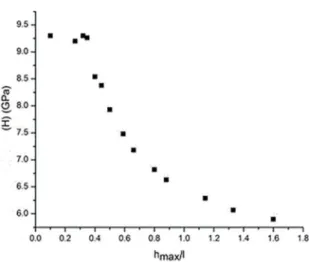
of the conjugate, fourteen simulations were conducted to represent the Vickers hardness test for the M2/TiN conjugate. In these simulations, the hmax/l ratios in Table 2 were used. Figure 3 shows the results of these simulations in terms of Vickers hardness behavior as a function of the hmax/l ratio. Qualitative assessment of the values shown in this igure demonstrates that for low hmax/l ratio values the supericial
hardness exhibits low contribution from the substrate,
Table 3. Input mechanical properties used to simulate the conjugate
TiN/M2.
Material K (MPa) n σ0 (MPa)
M2 4,995.13 0.12 2,874
TiN 28,115.66 0.42 6,441.0
Table 4. Numerical and experimental measures of P values in relation to hmax and the relationship between the experimental and numerical load value for M2 steel.
hnum (nm) hmax(nm) Pexp(mN) Pnum (mN) P diference
Data from Figure 3 were analyzed using the Originpro 8 program27, disregarding the irst three points, since they may be inluenced by ilm hardness, resulting in the graph depicted in Figure 4. This igure also illustrates the experimental hardness values reported by Almeida (2008) for the same sample of the M2/TiN conjugate.31 The irst mean hardness value was 8.9 GPa for a load of 0.49 N (50 gf). The second was 8.25GPa for a load 0.98 N (100 gf).
Figure 3. Numerical results for Vickers hardness in function of
hmax/l ratio for the conjugate M2/TiN.
remaining approximately constant.4, 23 Braz (2012) determined the experimental Vickers Hardness at about 11.0 GPa for the same TiN ilm. This author deposited the TiN ilm in M2 steel substrate by plasma process using the Plasma Laboratory at the Federal University of Rio Grande do Norte.29 Thus, the numerical supericial hardness exhibited a value close to that of the TiN ilm. On the other hand, the hardness value for large hmax/l ratios converges to that of the M2 steel substrate. Once again, in the literature, the HV of M2 steel varies between 2.0 and 7.0 GPa.25
In 2006, Gao et al., using the expanding cavity model for strain hardening material that follows Hollomon’s power law relationship, developed diferent relationships between hardness (HV), yield strength (σo), strain-hardening exponent (n), and Young’s modulus (E) for Vickers indentation.30
The Vickers hardness calculated from the Gao et al (2006)
formulations was then compared to the values obtained in the present work. From the expression for elastic power-law hardening materials (Equation 5) and using the mechanical properties (Tables 1 and 3) for the TiN ilm, the estimated Vickers hardness was 12.9 GPa. For the M2 steel substrate, the Vickers Hardness was 7.4 GPa, using the expression for elastic-perfectly plastic materials (Equation 6). In these two expressions, α is the half-included angle of the equivalent cone to the Vickers indenter.2, 30 The TiN hardness, calculated from Equation 5, difers 27% from the results exhibited in Figure 3. This diference could be explained by the fact that no hypothesis in terms of indentation morphology (neither pile-up, nor sink-in) was considered in this work or because Gao et al (2006) formulations are better when they were
applied in bulk materials, or both.30 The M2 hardness obtained, from Equation 6, difers 15% from the one determined here. This good result for the M2 steel also conirmed that this material has a small elastic recovery.
( ) cot
HV 32 1 1n 43 n1 31 E 5
n
0 0
v a v
= GS - X+S + XT YJ
( ) ln cot
HV 32 74 31 E 6
0 0
v a v
= G + T YJ
Figure 4. Numerical curve for Vickers hardness in function of hmax/l ratio for the studied conjugate.
Applying the algorithm shown in Figure 2, for a load of 0.49 N and Vickers hardness of 8.90 GPa, resulted in a thickness of 2,130 nm for TiN ilm. A thickness of 1,780 nm was obtained when the hardness of 8.25 GPa (P = 0.98N) was used. These values were compared with the thickness of this TiN ilm in this sample, also found by Almeida (2008)31, using the Calowear Testing. Table 5 illustrates the diference obtained by the proposed methodology in determining ilm thickness, compared to the experimental value obtained by Almeida (2008). The irst thickness value showed a diference of around 1.4% in relation to the experimental value. The second value obtained from the higher hardness exhibited a diference of around 17.7%. The better ilm thickness result is due to the lower load in the hardness test. In this case, the Vickers indenter had lower penetration into the TiN/M2 conjugate. It is important to remember that in the simulated test a penetration depth of 0.8 µm was used, corresponding to 38% of ilm thickness experimentally determined by Almeida (2008).31
Table 5. Comparison between the thickness values for the TiN ilm obtained by proposed method with the experimental value obtained
through the assay Calowear (Almeida, 2008).
Vickers Hardness (load) (0.98 mN)8.9 GPa (0.49 mN)8.25 GPa
Numerical thickness 1,783 nm 2,130 nm
Experimental thickness31 2,100 nm
4 Conclusions
The 3D finite element (FE) model developed in the present work was able to adequately represent the general behavior of the Berkovich and Vickers indentation testing. Also, this study employed a methodology that combined experimental Vickers hardness tests with their numerical simulation in order to obtain the thickness of a titanium nitride film deposited by PVD onto an M2 tool steel.
Experimental procedures were carried out to obtain the mechanical properties of the materials under study. This procedure, developed by Dias and Godoy (2010)7,
was able to determine the mechanical properties for both the substrate (M2 steel) and the film (TiN). These mechanical properties exhibited consistent results when compared to literature data. Also, the numerical simulation of the Berkovich indentation test for a sample of M2 steel substrate reproduced the behavior of the same experimental assay. It is important to emphasize that the use of numerical analysis in combination with indentation testing confirmed promising results in assessing mechanical properties.
Knowing the mechanical properties of the film and substrate conjugate, numerical simulations were used to obtain hardness behavior as a function of the variation in film thickness or as a function of the hmax/l ratio. Next, data processing software Originpro™ 8 (2008)27 was applied
to obtain a curve that characterizes Vickers hardness as a function of film thickness or the hmax/l ratio. Finally, film thickness was determined by combining the results of Vickers hardness tests and their Vickers hardness curve for the M2/TiN conjugate. Numerical results showed that this methodology produced good results for the sample under study and may represent a new direction in relation to other burdensome procedures for determining film thickness, such as SEM and Calowear testing.
We intend to improve this methodology by introducing a convergence test in the flowchart of Figure 2. Another possible optimization to be incorporated into this methodology would be to compare the experimental numerical behavior of Berkovich hardness, given that this experimental test was conducted a priori to determine the mechanical properties of the TiN/Ti system required for numerical simulation.
5. Acknowledgments
The authors gratefully acknowledge the funding by CNPq (Brazilian Council for Scientific and Technological Development), under grants Universal 14/2011, process 484818/2011-2, and Universal 14/2014, process 460943/2014-6. One of them also thanks for the CAPES (Higher Coordination Brazilian Agency for Scientific and Educational Training), through process BEX 6569-14.
6 References
1. Le Bourhis E. Indentation mechanics and its application to thin ilm characterization. Vacuum. 2008;82(12):1353-1359. 2. Moussa C, Bartier O, Mauvoisin G, Pilvin P, Delattre G.
Characterization of homogenous and plastically graded materials
with spherical indentation and inverse analysis. Journal of Materials Research. 2012;27(1):20-27.
3. Zeng K, Chiu C. An analysis of load-penetration curves from
instrumented indentation. Acta Materialia. 2001;49(17):3539-3551. 4. Oliver WC, Pharr GM. Measurement of hardness and elastic
modulus by instrumented indentation: Advances in understanding
and reinements to methodology. Journal of Materials Research.
2004;19(1):3-20.
5. Souza GB, Foerster CE, Silva SLR, Serbena FC, Lepienski CM, Santos CA. Hardness and elastic modulus of ion-nitrided
titanium obtained by nanoindentation. Surface and Coatings Technology. 2005;191(1):76-82.
6. Fischer-Cripps AC. Critical review of analysis and interpretation
of nanoindentation test data. Surface and Coatings Technology.
2006;200(14-15):4153-4165.
7. Dias AMS, Godoy GCD. Determination of Stress-Strain Curve
through Berkovich Indentation Testing. Materials Science Forum. 2010;636-637:1186-1193.
8. Pulécio SAR, Farias MCM, Souza RM. Finite element and
dimensional analysis algorithm for the prediction of mechanical
properties of bulk materials and thin ilms. Surface and Coatings Technology. 2010;205(5):1386-1392.
9. Rodríguez SA, Alcalá J, Souza, RM. The reduced modulus in the analysis of sharp instrumented indentation tests. Journal of Materials Research. 2012;27(16):2148-2160.
10. Sun Y, Bloyce A, Bell T. Finite element analysis of plastic
deformation of various TiN coating/substrate systems under
normal contact with a rigid sphere. Thin Solid Films.
1995;271(1-2):122-131.
11. Araújo R, Dias AMS. Numerical Evaluation of Strength in the
Interface during Indentation Spherical Testing in Thin Films.
Materials Sciences and Applications. 2014;5(3):149-157.
12. Libório MS. Metodologia numérico-experimental para
avaliação da espessura de ilmes de nitreto de titânio obtidos
por processamento a plasma. [Dissertation]. Natal: Federal University of Rio Grande do Norte; 2015. 73 f. [in Portuguese]
13. Bressan JD, Tramontin A, Rosa C. Modeling of nanoindentation of bulk and thin ilm by inite element method. Wear.
2005;258(1-4):115-122.
14. Pelletier H, Krier J, Mille P. Characterization of mechanical properties of thin ilms using nanoindentation test. Mechanics of Materials. 2006;38(12):1182-1198.
15. Le Bourhis E, Patriarche G. Plastic deformation of III–V
semiconductors under concentrated load. Progress in Crystal Growth and Characterization of Materials. 2003;47(1):1-43.
16. Nunes Filho A. Inluência das espécies ativas na absorção
17. Marc™ MSC. Software Corporation. Volume A: Theory and User Information; User’s Manual. Available from: <http://www.mscsoftware. com>. Access in: 31/08/2015.
18. Mata M, Alcalá J. The role of friction on sharp indentation. Journal of the Mechanics and Physics of Solids. 2004;52(1):145-165. 19. Araújo R, Dias AMS, Godoy GCD. Numerical study of the inluence
of friction coeicient for indentation testing in thin ilms. Matéria (Rio de Janeiro). 2013;18(1):55-66. [in Portuguese]
20. Dias AMS, Modenesi PJ, Godoy GCD. Computer simulation of stress distribution during Vickers hardness testing of WC-6Co. Materials Research. 2006;9(1):73-76.
21. Hosford WF, Caddell RM. Metal Forming: Mechanics and Metallurgy. New Jersey: Prentice Hall PTR; 1993.
22. Zhang W, Subhash G. An elastic-plastic-cracking model for inite element
analysis of indentation cracking in brittle materials. International Journal of Solids and Structures. 2001;38(34-35):5893-5913.
23. Souza GB, Mikowski A, Lipienski CM, Foerster CE. Indentation hardness
of rough surfaces produced by plasma-based ion implantation process.
Surface and Coatings Technology. 2010(18-19);204:3013-3017.
24. Shan Z, Sitaraman SK. Elastic-plastic characterization of thin ilms using
nanoindentation technique. Thin Solid Films. 2003;437(1-2):176-181.
25. Matweb. Material Property Data. Available from: <http://www. matweb.com>. Access in: 23/06/2015.
26. Souza SA. Ensaios Mecânicos de Materiais Metálicos: Fundamentos teóricos e práticos. 5a Ed. São Paulo: Edgard Blücher; 2000. [in Portuguese]
27. OriginLab© Corporation. OriginPro 8 SR4(2008). Available
from: <http://www.originlab.com>. Access in: 14/02/2015. 28. Chen J, Bull SJ. Assessment of the toughness of thin coatings
using nanoindentation under displacement control. Thin Solid Films. 2006;494(1-2):1-7.
29. Braz DC. Tratamento termoquímico do titânio auxiliado por
plasma de Ar-N2-O2. [Dissertation]. Natal: Federal University of Rio Grande do Norte; 2011. 97 f. [in Portuguese]
30. Gao XL, Jing XN, Subhash G. Two new expanding cavity
models for indentation deformations of elastic strain-hardening materials. International Journal of Solids and Structures.
2006;43(7-8):2193-2208.
31. Almeida EO. Construção, caracterização e aplicação de eletrodos