Reference Ranges for Uterine Artery
Pulsatility Index during the Menstrual Cycle:
A Cross-Sectional Study
Luís Guedes-Martins1,2,3*, Rita Gaio4,5, Joaquim Saraiva1,3,6, Sofia Cerdeira7,8, Liliana Matos1,2,9, Elisabete Silva1,2, Filipe Macedo10, Henrique Almeida1,2,11
1Department of Experimental Biology, Faculty of Medicine, University of Porto, 4200–319 Porto, Portugal,
2IBMC-Instituto de Biologia Molecular e Celular, 4150–180 Porto, Portugal,3Centro Hospitalar do Porto EPE, Departamento da Mulher e da Medicina Reprodutiva, Largo Prof. Abel Salazar, 4099–001 Porto, Portugal,4Department of Mathematics, Faculty of Sciences, University of Porto, Rua do Campo Alegre, 4169–007 Porto, Portugal,5CMUP-Centre of Mathematics, University of Porto, Rua do Campo Alegre, 4169–007 Porto, Portugal,6Obstetrics-Gynecology, Private Hospital Trofa, 4785–409 Trofa, Portugal,
7Gulbenkian Program for Advanced Medical Education, 1067–001 Lisbon, Portugal,8Department of Medicine, Beth Israel Deaconess Medical Center, Harvard Medical School, Boston, Massachusetts, United States of America,9Faculty of Nutrition and Food Sciences, University of Porto, Rua Dr. Roberto Frias, 4200–465 Porto, Portugal,10Department of Cardiology, Faculty of Medicine, University of Porto, 4200–319 Porto, Portugal,11 Obstetrics-Gynecology, Hospital-CUF Porto, 4100–180 Porto, Portugal
Abstract
Background
Cyclic endometrial neoangiogenesis contributes to changes in local vascular patterns and is amenable to non-invasive assessment with Doppler sonography. We hypothesize that the uterine artery (UtA) impedance, measured by its pulsatility index (PI), exhibits a regular pattern during the normal menstrual cycle. Therefore, the main study objective was to derive normative new day-cycle-based reference ranges for the UtA-PI during the entire cycle from days 1 to 34 according to the isolated time effect and potential confounders such as age and parity.
Methods
From January 2009 to December 2012, a cross-sectional study of 1,821 healthy women un-dergoing routine gynaecological ultrasound was performed. The Doppler flow of the right and left UtA-PI was studied transvaginally by colour and pulsed Doppler imaging. The mean right and left values and the presence or absence of a bilateral protodiastolic notch were re-corded. Reference intervals for the PI according to the cycle day were generated by classi-cal linear regression.
Results
The majority of patients (97.5%) presented unilateral or bilateral UtA notches. The crude 5th, 50th, and 95th reference percentile curves of the UtA-PI at 1–34 days of the normal OPEN ACCESS
Citation:Guedes-Martins L, Gaio R, Saraiva J, Cerdeira S, Matos L, Silva E, et al. (2015) Reference Ranges for Uterine Artery Pulsatility Index during the Menstrual Cycle: A Cross-Sectional Study. PLoS ONE 10(3): e0119103. doi:10.1371/journal. pone.0119103
Academic Editor:Fatima Crispi-Brillas, University of Barcelona, SPAIN
Received:September 26, 2014
Accepted:January 28, 2015
Published:March 5, 2015
Copyright:© 2015 Guedes-Martins et al. This is an open access article distributed under the terms of the
Creative Commons Attribution License, which permits unrestricted use, distribution, and reproduction in any medium, provided the original author and source are credited.
Data Availability Statement:All relevant data are within the paper and its Supporting Information file.
Funding:The authors have no support or funding to report.
menstrual cycle were derived. In all curves, a progressive significant decrease occurred during the first 13 days, followed by an increase and recovery in the UtA-PI. The adjusted 5th, 50th, and 95th reference percentile curves for the effects of age and parity were also obtained. These two conditions generated an approximately identical UtA-PI pattern during the cycle, except with small but significant reductions at the temporal extremes.
Conclusions
The median, 5th, and the 95th percentiles of the UtA-PI decrease during the first third of the menstrual cycle and recover to their initial values during the last two thirds of the cycle. The rates of decrease and recovery depend significantly on age and parity.
Introduction
The uterus requires an adequate blood supply to fulfil its essential role in human reproduction. As the uterine artery (UtA) provides most of the perfusion, assessment of its vascular proper-ties is expected to provide important information on the uterine ability to allow the fertilized ovum to implant and pregnancy to progress. Doppler ultrasound has become a mainstay in the assessment of such properties because of the development of adequate, non-invasive proce-dures and easy-to-use equipment. Using Doppler ultrasound, a variety of circulatory data can be estimated and integrated into a quantitative determination of different impedance parame-ters. Of these, major importance has been attributed to the pulsatility index (PI) because it ap-pears to more appropriately describe the blood velocity waveform [1].
Pregnancy is the most impressive change that occurs in the uterus. The nutritionally de-manding growing foetus necessitates a large and progressive adaptation in the pelvic circula-tion, which includes the UtA and the internal iliac artery, from where it is derived [2]. In the non-pregnant condition, the UtA Doppler waveform velocity shows a systolic flow rapid rise and sudden fall that is immediately followed by a notch during early diastole [3]; however, this high impedance feature progressively disappears during pregnancy and is present in only 5% of women from 25 weeks onwards [1]. In this context, the most important change in the UtA-PI is its progressive decrement [1,4]. This change is related to major changes at the placental bed and in the uterine artery itself, which shifts from a resistance vessel to a capacitance vessel to cope with the foetal demands. Such change is so important that, during the second trimester, the uterine artery PI increases rather than decreases, and combined with the notch presence, is considered a good predictor of preeclampsia and severe intra-uterine growth restriction [5].
The monthly cyclic changes in the non-pregnant genital tract also suggest that regulated changes occur in the uterine blood supply to endow the endometrium with the ability to receive the ovum, should fertilization occur. Indeed, such cyclic changes were the subject of a number of studies measuring circulatory data in the UtA and its distal branches such as the radial and spiral arteries. The reports, however, evidenced complex temporal relationships and sometimes conflicting results.
increased [11]. The decreased UtA-PI, particularly during the luteal phase, together with the increased blood velocity in the UtA and its vascular network, indicated increased uterine perfu-sion in preparation for implantation [8,9]. In fact, low PI of the uterine artery [12] and endo-metrial flow [13] were associated with improved implantation rates, further supporting the view that increased local perfusion favours successful establishment of pregnancy.
It should be emphasized that, in contrast to the UtA distal branches, the data for the UtA it-self have been less consistent. While some studies failed to evidence any association [13–15], others reported an association between the lower UtA-PI at mid-cycle, higher pregnancy rates [12,16,17], and fewer miscarriage events [18]. These findings indicate that a more in-depth knowledge of the uterine circulation during the normal menstrual cycle (NMC) will provide relevant insights on reproductive physiological changes and allow the recognition of abnormal patterns; in turn, these data would prove useful in the management of reproductive disorders such as polycystic ovary syndrome, miscarriage, and repeated abortion.
Notwithstanding the gains afforded by previous investigations in unveiling UtA impedance variations during the menstrual cycle, these studies were limited by the number of women en-rolled and the duration that each cycle was evaluated. In addition, day-cycle-based reference ranges for the mean UtA-PI have not been established using well-established methodological guidelines [19–21], which would prove helpful in the management of fertility disorders such as those mentioned above.
These shortcomings led us to determine normative new reference ranges for the UtA-PI based on the day-cycle from days 1 to 34 of the NMC, while also isolating the time effect and adjusting the findings for potential confounders such as age and parity.
Materials and Methods
Subjects
The research protocol was approved by the ethics committee (IRB protocol number: 150–13 [096-DEFI/122-CES]) of Centro Hospitalar do Porto, Unidade Maternidade Júlio Dinis (CHP-MJD), and all subjects provided written informed consent.
A cross-sectional study of 1821 healthy women undergoing routine gynaecological ultra-sound examination was performed from January 2009 to December 2012. During the first ap-pointment that coincided with the ultrasound evaluation, subjects were examined by a senior specialist who reviewed the patient’s history, and verified the absence of previous hypertension, structural heart disease, diabetes and other endocrine disorders, immune disease, renal and haematological conditions, and chronic infections. A detailed gynaecological examination ruled out the presence of any pelvic or gynaecological abnormality. Inclusion criteria were: identification of the first day of the most recent menstrual period (day 1); regular menstrual cy-cles; absence of gynaecological disorders, menorrhagia, and established pelvic pathology on transvaginal ultrasound examination (including fibroids, abnormal sizes or clusters of ovarian cysts, and tubal disease); no chronic medication, including hormonal contraception, for the preceding 4 months; and absence of pregnancy as confirmed by ultrasound.
Doppler flow assessment
The ultrasound examination was performed with the woman in the lithotomy position and at any time of day. Uterine artery Doppler evaluation was performed using a Voluson 730 Pro (GE Healthcare Technologies, Milwaukee, WI, USA) ultrasound unit containing multifrequen-cy transvaginal and transabdominal transducers. Assessments were performed by a single op-erator with vast experience in Doppler ultrasound to avoid inter-observer variability using a transvaginal transducer. A sagittal image of the uterus that included the cervical canal and in-ternal cervical os was obtained. The transducer was then gently tilted from side to side, and col-our flow mapping was used to identify each uterine artery at the level of the internal os. Pulsed wave Doppler was used with a sampling gate set at 2 mm to image the entire vessel and ensure that the angle of insonation was less than 30°. UtA-PIs were measured automatically as follows:
PI ¼ systolic peak velocity end diastolic velocity
mean velocity during cardiac cycle
Three similar consecutive waveforms were obtained, and the mean PI of the left and right arteries was calculated. The presence or absence of a bilateral early protodiastolic notch in UtA was evaluated. A positive notch was defined as a persistent decrease in the blood flow velocity during early diastole that was less than the diastolic peak velocity in at least one UtA Doppler ultrasound spectrum. Absence of the notch was defined by its bilateral absence.
Intraobserver reliability was obtained from two readings performed at the beginning and end of the examination during the first 100 recordings of pulsatility indices in the
uterine arteries.
Statistical analysis
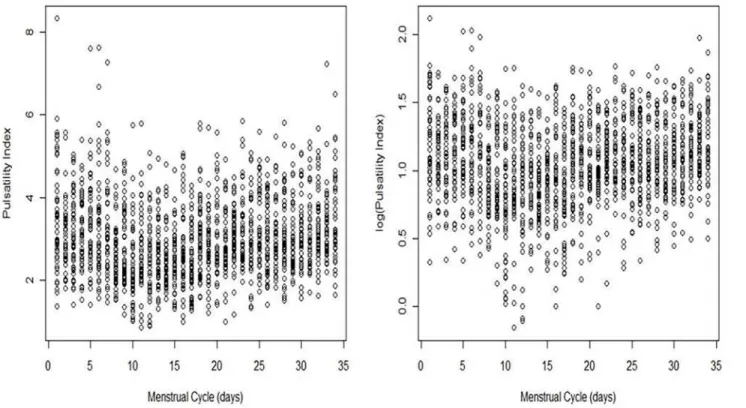
The Chi-squared test assessed the homogeneity of proportions for categorical variables. The population reference intervals for PI were derived by regression modelling of the PI values over time during the menstrual cycle. The response was log-transformed because of the positive skewness observed in the empirical distribution (Fig. 1). Age group, Body Mass Index (BMI), parity status (primiparous vs multiparous), and smoking were considered potential time-effect confounders. However, adequate adjustment for these variables identified age and parity as the only statistically significant confounders. The crude and adjusted (for age group and parity) trends of the PI during the menstrual cycle were identified.
To study the crude effect of the menstrual cycle progression on the UtA-PI, a cubic polyno-mial fit the data significantly better than did a quadratic. No polynopolyno-mial of a degree higher than three was considered, as those curves may exhibit unrealistic features such as waviness or sharp deviation at extreme values of the days [19]. Each day of the menstrual cycle was denoted asd, and a fitted model was generated as follows:
Eðlogð Þ jPI dÞ ¼ b 0þb1
d
10þb2
d
10
2
þb3
d
10
3
ð1Þ
with constantsβ0β1β2β3and a rescaling in the variabledto avoid very small regression coeffi -cients. This equation was rewritten using multiplicative effects as follows:
EðPI j dÞ ¼ Ceg1dþg2d 2
þg3d 3
withC ¼ eb0; g
1 ¼ b1
10; g2 ¼ b2
102andg3 ¼ b3
Every centile curve for PI was then estimated by the following equation:
centileðdÞ ¼ exp½logdðPIÞðdÞ þKsdbÞ:
Here,logdðPIÞðdÞis the predicted response at daydof model (1), K is the corresponding centile of the standard Gaussian distribution, andsdb is the standard deviation of the unscaled residuals of model (1).
To obtain centile curves stratified by age group (group 1, 18–26 years; group 2, 27–35 years; group 3, 36–50 years) and parity (nulliparousvsparous), the above regression procedure was refined. For age groupaand parity statusp, the best fitted model was as follows:
Eðlogð ÞjPI ðd; a; pÞÞ ¼ b
0ða;pÞ þb1ð Þa
d
10þb2ð Þa
d
10
2
þb3
d
10
3
ð2Þ
withβ0depending on the two considered factors,β1andβ2depending only on the age group, andβ3designated as a constant. The reference categories corresponded to the youngest and the nulliparous classes.
Intraclass correlation coefficients (ICC) and 95% confidence intervals were calculated using a two-way mixed-effects model with absolute agreement. The reliability coefficient, which is the difference value exceeded by only 5% of pairs of measurements in a single subject, was cal-culated as 1.96 times the standard deviation of the difference between pairs of repeated mea-surements [22].
All statistical analyses were carried out using the R language and software environment for statistical computation, version 2.12.1 [23]. The significance level was fixed at 0.05.
The study adhered to the STROBE (Strengthening the Reporting of Observational studies in Epidemiology) guidelines for observational studies, and all recommendations were included in the study [S1 Table].
Results
A total of 1821 healthy women were considered eligible for this study. Of these, 153 were ex-cluded (8.4%); 128 women did not have clinical records in the menstrual calendar according to the study protocol; 11 women were pregnant at the time of ultrasound assessment; in 10 cases, the pulsatility index in the uterine arteries could not be measured because of technical difficul-ties; and four women refused to participate in the study.
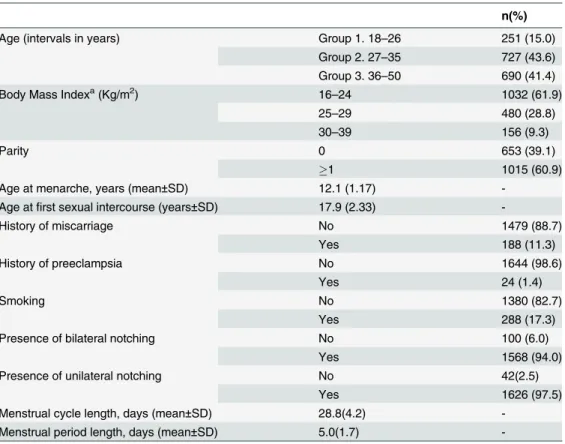
The demographic characteristics of the 1668 women included in the study are summarized inTable 1. Their ages ranged from 18 to 50 years old, and 41.4% were older than 35 years. Ad-ditionally, 39.1% were nulliparous, and the majority of the patients (97.5%) exhibited a notch in the uterine arteries (unilaterally or bilaterally).
UtA-PI during the normal menstrual cycle
The reliability coefficient for the UtA-PI was 0.434. The ICC for the intraobserver reliability of the UtA-PI measurements was 0.984, with a 95% confidence interval ranging from 0.976 to 0.989.
Table 1. Demographic characteristics of the 1668 women included in the study.
n(%)
Age (intervals in years) Group 1. 18–26 251 (15.0)
Group 2. 27–35 727 (43.6) Group 3. 36–50 690 (41.4)
Body Mass Indexa(Kg/m2) 16–24 1032 (61.9)
25–29 480 (28.8)
30–39 156 (9.3)
Parity 0 653 (39.1)
1 1015 (60.9)
Age at menarche, years (mean±SD) 12.1 (1.17)
-Age atfirst sexual intercourse (years±SD) 17.9 (2.33)
-History of miscarriage No 1479 (88.7)
Yes 188 (11.3)
History of preeclampsia No 1644 (98.6)
Yes 24 (1.4)
Smoking No 1380 (82.7)
Yes 288 (17.3)
Presence of bilateral notching No 100 (6.0)
Yes 1568 (94.0)
Presence of unilateral notching No 42(2.5)
Yes 1626 (97.5)
Menstrual cycle length, days (mean±SD) 28.8(4.2)
-Menstrual period length, days (mean±SD) 5.0(1.7)
-SD, standard deviation
aBody Mass Index (BMI) was measured immediately before Doppler assessment.
The days evaluated in the menstrual cycle varied from 1 to 34, and the collected data were slightly unbalanced. The least frequently assessed point was day 34 (39 patients), and the most frequently assessed were days 22 and 26 (54 patients each) (Table 2). However, the empirical distribution for the day number was essentially uniform, with a sample mean ± standard deviation of 17.3 ± 9.7 compared with 17.0 ± 9.8 expected in a uniform distribution.
Concerning the fitting of model (1), visual inspection of the normality and homosce-dasticity of the residuals was performed (Fig. 2, Panel A). There were no serious depar-tures from normality except at a few extreme points, mostly located on the left tail. Data with an absolute value of the standardized residuals greater than three were removed. A total of 11 data points were removed (eight on the left tail), corresponding to less than 1% of the total sample size. The highest and lowest cutoff values for PI in these women were 7.26 and 1.03, respectively.
All parameter estimates of the final fitted model were statistically significant (Table 3). Stan-dard errors of the estimates were up to 3% smaller than the errors in the model using the total data. Residual plots exhibited reasonable properties for normality adherence (Fig. 2, Panel B): 89% of the standardized residuals lay between-1.645 and 1.645; the boxplot revealed an approx-imately symmetric distribution with the median line at approxapprox-imately the centre of the
box and symmetric whiskers; and the quantile-quantile (Q-Q) plot of the studentized residuals showed little departure from the confidence band for the correspondenttdistribution. In addi-tion, the Lilliefors-corrected Kolmogorov-Smirnov normality test provided a p-value of 0.002; this statistical significance was overlooked because of the large sample size (n = 1657). The out-liers were again removed, but the results were no better.
The plot of the logarithmized UtA-PI values against the days of the cycle did not show any substantive changes in the standard deviations of the values along the menstrual cycle (Fig. 1); however, a formal statistical model for this relationship was applied. The linear regression of the scaled absolute residuals (SARs), defined as the product ofpffiffiffiffiffiffiffiffip=2by the absolute residuals,
on a polynomial of degree 1 in the variableDaywas statistically significant (p<0.001), and no higher-order terms were identified. As this regression only explained approximately 1% of the SARs’total variability, it was considered redundant, and therefore the residual homoscedastici-ty of model (1) did not appear violated.
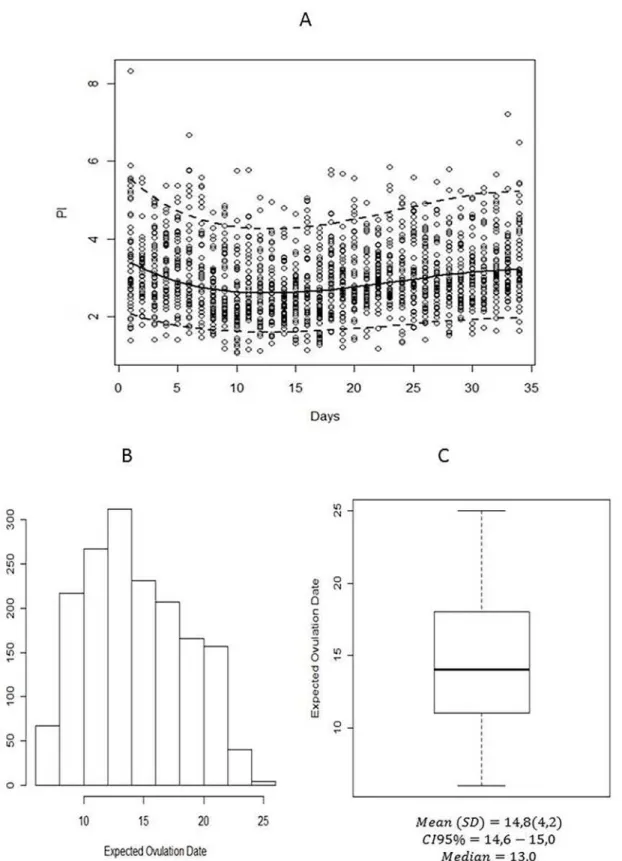
The predicted 5th, 50th, and 95thpercentile regression curves are presented inTable 2and plotted inFig. 3. The expected ovulation date (EOD) was calculated in each patient assuming that the luteal phase lasted approximately 2 weeks (i.e.,E0D = menstrual cycle length−14). Ac-cordingly, the 50thcentile curve for PI, which under the normality assumption coincides with the mean curve, began at day 1 at its maximum value (3.40) and decreased until reaching its minimum value at day 12–13. From this day onwards, the curve increased until reaching 3.20 (50thcentile) at the end of the menstrual cycle (day 34). If the curve failed to stop at day 34, it continued to decrease afterwards. Day 34 corresponded to the local maximum of the defined function.
Effect of maternal age and parity on UtA-PI during normal menstrual
cycle
To obtain centile curves stratified by age group and parity status, the regression procedure was refined taking these factors into consideration, while also excluding the same 11 data points as previously. The best fitted model is described in model (2), and the estimated regression coeffi-cients and corresponding 95% confidence intervals are summarized inTable 4. All estimates Table 2. Observed and predicted percentiles of the uterine artery pulsatility index on each cycle day.
Observed Predicted
Cycle (days) n EODa(n) 5thcentile 50thcentile 95thcentile 5thcentile 50thcentile 95thcentile
1 50 0 1.74 3.37 5.55 2.08 3.40 5.55
2 50 0 2.00 3.04 4.59 1.99 3.24 5.29
3 49 0 1.88 3.02 4.90 1.90 3.11 5.07
4 48 0 1.83 3.17 4.60 1.83 2.99 4.89
5 51 0 1.94 3.25 5.00 1.78 2.90 4.73
6 52 1 1.88 3.15 5.77 1.73 2.82 4.60
7 46 20 1.80 3.12 5.37 1.69 2.76 4.50
8 52 46 1.59 2.41 4.03 1.66 2.71 4.42
9 50 107 1.83 2.48 4.64 1.63 2.67 4.36
10 52 110 1.09 2.21 3.93 1.62 2.64 4.31
11 49 136 1.24 2.40 4.48 1.61 2.62 4.28
12 48 131 1.05 2.60 4.10 1.60 2.61 4.27
13 49 103 1.52 2.62 4.18 1.60 2.61 4.26
14 53 209 1.81 2.33 4.09 1.60 2.62 4.27
15 46 160 1.42 2.56 3.66 1.61 2.63 4.29
16 50 71 1.43 2.60 4.87 1.62 2.65 4.32
17 52 104 1.36 2.33 3.93 1.63 2.67 4.36
18 52 103 1.93 2.99 4.66 1.65 2.70 4.40
19 49 67 1.62 2.88 3.96 1.67 2.73 4.45
20 49 99 1.89 2.74 4.78 1.69 2.76 4.51
21 50 96 1.85 2.72 4.31 1.72 2.80 4.57
22 54 61 2.14 3.01 4.18 1.74 2.84 4.64
23 48 19 2.30 2.86 5.03 1.77 2.88 4.70
24 45 21 1.56 2.91 4.81 1.79 2.92 4.77
25 51 4 1.81 3.07 4.73 1.82 2.97 4.84
26 54 0 1.87 2.96 4.30 1.84 3.01 4.91
27 46 0 2.08 2.86 4.71 1.87 3.05 4.98
28 47 0 1.67 2.94 4.52 1.89 3.09 5.04
29 47 0 2.16 2.90 4.58 1.91 3.12 5.09
30 50 0 1.97 3.00 4.61 1.93 3.15 5.14
31 43 0 2.19 2.94 4.90 1.94 3.17 5.18
32 49 0 2.16 3.25 4.95 1.95 3.19 5.21
33 48 0 2.41 3.14 4.29 1.96 3.20 5.23
34 39 0 2.11 3.21 5.42 1.96 3.20 5.23
aFor each patient, the expected ovulation date (EOD) was calculated assuming that the luteal phase exhibited a consistent duration of approximately 2 weeks, i.e.,E0D=menstrual cycle length—14.
Fig 2. Residual plots for the fitted models; from top to bottom and from left to right: boxplot of the standardized residuals, histogram of the standardized residuals, plot of the standardized residuals against the predicted values, and QQ-plot of the studentized residuals.Panel A employs the entire dataset; Panel B eliminates data from 11 outliers.
but one (a quadratic term on days of the menstrual cycle for women aged 27–35 years, p = 0.089) were statistically significant.
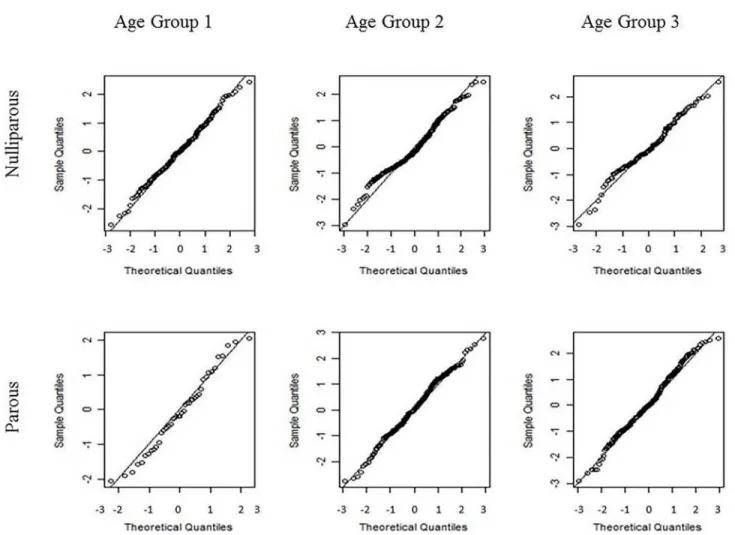
No significant interaction effects involving parity were identified. No serious outliers or evi-dence of violations in normality and homoscedasticity assumptions were detected within each age-parity sub-model (Figs.4and5). The residual regression on the explanatory variables, with a linear dependence on the cycle days, presented a value for the coefficient of determination (R2) of approximately 1% and did not identify the effect of age group as statistically significant. As before, the residual homoscedasticity of the model did not appear compromised. The resid-ual normality could only be rejected for nulliparous women aged 27–35 years (Fig. 4).
The standard deviation of the residuals of model (2) did not significantly change during the menstrual cycle; therefore, the coefficient significance inTable 4remained true for all
centile curves.
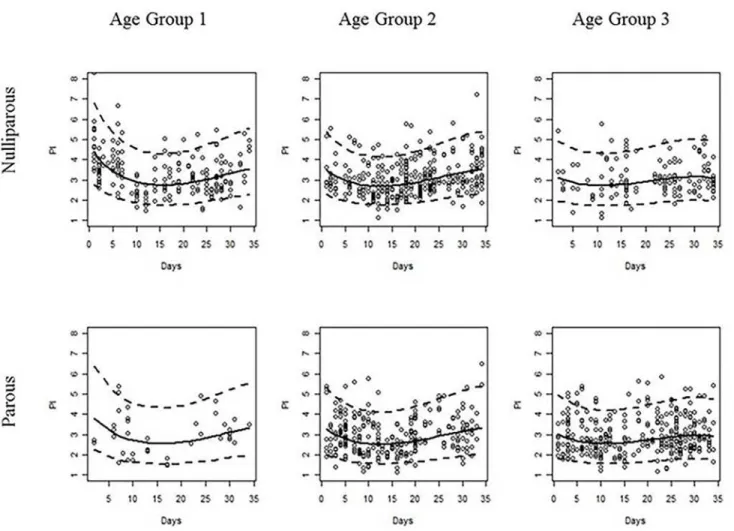
For any fixed age group and centile curve, a significant difference between the intercepts of the curves for nulliparous and parous women was identified, with the menstrual cycle in nullip-arous women beginning at higher UtA-PI values. Similarly, for any fixed parity status and cen-tile curve, there were significant differences between the intercept of the age group 2 (or 3) curve and that of age group 1 (Fig. 5).
Overall, the PI values exhibited a soft wave-like trend during the menstrual cycle within each maternal age and parity group. The values decreased until approximately the first third of the menstrual cycle and then increased to approximately the original value over the remainder of the cycle. This trend was independent from the parity status but was significantly dependent on the maternal age at the linear and quadratic levels. As the age increased, the minimum UtA-PI was reached more quickly, the range of the UtA-PI values decreased, and the curves became flat-ter (Fig. 5).
Discussion
Transvaginal assessment of UtA perfusion employing Doppler ultrasound offers several advan-tages over the transabdominal route [24]. The vessel is easily identified and located at close proximity, thus yielding clearer waveforms, and the insonation angle is near 0°, which results in high reproducibility [24,25]. Despite the diversity of features that may be determined through arterial resistance, it is impedance, the combination of forward and reflected blood flow, that is measured [26]. This is accomplished by indirectly measuring the UtA-PI, a tech-nique that has gained popularity in recent studies compared with other Doppler indices such as resistance index [1,27] and other scoring systems [28,29].
These principles were applied in the current study to generate Doppler colour-based refer-ence ranges for the mean UtA-PI between days 1 and 34 of the NMC in an appropriately large Table 3. Estimates of the regression coefficients and corresponding 95% confidence intervals (CI) of model (1)fitted without the 11 identified outliers.
Variables Regression Coefficients 95% CI
Intercept 1.279 (1.214, 1.344)*
Day/10 -0.573 (-0.730, -0.416)*
(Day/10)2 0.310 (0.206, 0.414)*
(Day/10)2 -0.044 (-0.064, -0.024)*
*Significant at the 0.05 level.
Fig 3. (A) Observed (circles) and predicted 5th, 50th, and 95thpercentile regression curves for the pulsatility index during the menstrual cycle. Histogram (B) and boxplot (C) of the expected ovulation date (EOD). For each patient, the EOD was calculated assuming that the luteal phase exhibited a consistent duration of approximately 2 weeks, i.e.,E0D = menstrual cycle length—14.
sample of healthy women. In addition, the effects of age and parity were assessed for each day during the NMC.
Statistics
The reliability evaluation demonstrated that UtA-PI measurement was highly repeatable as in-dicated by the ICC. There is sufficient scientific consensus that an ICC>0.7 reflects very low measurement error [22,30].
Stringer and validated methodological guidelines were used to construct the reference curves from the collected data [19–21,31]; a cross-sectional design was used as such studies are easier to perform and combine with clinical practice; and finally, the good intraobserver repro-ducibility in our study suggests that the mean UtA-PI is a reliable parameter in a clinical set-ting. The overarching principle is that a reference interval is the range of values encompassed by a pair of symmetrically placed extreme centiles, such as the 2.5thand 97.5thcentiles for a 95% interval [19]. Values lying outside the reference limits are considered unusual or extreme.
Several statistical methods have been used to generate reference intervals: linear regression (if necessary with modelling of the residual standard deviation), the LMS method [32], the non-parametric method of Healy, Rabash, and Young (HRY), and non-parametric quantile re-gression [21]. Each method has its advantages and limitations; however, the method that is most desired is the one allowing identification of the population centile of a given observation. Linear regression has that property and is simple and easily implemented by basic statistical software packages.
Perfusion changes during the normal menstrual cycle
The current study revealed a cyclic variation in the UtA impedance during the NMC; the UtA-PI was high during the temporal extremes and showed a mid-cycle depression, with the mini-mal values occurring between days 13 and 17. Independent assessment of the effects of age and parity also revealed that both conditions were associated with a significant decrease in the UtA impedance at the extremes of the cycle, but not during the mid-cycle, when the uterus under-goes impressive structural changes. These circulatory variations include the median, 5th, and 95thpercentiles of the UtA-PI regression curves from the initial through to the final third of Table 4. Estimates of the regression coefficients and corresponding 95% confidence intervals (CI) for the model stratified by age and parity.
Variables Regression Coefficients 95% CI
Intercept 1.546 (1.438, 1.654)*
Age Group 2 -0.236 (-0.361, -0.110)*
Age Group 3 -0.335 (-0.463, -0.206)*
Parous -0.066 (-0.098, -0.034)*
Day/10 -0.792 (-0.992, -0.592)*
(Day/10)2 0.353 (0.244, 0.461)
*
(Day/10)3 -0.042 (-0.062, -0.023)*
(Age Group 2):(Day/10) 0.216 (0.041, 0.391)*
(Age Group 3):(Day/10) 0.365 (0.188, 0.543)*
(Age Group 2):(Day/10)2 -0.044 (-0.044, 0.026)
(Age Group 3):(Day/10)2 -0.091 (-0.142, -0.039)*
*Significant at the 0.05 level.
the menstrual cycle. The mechanism underlying such impedance variation is unknown, but it likely reflects regulatory factors affecting the local vasculature and myometrium function.
Early during the cycle, increased myometrial tone is required to expel the remains of the sloughing endometrium; for this purpose, the smooth muscle cells contract, which has a nega-tive effect on uterine perfusion and generates high impedance to UtA blood flow. We suspect that a similar muscular change underlies the UtA-PI rise near the end of the cycle.
There is evidence that variations in muscular tone reflect circulating levels of female steroid hormones, particularly oestrogen, which is low early in the cycle but increases later during the follicular phase. Oestrogen promotes vascular smooth muscle relaxation and reduces sensitivity to adrenergic stimulation [33]; moreover, in experimental conditions, it was found to depress uterine contractility bothin vivo[34] and in freshly isolated rat uterine specimens [35]. This decrease in myometrial tone and increasingly thickened endometrium during the proliferative phase, together with the development of an extensive small vessel network, is the likely cause for the downward trend in impedance that reaches a minimum near day 13. After ovulation, progesterone concentration rises through the mid-secretory phase, promoting endometrium decidualization. Oestrogen decrement [36] and the ability of progesterone to overcome the Fig 4. Quantile-quantile (Q-Q) plots of the standardized residuals of model (2) for each combination of age and parity groups.Nulliparous women are presented in the first row, and parous women are presented in the second row. The age group increases from the left to right columns. From left to right and from top to bottom, the Lilliefors-corrected Kolmogorov-Smirnov normality test calculated p-values of 0.738,<0.001, 0.111, 0.954, 0.082, and 0.373, respectively.
inhibitory action of 17β-oestradiol on smooth muscle contractility [34,35] favour the rise in UtA-PI.
Other important molecules, acting independently or under the effect of sex steroids, may contribute to the circulatory changes. Prostanoids such as prostaglandin F2αand latanoprost
promote murine [35,36] and human [35] myometrial contractility, but their blood concentra-tion variaconcentra-tion during the cycle is uncertain. In addiconcentra-tion, vasopressin and oxytocin stimulate uterine contraction via myometrial vasopressin V1aand oxytocin receptors [37]. Near the end of the cycle, although circulating at a lower concentration [38], vasopressin exerts a stronger ef-fect than oxytocin [37]. Therefore, although the known actions of these compounds on the myometrium and its perfusion are appealing, their role during the cycle remains to be established.
Effect of parity and age on uterine flow impedance
In the current study, in non-pregnant women, the UtA-PI early and late in the cycle was signif-icantly lower in parous women than in nulliparous women. This point has not been examined in any known reports previously.
Fig 5. Observed (points) and estimated 5th, 50th, and 95thpercentile regression curves of the pulsatility index during the menstrual cycle for each combination of age and parity groups.Nulliparous and parous women are presented in the first and second rows, respectively. The age group increases from the left to right columns.
UtA-PI reduction is important because it is accompanied by improved myometrium sion, which provides local benefits. Indeed, it has been suggested that impaired uterine perfu-sion is a cause for unexplained infertility [39] and is reportedly a predictive indicator for the implantation and pregnancy outcomes [40–42]. Moreover, upon pregnancy establishment, parous women appear to have improved perfusion. In fact, as early as the first trimester, parous women exhibited lower UtA-PI and total peripheral resistance compared with those in nullipa-rous women [43], a finding that was also described in twin pregnancies compared between par-ous and nulliparpar-ous women [44]. Furthermore, all reports indicate that parous women have a lower prevalence of protodiastolic notching [45,46], a feature whose persistence is associated with a poor prognosis [5].
The enhanced perfusion in parous women likely results from vascular structural features that persist after the first pregnancy. Shortly after implantation, the spiral arteries undergo re-markable structural remodelling, which is necessary to accommodate the increased uteropla-cental perfusion [47]. At the end of pregnancy, these largely regress, but not entirely; in contrast to nulliparous women, spiral artery internal elastic lamina duplication or fragmenta-tion has been observed at the endometrial/myometrial juncfragmenta-tion of parous women [48]. Such permanent structural changes endow spiral arteries with reduced impedance that supports the parity-related UtA-PI reduction here reported.
Similar to parous women, the UtA-PI decreased at the extremes of the cycle in older women when compared with younger women. Interestingly, uterine stripes from aged non-pregnant women exhibited reduced contractility either spontaneously or upon exposure to oxytocin [49], suggesting that reduced uterine muscular tone underlies the lessened UtA impedance. The cause for this sluggish response in unknown but may be consequent to an age-related change in local regulation. For example, in the pregnant uterus, the UtA-PI shows a general de-creasing trend starting at the first trimester [1,2,4]; yet, when the UtA is measured at specific pregnancy time-points, a slight age-related increase may be observed [50,51]. Degenerative changes in the UtA wall, present even before menopause [52], or other local factors are the like-ly contributors to this particular observation.
Therefore, both age and parity similarly affect the UtA-PI of non-pregnant women during the NMC. Interestingly, the downward trend favours perfusion, which appears to bear repro-ductive benefits. Infants born to parous women tend to have increased birth weight [43], while older pregnant women tend to have increased placental weights [53], but the significance of these trends remains undefined.
Study limitations and future research
(1) The study was conducted in a sample of healthy women. (2) Further studies are necessary to assess abnormal uterine artery PI as a diagnostic or prognostic tool of reproductive disorders as the ovulation day was not identified, and the endometrial structure was not examined. (3) Our data were collected by a single, experienced operator, which could compromise the exter-nal validity of his results. Because the usefulness of a screening test depends not only on its pre-dictive ability but also on its reproducibility, future studies are needed to demonstrate the usefulness of these reference ranges, as well as their applicability.
Conclusions
while leaving the mid-cycle unchanged, suggesting that local mechanisms regulate an adequate uterine perfusion in preparation for implantation.
To the well-known cyclic structural features occurring in the uterus, the current study adds another cyclic circulatory event. The elucidation of the mechanisms underlying these changes, apart from providing new insights into the fascinating implantation process, may improve pre-diction of reproductive and pregnancy disorders, thus enhancing the importance of
UtA assessment.
Supporting Information
S1 Table. STROBE Statement—checklist of items that should be included in reports of
ob-servational studies.
(DOCX)
Acknowledgments
We thank the staff at the Department of Gynaecology of Centro Hospitalar do Porto for their kind contribution to this work.
Author Contributions
Conceived and designed the experiments: LG-M FM. Performed the experiments: LG-M HA. Analyzed the data: LG-M RG SC LM ES HA. Contributed reagents/materials/analysis tools: LG-M JS. Wrote the paper: LG-M HA FM SC. Critical revision of the manuscript: JS SC LM ES.
References
1. Gómez O, Figueras F, Fernández S, Bennasar M, Martínez JM, Puerto B, et al. (2008) Reference ranges for uterine artery mean pulsatility index at 11–41 weeks of gestation. Ultrasound Obstet Gyne-col. 32:128–32. doi:10.1002/uog.5315PMID:18457355
2. Guedes-Martins L, Cunha A, Saraiva J, Gaio R, Macedo F, Almeida H (2014) Internal iliac and uterine arteries Doppler ultrasound in the assessment of normotensive and chronic hypertensive pregnant women. Sci Rep. 4:3785. doi:10.1038/srep03785PMID:24445576
3. Schulman H, Fleischer A, Farmakides G, Bracero L, Rochelson B, Grunfeld L (1986) Development of uterine artery compliance in pregnancy as detected by Doppler ultrasound. Am J Obstet Gynecol. 155:1031–6. PMID:2946229
4. Guedes-Martins L, Saraiva J, Gaio R, Macedo F, Almeida H (2014) Uterine artery impedance at very early clinical pregnancy. Prenat Diagn. 34:719–25. doi:10.1002/pd.4325PMID:24431243
5. Cnossen JS, Morris RK, ter Riet G, Mol BW, van der Post JA, Coomarasamy A, et al. (2008) Use of uterine artery Doppler ultrasonography to predict pre eclampsia and intrauterine growth restriction: a systematic review and bivariable meta-analysis. CMAJ. 178:701–11. doi:10.1503/cmaj.070430PMID: 18332385
6. Ziegler WF, Bernstein I, Badger G, Leavitt T, Cerrero ML (1999) Regional hemodynamic adaptation during the menstrual cycle. Obstet Gynecol. 94:695–9. PMID:10546712
7. Steer CV, Campbell S, Pampiglione JS, Kingsland CR, Mason BA, Collins WP (1990) Transvaginal col-our flow imaging of the uterine arteries during the ovarian and menstrual cycles. Hum Reprod. 5:391– 5. PMID:2193940
8. Sladkevicius P, Valentin L, Marsál K (1993) Blood flow velocity in the uterine and ovarian arteries during the normal menstrual cycle. Ultrasound Obstet Gynecol. 3:199–208. PMID:12797290
9. Tan SL, Zaidi J, Campbell S, Doyle P, Collins W (1996) Blood flow changes in the ovarian and uterine arteries during the normal menstrual cycle. Am J Obstet Gynecol. 175:625–31. PMID:8828425
11. Jokubkiene L, Sladkevicius P, Rovas L, Valentin L (2006) Assessment of changes in endometrial and subendometrial volume and vascularity during the normal menstrual cycle using three-dimensional power Doppler ultrasound. Ultrasound Obstet Gynecol. 27:672–9. PMID:16676367
12. Ivanovski M, Damcevski N, Radevska B, Doicev G (2012) Assessment of uterine artery and arcuate ar-tery blood flow by transvaginal color Doppler ultrasound on the day of human chorionic gonadotropin administration as predictors of pregnancy in an in vitro fertilization program. Akush Ginekol (Sofiia). 51:55–60.
13. Wang L, Qiao J, Li R, Zhen X, Liu Z (2010) Role of endometrial blood flow assessment with color Dopp-ler energy in predicting pregnancy outcome of IVF-ET cycles. Reprod Biol Endocrinol. 8:122. doi:10. 1186/1477-7827-8-122PMID:20955593
14. Wakeman S, Benny P (2009) Is it possible to predict a fertile cycle? Uteroovarian blood flow parameters in conception versus nonconception cycles. Fertil Steril. 91:2726–31. doi:10.1016/j.fertnstert.2008.03. 069PMID:18672235
15. Yildiz G, Yavuzcan A, Yildiz P, Göynümer G, Yücel N (2012) Effect of uterine artery blood flow on recur-rent pregnancy loss. Clin Exp Obstet Gynecol. 39:326–9. PMID:23157035
16. Steer CV, Williams J, Zaidi J, Campbell S, Tan SL (1995) Intra-observer, interobserver, interultrasound transducer and intercycle variation in colour Doppler assessment of uterine artery impedance. Hum Reprod. 10:479–81. PMID:7769083
17. Chien LW, Lee WS, Au HK, Tzeng CR (2004) Assessment of changes in utero-ovarian arterial imped-ance during the peri-implantation period by Doppler sonography in women undergoing assisted repro-duction. Ultrasound Obstet Gynecol. 23:496–500. PMID:15133803
18. Wahab H, El-Din D, Zain E, Abdelgany M, Youssef M (2001) Uterine artery Doppler and subendometrial blood flow in patients with unexplained recurrent miscarriage. Middle East Fertility Society Journal. 16:209–214.
19. Royston P, Wright EM (1998) How to construct‘normal ranges’for fetal variables. Ultrasound Obstet Gynecol. 11:30–8. PMID:9511193
20. Silverwood RJ, Cole TJ (2007) Statistical methods for constructing gestational age-related reference in-tervals and centile charts for fetal size. Ultrasound Obstet Gynecol. 29:6–13. PMID:17200989
21. Hynek M (2010) Approaches for Constructing Age-Related Reference Intervals and Centile Charts for Fetal Size. Eur J Biomed Inform. 6:43–52.
22. Bland JM, Altman DG (2003) Applying the right statistics: analyses of measurement studies. Ultrasound Obstet Gynecol. 22:85–93. PMID:12858311
23. R Development Core Team. R: A Language and Environment for Statistical Computing. R Foundation for Statistical Computing, Vienna, Austria, 2008. Available athttp://www.R-project.org. Accessed Octo-ber 10, 2013.
24. Papageorghiou AT, To MS, Yu CK, Nicolaides KH (2001) Repeatability of measurement of uterine ar-tery pulsatility index using transvaginal color Doppler. Ultrasound Obstet Gynecol. 18:456–9. PMID: 11844164
25. Jaffa AJ, Weissman A, Har-Toov J, Shoham Z, Peyser RM (1995) Flow velocity waveforms of the uter-ine artery in pregnancy: transvaginal versus transabdominal approach. Gynecol Obstet Invest. 40:80– 3. PMID:8575696
26. Everett TR, Lees CC (2012) Beyond the placental bed: placental and systemic determinants of the uter-ine artery Doppler waveform. Placenta. 33:893–901. doi:10.1016/j.placenta.2012.07.011PMID: 22902007
27. Harrington K, Goldfrad C, Carpenter RG, Campbell S (1997) Transvaginal uterine and umbilical artery Doppler examination of 12–16 weeks and the subsequente development of pre-eclampsia and intra-uterine growth retardation. Ultrasound Obstet Gynecol. 9:94–100. PMID:9132263
28. Park YW, Cho JS, Choi HM, Kim TY, Lee SH, Yu JK, et al. (2000) Clinical significance of early diastolic notch depth: uterine artery Doppler velocimetry in the third trimester. Am J Obstet Gynecol. 182:1204– 9. PMID:10819859
29. Hernandez-Andrade E, Brodszki J, Lingman G, Gudmundsson S, Molin J (2002) Uterine artery score and perinatal outcome. Ultrasound Obstet Gynecol. 19:438–42. PMID:11982974
30. Walter SD, Eliasziw M, Donner A (1998) Sample size and optimal designs for reliability studies. Stat Med 17:101–10. PMID:9463853
31. Altman DG (1993) Construction of age-related reference centiles using absolute residuals. Stat Med. 12: 917–924. PMID:8337548
33. Meyer MC, Cummings K, Osol G (1997) Estrogen replacement attenuates resistance artery adrenergic sensitivity via endothelial vasodilators. Am J Physiol. 272:2264–70.
34. Downing SJ, Porter DG, Redstone CD (1981) Myometrial activity in rats during the oestrous cycle and pseudopregnancy: interaction of oestradiol and progesterone. J Physiol. 317: 425–433. PMID: 7198147
35. Vedernikov YP, Hartke JR, De Long MA, Saade GR, Garfield RE (2003) Sex hormone effects in non-pregnant rat and human myometrium. Eur J Obstet Gynecol Reprod Biol. 108:59–66. PMID:12694972
36. Gordan PL, Jenkins SL, Wentworth RA, Nathanielsz PW (1997) Effect of in vivo estradiol administration to bilaterally ovariectomized rats on in vitro myometrial responsiveness to prostaglandin F2alpha and oxytocin. Biol Reprod. 57:597–601. PMID:9282996
37. Bossmar T, Akerlund M, Szamatowicz J, Laudanski T, Fantoni G, Maggi M (1995) Receptor-mediated uterine effects of vasopressin and oxytocin in nonpregnant women. Br J Obstet Gynaecol. 102:907– 12. PMID:8534628
38. Liedman R, Hansson SR, Howe D, Igidbashian S, Russell RJ, Akerlund M (2008) Endometrial expres-sion of vasopressin, oxytocin and their receptors in patients with primary dysmenorrhoea and healthy volunteers at ovulation. Eur J Obstet Gynecol Reprod Biol 137:189–92. PMID:18082926
39. Groutz A, Wolman I, Jaffa AJ, Lessing JB, Yovel I, Amit A (1997) Influence of ovulation induction with human menopausal gonadotropin on uterine blood flow: comparison of unexplained and mechanical infertility. J Ultrasound Med. 16:455–8. PMID:9315195
40. Serafini P, Batzofin J, Nelson J, Olive D (1994) Sonographic uterine predictors of pregnancy in women undergoing ovulation induction for assisted reproductive treatments. Fertil Steril. 62:815–22. PMID: 7926093
41. Ferreira AM, Pires CR, Moron AF, Araujo Júnior E, Traina E, Mattar R (2007) Doppler assessment of uterine blood flow in recurrent pregnancy loss. Int J Gynaecol Obstet. 98:115–9. PMID:17588574
42. Dechaud H, Bessueille E, Bousquet PJ, Reyftmann L, Hamamah S, Hedon B (2008) Optimal timing of ultrasonographic and Doppler evaluation of uterine receptivity to implantation. Reprod Biomed Online. 16:368–75. PMID:18339259
43. Turan OM, De Paco C, Kametas N, Khaw A, Nicolaides KH (2008) Effect of parity on maternal cardiac function during the first trimester of pregnancy. Ultrasound Obstet Gynecol. 32:849–54. doi:10.1002/ uog.5354PMID:18536067
44. Suzuki S (2006) Influence of parity on second-trimester uterine artery Doppler waveforms in twin preg-nancy. J Matern Fetal Neonatal Med. 19:193–4. PMID:16690514
45. Hafner E, Schuchter K, Metzenbauer M, Philipp K (2000) Uterine artery Doppler perfusion in the first and second pregnancies. Ultrasound Obstet Gynecol. 16:625–9. PMID:11169368
46. Prefumo F, Bhide A, Sairam S, Penna L, Hollis B, Thilaganathan B (2004) Effect of parity on second-tri-mester uterine artery Doppler flow velocity and waveforms. Ultrasound Obstet Gynecol. 23:46–9. PMID:14970999
47. Brosens JJ, Parker MG, McIndoe A, Pijnenborg R, Brosens IA (2009) A role for menstruation in precon-ditioning the uterus for successful pregnancy. Am J Obstet Gynecol. 200:615. doi:10.1016/j.ajog. 2008.11.037PMID:19136085
48. Khong TY, Adema ED, Erwich JJ (2003) On an anatomical basis for the increase in birth weight in sec-ond and subsequent born children. Placenta. 24:348–53. PMID:12657508
49. Arrowsmith S, Robinson H, Noble K, Wray S (2012) What do we know about what happens to myome-trial function as women age? J Muscle Res Cell Motil. 33:209–17. doi:10.1007/s10974-012-9300-2 PMID:22644420
50. Pirhonen J, Bergersen TK, Abdlenoor M, Dubiel M, Gudmundsson S (2005) Effect of maternal age on uterine flow impedance. J Clin Ultrasound. 33:14–7. PMID:15690442
51. Oloyede OA, Iketubosin F (2013) Uterine artery Doppler study in second trimester of pregnancy. Pan Afr Med J. 15:87. doi:10.11604/pamj.2013.15.87.2321PMID:24198883
52. Crawford BS, Davis J, Harrigill K (1997) Uterine artery atherosclerotic disease: histologic features and clinical correlation. Obstet Gynecol. 90:210–5. PMID:9241295