Journal Name
Cite this: DOI: 10.1039/c0xx00000x
www.rsc.org/xxxxxx
Dynamic Article Links
►
ARTICLE TYPE
This journal is © The Royal Society of Chemistry [year] [journal], [year], [vol], 00–00 | 1
The feasibility of wavelength dispersive X-ray fluorescence spectrometry
for the assessment of lead concentration in animal bone powder
José A. A. Brito,* Inês I. B. Cavaleiro, Tânia A. P. Fernandes and Luísa M. L. Gonçalves
Received (in XXX, XXX) Xth XXXXXXXXX 20XX, Accepted Xth XXXXXXXXX 20XX
DOI: 10.1039/b000000x 5
This work demonstrates the feasibility of wavelength dispersive X-ray fluorescence for the assessment of lead in animal bone powder. When applied to real bone samples, this analytical procedure produced results compatible with current knowledge of lead metabolism, emerging as an 10
important tool in the investigation of relevant issues in Public Health.
Introduction
Studies have confirmed that levels of lead (Pb) exposure lower than the present acceptable cutoff points are associated with
15
increased mortality.1 Metabolic modelling of Pb is important to define guidelines for prevention in occupational and environmental exposure to Pb. These models, were developed before large epidemiological data sets including bone Pb were available, and do not reproduce well those data.2 Surveys
20
conducted in occupationally exposed populations provided evidence contrary to assumptions in such models,3 and the call has been issued that these models should be revised with a view to adjusting them to account for kinetic rates varying with age and probably also with exposure level.2,3
25
Lead exposure is also associated with reduced bone mass and quality, which may predispose to osteoporosis,4 a disease with clinical and public health importance due to the associated fractures. At present, the diagnosis of osteoporosis is centered on the assessment of bone mineral density (BMD), typically by
30
single or dual X-ray absorptiometry (DXA).5 However, DXA alone is not optimal to detect people at high risk of fracture and information on validated risk factors other than BMD is necessary; among those, indices of bone turnover have been identified as factors that can enhance the predictive value of
35
BMD.6,7
The relationships between the concentration of Pb in bone and the rate of Pb removal from bone cannot be fully addressed by in vivo bone Pb surveys, because the epidemiological data thus collected would convey information on the co-variation between
40
those biological variables but not on a possible causal relationship between them. Furthermore, nutritional and toxicological studies carried out with single elements might project an inconclusive picture unless the levels of interacting elements in biological tissues are known.8 In sum, it is necessary
45
to establish the relative importance of Pb exposure, and its interactions with other elements, on bone formation and
resorption, as well as the degree to which changes in turnover may account for observed rates of Pb removal from bone tissue.3 Cleary the best means for investigating these relationships is to
50
use an animal model, and the ability to perform multi-element analysis on small samples is an important advantage to accomplish that goal.
Previous research has shown that multi-element energy dispersive X-ray fluorescence determinations in pelletized
55
samples of human hard and soft tissues are feasible and useful when assessing the concentration of an element in an internal organ (eg, bone), based on its concentration in more accessible tissues (eg, hair).9 This, however, requires considerable sample preparation time in cases of high sample throughput and the
60
application of considerable force to compact heterogeneous powder into a pellet sample, which may not be possible in all labs. This paper discusses the feasibility of a wavelength dispersive X-ray fluorescence technique for the rapid assessment of Pb concentrations in powder samples of small animal bones.
65
The focus is on the characteristics for consideration in the validation of an analytical procedure using a commercial 4 kW X-ray fluorescence spectrometer for the purpose of determining Pb in animal bone powder.
The procedures described here are included in a larger research
70
project which aims are: (i) to assess the impact of exposure to Pb on biochemical markers of bone formation and resorption, (ii) to assess the magnitude of Pb uptake and its interactions with other elements in cortical and trabecular bone in healthy animals and animals with altered bone turnover, and (iii) to investigate the
75
elemental concentration profiles in those tissues as tissue predictors for osteoporosis. To the best of the authors’ knowledge, this is the first attempt to address such relationships using this X-ray fluorescence technique.
The authors declare that the animal study included in this
80
research project was approved by the Ethics Committee of the Instituto Superior de Ciências da Saúde Egas Moniz and conducted in accordance with the Portuguese Law.
Materials and methods
Semi-quantitative X-ray fluorescence determinations 85
2 | Journal Name, [year], [vol], 00–00 This journal is © The Royal Society of Chemistry [year]
rats, with the purpose to define a suitable matrix for bone powder samples and a concentration range for Pb in calibration standards. The animals were selected from 3 experimental groups, who had been exposed to known concentrations of Pb in drinking water (50, 200 and 500 ppm) since the age of 6 months, and from one
5
age-matched non-exposed group. Exposure lasted for 6 months and all animals were euthanized by inhalation of 70% CO2. After excision, fresh femora and lumbar vertebrae were prepared in the following sequence: 24-hour ultrasound bath in distilled water, which helped removing most of the remaining soft tissue at bone
10
surface, using a surgical scalpel with stainless steel blade; 24-hour freeze drying, with a multipurpose ice condenser (ModulyoD-230, Thermo Savant) operated at a nominal temperature of -50 C, was used to remove any excess water; and grinding in an agate mortar to reduce the samples to a fine
15
powder.
The semi-quantitative measurements of animal bone powder were performed with a 4 kW commercial wavelength dispersive X-ray fluorescence spectrometer (Bruker S4 Pioneer), using a Rh X-ray tube with a 75 μm Be end window and a 34 mm diameter
20
collimator mask. Measurements were performed with the analytical parameters described in Table 1, in helium mode and using high-density polyethylene X-ray fluorescence sample cups with 35.8 mm diameter assembled with a 4 µm prolene film to support the bone sample. The polyethylene cup was placed in
25
steel sample cup holders with an opening diameter of 34 mm. Bone mass was in the range 1 to 2.2 g for vertebrae and 1 to 1.5 g for femora, which produced samples of bone powder with heights between 1 and 2 mm.
In order to insure reliable matrix corrections, necessary for the
30
closeness of calculated and real Pb concentrations, calcium carbonate (CaCO3) was investigated as a suitable matrix for bone powder samples. This is based on the fact that dry bone is composed mainly by calcium, a major constituent of bone hydroxyapatite crystals [Ca10(PO4)6(OH)2], and by a smaller but
35
non-negligible organic phase containing essentially light elements (C, H and O). Conceivably, the effective atomic number (Zeff) of dry bone powder is slightly lower than that of hydroxyapatite (Zeff = 11.4), and therefore a lighter calcium compound such as CaCO3 (Zeff = 10) seemed to ensure effective matrix corrections in the
40
measurement of bone powder samples. This was confirmed through the evaluation of spectra produced by the X-ray fluorescence measurements of femora and vertebrae bone samples from 48 animals, in which a CaCO3 matrix was assumed after mass correction. This evaluation resulted in estimated ratios
45
of theoretical to measured intensities in the range 0.4 to 0.6, for Compton scattering, and between 0.9 and 1.1, for Rayleigh scattering. Since Compton scattering is more important in light matrices, while Rayleigh scattering is more important in heavy matrices, the fact that Rayleigh ratios are reasonably close to 1
50
supports the hypothesis that CaCO3 appropriately simulates a bone sample matrix and the closeness of the calculated and real Pb concentrations.
An estimate of a suitable concentration range for Pb in calibration standards was made based on the same
semi-55
quantitative X-ray fluorescence measurements. After mass correction, the measured bone Pb concentrations were in the ranges 0 to 250 ppm, in femora, and 0 to 360 ppm, in vertebrae,
Table 1 Analytical parameters in X-ray fluorescence measurementsa,b
Pb x-ray
Rate/ kV mA-1
Filter Collimator/ Crystal Detector
Pb Lα1 60/50 None 0.46 LiF200 SC
Pb Lβ1 60/50 None 0.46 LiF200 SC
a LiF200: lithium fluoride. b SC: scintillation counter. 60
which were used to define the concentrations of Pb in calibration standards in the range 0 to 400 ppm.
Standard preparation and system calibration
For the calibration of the X-ray fluorescence system a set of 9 synthetic standards were prepared in triplicate by doping calcium
65
carbonate with known amounts of lead (II) acetate (C4H6O4Pb.3H2O), according to the following description: 5mL of Milli-Q water and known volumes of a lead (II) acetate solution (100 ppm) were added to 3g of CaCO3; after homogenizing with magnetic stirring, all standards were dried
70
overnight in an oven at 50ºC and then analysed by X-ray fluorescence. The Pb concentrations in standards were: 0, 2, 10, 25, 50, 100, 200, 300 and 400 ppm. Chemicals used in this study were of high analytical grade (> 99%) and were purchased from Sigma-Aldrich and Scharlau Chemie. Previously to its use, all
75
glassware was washed, kept overnight in EDTA solution (0.1M) and rinsed with Milli-Q water.
For calibration purposes, the measurement mode and analytical parameters were as described for the semi-quantitative measurements of bone powder (Table 1). Polyethylene cups and
80
steel cup holders of the type utilized in those measurements were used to irradiate the CaC03 standards. In addition, the net intensities were calculated from peak and background measurements on fixed positions, with sample rotation of 0.5 rev/s: for the Pb Lα1 X-ray, peak intensity was measured at a 2
85
angle of 33.948 while background intensity was measured at 2 angles of 32.924 and 35.007; for the Pb Lβ1 X-ray, peak intensity was measured at a 2 angle of 28.263 with background intensity measured at 2 angles of 27.384 and 29.366. The measurement times were fixed based on measuring scans on
90
multiple standard samples, in order to insure a counting statistical error of not more than 5% for a 3 criterion. This was accomplished with measurement times set at 180 s.
Since the concentration of Pb in samples of animal bone powder can be estimated based on the measured intensity of
95
either the Pb Lα1 or the Pb Lβ1 X-rays, the characteristics for consideration in the validation of the analytical procedure based on each of these X-rays are discussed separately.
Results
Specificity of the method 100
The specificity of the method was investigated through scans of a CaCO3 standard sample doped with 300 ppm Pb (data not shown) and through semi-quantitative measurements of a femur sample from an animal exposed to 500 ppm, using the measurement protocol described above (Table 1). The obtained spectra showed
105
Journal Name
Cite this: DOI: 10.1039/c0xx00000x
www.rsc.org/xxxxxx
Dynamic Article Links
►
ARTICLE TYPE
This journal is © The Royal Society of Chemistry [year] [journal], [year], [vol], 00–00 | 3
Figure 1a) Spectrum of femur sample from one animal exposed to 500 ppm (x-rays reflected by LiF200 crystal)
Figure 1b) Spectrum of femur sample from one animal exposed to 500 ppm (x-rays reflected by PET crystal)
Journal Name
Cite this: DOI: 10.1039/c0xx00000x
www.rsc.org/xxxxxx
Dynamic Article Links
►
ARTICLE TYPE
This journal is © The Royal Society of Chemistry [year] [journal], [year], [vol], 00–00 | 4
no evidence of peak overlaps, which is taken here to demonstrate the method specificity.
Linearity and range
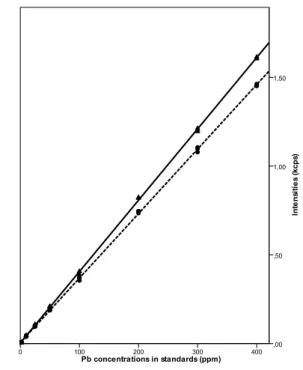
Linear regression models based on the Pb Lα1 and Pb Lβ1 X-ray intensities were fit to the spectral data collected from the
5
measurement of 27 standards with Pb concentrations described above. The fit was obtained using the net intensity model, since no significant peak overlapping was detected. Matrix absorption effects were corrected using the variable alphas method. Regression methods did not discard the null hypothesis of a
10
strong linear association between Pb concentrations and intensities, as suggested by visual inspection of the regression lines depicted in Figure 2. First, correlation coefficients in excess of 0.999 were estimated for both Pb lines. Second, inclusion of a quadratic term representing the squared concentrations in the
15
model did not result in a significant improvement in the models ability to describe the relationship between intensities and concentrations, as the F statistic showed no significant change (p > 0.05). Therefore, the null hypothesis of appropriateness of the linear regression model should not be rejected. In addition,
20
residual analysis did not detect any gross violation of the homoscedasticity assumption for regression analysis. In these conditions, all calculations are based on a full calibration model estimated with the set of 27 standards (Table 2).
25
Figure 2 Calibration lines obtained for the Pb Lα1 (solid line) and Pb Lβ1
peaks (dashed line).
30
Table 2 Calibration models estimated from measurements of 27 standards
Pb x-ray Intercept/kcps Slope/kcps per ppm r RMSa
Pb Lα1 0.00344 ± 0.00202 0.00402 ± 0.00001 0.9999 6.2E-5
Pb Lβ1 0.00537 ± 0.00179 0.00364 ± 0.00001 0.9999 4.9E-5
a RMS: Residual Mean Square.
Detection and quantitation limits
For each Pb peak, the detection limit (DL) of the method was determined as DL = 3.3/S, where is the standard error of the
35
calibration line intercept and S is the slope of the same line (Table 2). The detection limits thus estimated were 1.66 and 1.62 ppm for the analytical models based on the Pb Lα1 and the Pb Lβ1 X-ray, respectively. The quantitation limit (QL) was estimated as QL = 10/S, with and S defined as above, which resulted in QL
40
of 5.0 and 4.9 ppm, for the Pb Lα1 and the Pb Lβ1 analytical models, respectively.
Precision and accuracy
Intra-assay precision was assessed at 3 concentration levels (10, 150 and 250 ppm) for both analytical models, as the coefficient of
45
variation (CV) of 12 repeat measurements. The following CV values for Pb Lα1 and the Pb Lβ1 models, respectively, were estimated: at 10 ppm, 5.0% and 7.6%; at 150 ppm, 0.4% and 0.5%; at 250 ppm, 0.3% and 0.3%.
The accuracy of the proposed method was first assessed as the
50
percent recovery determined by the matrix spike method applied to real bone samples. For that purpose, we have doped 3 femur samples with known amounts of lead (50 ppm) and performed 3 replicate measurements of each of the spiked samples with the proposed method for each of the Pb peaks. The Pb concentrations
55
in the non-spiked samples were 0, 40 and 110 ppm. For the calibration model based on the Pb Lβ1 X-ray, the obtained percent recoveries were in the range 87.0 – 106.5 %, with mean value 97.2 ± 6.2 %, whereas for the Pb Lα1 X-ray, percent recoveries ranged from 104.4 – 114.3%, with mean value 109.5 ± 3.0%,
60
which are well inside the acceptable range.10 Moreover, the accuracy of method was also investigated through to the measurement of the NYS RMs 05-02 through 04 with certified values of 16.1 ± 0.3 (NYS RM 02), 13.2 ± 0.3 (NYS RM 05-03) and 31.5 ± 0.7 (NYS RM 05-04) μg g−1 Pb.11 For the NYS
65
RM 05-02 through 04, respectively, the results obtained were 15.6 ± 1.5, 11.3 ± 1.0 and 31.3 ± 1.2 ppm (Pb Lβ1 X-ray) and 15.3 ± 1.0, 12.0 ± 0.5 and 31.6 ± 1.0 ppm (Pb Lα1 X-ray), showing good agreement with certified values.
The method was applied to femora and vertebrae powder
70
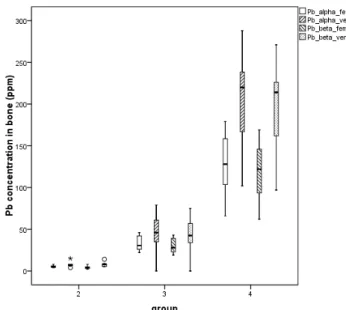
obtained from animals exposed to increasing levels of Pb through drinking water. Regardless of the analytical model considered to estimate bone Pb concentrations, increasing bone Pb concentrations were observed with increasing exposure, which is consistent with current knowledge of Pb metabolism.12 In fact,
This journal is © The Royal Society of Chemistry [year] Journal Name, [year], [vol], 00–00 | 5
non-parametric comparisons between the 3 exposed groups have identified significant differences between the groups (p < 0.001), regardless of the bone site and analytical model (Figure 3). Moreover, higher Pb concentrations were observed in vertebrae than in femora, which is also expected since it reflects the higher
5
metabolic activity of trabecular bone.13
Conclusions
These results show that the proposed analytical procedures based in wavelength dispersive X-ray fluorescence spectrometry possess the necessary degree of linearity, sensitivity, precision
10
and accuracy required for the rapid assessment of Pb concentrations in powders of different types of bone of exposed animals. At this stage, a few points are worth mentioning. First, the uncertainty of the measurement results could be further reduced through the combination of the individual X-ray
15
estimates of Pb concentrations and uncertainties. In effect, following the method implemented in in vivo assessments of Pb in human bone, for example, the inverse variance weighted mean of the concentrations estimated by the Pb Lα1 and the Pb Lβ1 models could have been reported as measurement result, which
20
uncertainty is less than that of the individual estimates of Pb concentrations.14 This can be particularly useful in the assessment of low bone Pb concentrations which quite often show statistical errors higher than 5%. Second, doping powder samples of excised animal bones with known amounts of Pb does not seem
25
to be a process capable of reproducing the routes of entrance of Pb in bones of a living animal. In other words, it is not immediately clear how the process of diffusion from the doping solution to the bone powder would model the incorporation of Pb in the bone matrix during bone formation in a living animal.
30
Notwithstanding these concerns, the matrix spike method applied to samples of animal bone has produced acceptable percent recoveries for the Pb Lα1 and the Pb Lβ1 analytical models. Although there are bone-based Standard Reference Materials (SRM) with certified lead concentrations, these SRMs differ
35
Figure 3 Bone Pb concentrations in femora and vertebrae of animals exposed to increasing Pb levels in drinking water: group 2 (50 ppm),
group 3 (200 ppm), group 4 (500 ppm)
strongly in appearance and composition, with either very high or
40
negligible organic content,11 which are far from the physical attributes of the dry bones analysed in this work. Three of the four candidate ground bone reference materials produced from lead-dosed bovine and caprine sources and characterized by inter-laboratory study were used in this work to assess the accuracy of
45
the method,11 despite the fact that marked interspecies differences with regard to bone composition and bone density have been reported in another study, which concluded that data derived from such standard reference materials should also be considered with utmost care.15 In any case, the results obtained in this work with
50
the measurement of NYS RM 05-02 through 04 show good agreement with the consensus and certified values in the interlaboratory study, despite the differences between the animal sources and the animal model used here.
Finally, the results obtained with the application of the method
55
to animal bone powder samples, which are in close agreement with current knowledge of lead metabolism, particularly in what concerns the expected trends with exposure level and the accumulation patterns in different bone tissues, are reassuring. Altogether, this demonstrates the feasibility of wavelength
60
dispersive X-ray fluorescence spectrometry for the assessment of Pb concentration in animal bone powder, an important asset to the investigation of the role of this element in the aetiology of osteoporosis.
65 a
Instituto Superior de Ciências da Saúde Egas Moniz – Campus
Universitário, Quinta da Granja, 2929-511 Caparica, Portugal. Fax: + 351 212946768; Tel: + 351 212946854; E-mail: [email protected]
Acknowledgements
The authors wish to thank Egas Moniz - Cooperativa de Ensino
70
Superior, CRL, for the financial support, and Instituto Rocha Cabral, for their assistance in the animal experiments.
References
1 A. Rosin, Isr. Med. Assoc. J., 2009, 11, 689.
2 D. E. Fleming, D. R. Chettle, C. E. Webber and E. J. O’Flaherty,
75
Toxicol. Appl. Pharmacol., 1999, 161(1), 100.
3. J. Brito, F. E. McNeill, D. R. Chettle, C. E. Webber, S. Wells and N. Richard, J. Environ. Monit., 2001, 3, 343.
4. A. U. Monir, C. M. Gundberg, S. E. Yagerman, M. C. H. van der Meulen, W. C. Budell, A. L. Boskey et al, Bone, 2010, 47(5), 888.
80
5. J. A. Kanis, Lancet, 2002, 359, 1929.
6. Report on osteoporosis in the European Community - Action for
prevention. European Comission, Luxembourg: Office for Official Publications of the European Communities, 1998.
7. L. A. Fitzpatrick, Mayo Clin. Proc., 2002, 77, 453.
85
8. D. Dhavan, A. Singh, B. Singh, H. K. Bandhu, B. Chand, and N. Singh, BioMetals, 1999, 12, 375.
9. L. Carvalho, J. Brito and M. A. Barreiros, X-Ray Spectrom., 1998, 27, 198.
10. E. Marguí, C. Fontàs, A. Buendía, M. Hidalgo and I. Queralt, J. Anal.
90
At. Spectrom., 2009, 24(9), 1253
11. D. J. Bellis, K. M. Hetter, M. F. Verostek and P. J. Parsons, J. Anal. At. Spectrom., 2008, 23(3), 298.
12. L. Somervaille, U. Nilsson, D. Chettle, I. Tell, M. Scott, A. Schütz et al, Phys. Med. Biol.,1989, 34, 1833.
95
13. R. Leggett, Environ. Health. Perspect., 1993, 101, 598. 14. J. A. A. Brito, Phys. Med. Biol., 2006, 51, 6125.