Article
Printed in Brazil - ©2016 Sociedade Brasileira de Química0103 - 5053 $6.00+0.00*e-mail: [email protected]
Energy Dispersive X-Ray Fluorescence Profile of Some Brazilian Postage Stamps
Nicolas V. Schwab,*,a José Augusto Da-Col,a Peter Meyer,b Maria I. M. S. Buenoa and Marcos N. Eberlina
aInstituto de Química, Universidade Estadual de Campinas, PO BOX 6154,
13085-970 Campinas-SP, Brazil
bRHM Filatelistas, PO BOX 68040, 04045-972 São Paulo-SP, Brazil
An energy dispersive X-ray fluorescence (EDXRF) analysis has been performed on Brazilian postage stamps to understand the elementary profile present in the paper, colored and postmarked areas, of stamps printed between 1850 and 1922. The EDXRF technique offered a fast, simple and nondestructive chemical analysis providing a profile of each postage stamp that provide a valuable data, such as information about raw materials employed in manufacturing process. Furthermore, we extend the methodology to detect counterfeit samples, since that some rare samples can cost fortunes, which naturally leads to cases of forgery in philately.
Keywords: EDXRF, X-ray fluorescence, philately, postage stamps
Introduction
Postage stamps are sometimes very precious piece of paper due to their historical and cultural values. More than a hobby, philately is the act and science of collecting postage stamps, especially those considered rare and is highly appreciated worldwide.1 The history of stamps started in England on May 6, 1840, where the first postage stamp, the Penny Black (one penny black), was produced. The idea came from Sir Rowland Hill, a member of the UK Parliament, who proposed the stamps in order to make the sender pay for the mail fare, to face the problem of a huge number of returns from the recipients, who was supposed to pay for it.2 Today, collections of postage stamps may worth a fortune, and philately is considered by many a financial investment.3
Naturally, forgery is a major concern for philately, and a number of analytical techniques have been used to screen for counterfeiting. Spectroscopy techniques have been preferred due to their non-destructive nature. For instance, Raman spectroscopy was applied for the precious Hawaiian Missionary and Mauritius postal stamps and noted the use of inks and of a pigment to imitate aging.4,5 Iranian postage stamps were also analyzed by micro-particle induced X-ray emission (PIXE) to determine the elemental composition of different papers and inks, which could discriminate between stamps printed in the Netherlands, Austria, France and Iran.6
Fourier transform infrared spectroscopy (FTIR) of postage stamps were also used to develop a database providing a time mapping of the materials employed over 150 years of postage stamps production in Italy and to screen for counterfeit stamps.7
Cesareo and Brunetti8 also demonstrated the applicability of energy dispersive X-ray fluorescence (EDXRF) to analyze the inorganic content of postage stamps. Characteristic pigment profiles were established according to the production time. EDXRF is indeed attractive for stamp profiles since it deals with characteristic X-ray elemental energies and their corresponding intensities emitted by a sample after irradiation with high-energy particles or photons. It provides therefore a nondestructive, multielemental, simple and short time analysis. EDXRF screening has found a large number of applications in many areas such as medicine,9 archeology,10 food,11 cosmetics12 and environmental science.13
In this work, we have evaluated the ability of EDXRF to provide characteristic profile of classical Brazilian postage stamps. Different imprinting, colors and rubbers inks of such stamps were analyzed both authentic and counterfeit samples were investigated.
Experimental
Samples
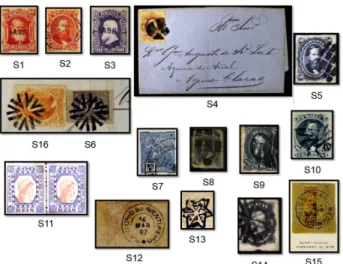
analyzed according with the color of the stamps, nominal value and imprinted data (since 1850-1922) to obtain the elementary profile.
Instrumental conditions
The samples were irradiated for 500 s using either a Shimadzu EDX-700 (Kyoto, Japan) or a µEDX-1300 (Kyoto, Japan) spectrometer. Both instruments basically consist of a Rh target X-ray tube and a Si(Li) detector. The applied voltage for the X-ray tube was 50 kV and the detector dead time 25%. The spectra were sequentially acquired from 0 to 40 keV. The maximum current accepted in the tube can reach 100 µA, but its actual value is regulated by the dead time of the detector, to avoid saturation. The collimator beam was 1 mm for determination of elemental profile and 10 mm in EDX-700 analysis to detected counterfeit samples. Microanalysis (µEDX-1300) were performed over the rubber inks with the collimator regulated at 50 µm.
Principal component analysis (PCA)
For detection of counterfeit rubber stamps postmarked on the stamps, EDXRF spectra of 10 samples (set of 4 authentic and 6 counterfeit postage samples) were used to build the multivariate PCA model. Data was normalized by length in Pirouette® 3.11 (Infometrix Co., Bothell, USA).
Results and Discussion
Elementary profile of postage stamps by EDXRF
Table 1 shows the inorganic profile for the 16 samples irradiated by EDXRF for 500 s with collimated beam at 1 mm. Two different areas from the stamp sample were
targeted: a spot in the ink printed area and another in the blank paper. The original value of each area was used to compare these two regions to reveal an eventual influence of some paper inorganic elements on the ink composition signal. Ink specific profiles can be associated to pigments used at a specific era.
As summarized at Table 1, each blank paper and colored area with either red, green, blue, orange, violet, brown or black inks in the different stamps showed characteristic profiles. For blank paper surface, elements like S, Ca, K, Fe, Cu and Zn were the most usual; K can be directly associated with wood, because this is an essential element for plant development;14 S can come from paper manufacturing; Ca is likely from additives such as calcium carbonate, whereas Fe, Cu and Zn could be attributed to both wood and impurities from manufacturing.15 The red prints in samples S1 and S2, show high intensities of Hg is likely due to the use of the cinnabar pigment (HgS) which was very common at that time;16 On the stamps S4 and S11, Fe and Si were only detected in the red areas and could be attributed to the use of Fe2O3 and silica [(SiO2)n], a natural dye known as red ochre;17 Ba and S could result from BaSO
oxides on their composition.23 Elements such as Ca and Fe were detected on the samples S6 and S14 confirming the use of those pigments.
Counterfeit samples
After the evaluation of the different colored areas composition in the authentic postage stamps (Table 1), their characteristic EDXRF profiles were used to compare with counterfeit pieces. The first example (Figure 2) is from a famous Brazilian stamp, the first bicolor stamps issued in May 1891, which is popularly known as the “Tintureiro” stamp (sample S11).24 The face value of this piece is 100 Réis and the suspect sample displayed the same patterns of blue and red colours as the authentic sample (Figure 2). To have a broader surface coverage and
a single shot analysis, the XRF collimation was increased from 1 to 10 mm. Using a video camera (EyeXRF 2000, Shimadzu Corp., Kyoto, Japan) it was possible to precisely locate the most appropriate region to irradiate each sample in order to collect data from the same drawing and same composition of colors (circled area in Figure 2).
Table 1. X-Ray fluorescence intensities (cps µA–1) of the elements detected by EDXRF on the stamp surfaces
Sample Nominal value
Year of printing
Color area/ blank paper
X-ray fluorescence intensity / (cps µA–1)
S Ca K Fe Zn Cu Ba Pb Hg Mn Cr Si Sr
S1 10 Réis 1878 Red 29.0 15.6 – 42.3 – – 9.3 13.7 501 – – – –
Paper – 2.7 1.8 5.4 3.5 – – 2.4 2.9 – – – –
S2 10 Réis 1866 Red 34.9 13.6 – 47.2 116.8 – – – 629.0 – – – –
Paper – 4.5 – 5.0 15.8 – – – – – – – –
S3 20 Réis 1878 Violet 23.0 40.0 – 7.8 76.1 – 35.6 239.5 – – – – 6.3
Paper 1.0 7.0 2.7 9.3 7.3 – – 2.7 – – – – –
S4 20 Réis 1866 Dark Red 18.9 47.0 – 118.6 225.6 5.9 45.6 169.7 – – – 1.1 12.1
Paper – 6.5 3.0 72.2 4.3 7.7 – – – – – – –
S5 50 Réis 1876 Blue 20.5 43.6 – 13.17 – – 30.2 210.1 – – – – –
Paper – 0.7 1.9 1.1 – – – – – – – – –
S6 60 Réis 1850 Black 5.5 112.4 – 12.5 – – – 8.9 – – – – –
Paper 2.2 15.7 1.9 8.8 – – – – – – – – –
S7 80 Réis 1922 Green 2.3 7.1 6.4 40.0 21.5 3.3 2.0 11.3 – 1.0 4.8 0.8 –
Paper 0.8 8.7 6.9 22.4 – 2.5 – – – 1.0 – 1.0 –
S8 100 Réis 1881 Light Green – 3.8 5.9 181.1 59.3 – 12.3 3.7 – – – 2.3 –
Paper – 2.4 8.0 24.0 2.1 1.7 3.6 – – – – 1.7 –
S9 100 Réis 1878 Green 23.6 36.5 – 56.4 – – 91.4 208.3 – – 38.6 – 12.2
Paper – 2.7 2.7 4.6 – – – – – – – – –
S10 100 Réis 1866 Green 15.6 17.7 – 43.0 14.1 – 58.5 123.5 – 5.4 4.5 – 5.5
Paper – 4.8 1.6 6.1 6.1 – – 4.8 – – – – –
S11 100 Réis 1891
Blue 4.4 7.1 12.1 34.3 1.6 – 1.4 – – 1.3 – 1.8 –
Light Red 1.4 6.5 9.9 31.9 – – 7.7 – – – – 1.4 –
Paper – 6.2 10.9 31.6 – 1.5 – – – 1.2 – – –
S12 200 Réis 1882 Light Brown – 21.0 9.6 65.3 4.1 3.3 8.6 – – – – – 6.1
Paper – 12.9 8.5 23.4 2.3 2.4 – – – – – 1.3 –
S13 200 Réis 1882 Light Orange – 4.2 12.1 12.5 0.6 – – – – – – 70.5 –
Paper – 2.6 7.4 4.7 – – – – – – – 40.2 –
S14 200 Réis 1876 Black 0.7 49.6 – 47.4 4.1 – 5.4 8.8 – – – – –
Paper – 0.7 – 1 0.6 – – 1.6 – – – – –
S15 300 Réis 1877 Brown 26.0 59.4 – 174.7 – – 53.8 288.3 – 21.7 60.0 – –
Paper 1.0 6.2 1.6 20.0 – 5.7 – – – – – – –
S16 500 Réis 1866 Orange 8.1 2.1 – 1.4 – – 8.4 51.7 26 – 2.3 – –
Paper 0.9 8.9 1.8 9.5 – 3.0 – – – – – – –
Figure 3 compares the EDXRF spectra for both samples; with very distinct and characteristic profiles. For the suspect sample, the absence of signal for metals such as Ba and Si, as well as changes in peak intensities for Cu, Zn and, particularly, Fe, characterizes it as a counterfeit sample. Such differences in elemental composition can be related with probably the contemporary preparation of the counterfeit sample using organic pigments and different manufacturing of cellulose paper. The slightly higher intensity of the Rh X-ray scattering peaks around 20 keV indeed indicates higher contents of organic pigments leading to light elements in the matrix, such C, H, N and O (Z < 23) for the counterfeit sample.
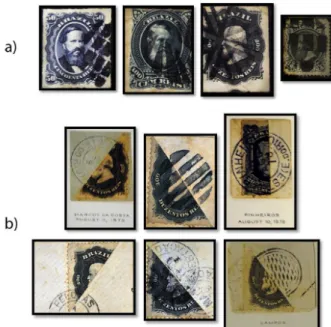
The next case was for postage stamps series called “Vovó” produced in Brazil in 1922, with face values of 80 Réis and green color (sample S7).24 Figures 4a and 4b show pictures of two authentic samples and Figure 4c for a suspected stamp. To the naked eye, the suspected sample does look quite similarly. Under EDXRF screening, however, a difference in the profiles was observed (Figure 5).
Figure 5 shows that major elements such as Cr, Ba and Pb is absent in the counterfeit stamp, meanwhile for the authentic samples characteristic elements of the green color, as already discussed, such as Cr and
Ba are detected as important peaks. Even with the differences between the intensities of the elements in the authentic postage stamps as observed in the spectrum, these samples have the same elements in common. Factors such as lixiviation processes, preparation of the ink, among others, may be cause of this difference.
EDXRF profile has also been tested for the evaluation of rubber stamps postmarked over the samples. Depending on the city or type of rubber stamped on surface of the piece, a sample can reach higher commercial values as the non-rubber stamped pieces. To investigate the rubber stamps, we performed direct analysis using a micro-EDXRF spectrometer for better spatial resolution allowing only the ink of the rubber stamp on paper to be screened. Emissions from the blank paper region on the stamp surface were subtracted. Figure 6 shows two sets
Figure 5. Overlapped EDXRF spectrum of authentic and counterfeit
irradiated samples of “Vovó” stamps.
Figure 6. Set of authentic (a) and counterfeit (b) rubber stamped samples.
Figure 4. Pictures of authentic (a and b) and suspected counterfeiting (c) samples of 80 Réis “Vovó” stamps.
Figure 3. Overlapped EDXRF spectrum of authentic and counterfeit
of samples: one is constituted by four authentic rubber stamped samples the other set for samples identified by an expert as counterfeit.
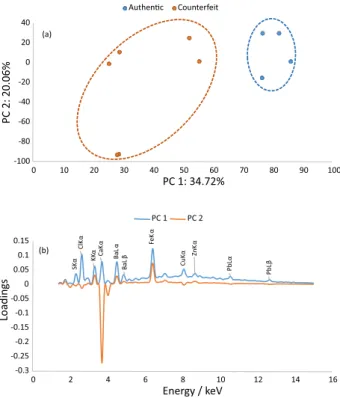
PCA exploratory analysis was also performed to facilitate discrimination. The spectra were normalized (length = 1) and the number of PC’s was given by the amount of information set for the model. Two PC’s were chosen with total variance of 54.78%. Despite its not being too high was enough to create two distinct groups between authentic and counterfeit pieces (Figure 7a). This kind of result is consistent with a small set of samples, which is justified by the rarity of the specimens studied. The loading plot (Figure 7b) explains that the influence of each element detected by micro-EDXRF (like Cl, Ca, Ba and Fe) on the ink composition are prevalent in the authentic samples and contribute to discriminate between the groups. The perfect match of the EDXRF profile combined with PCA analysis seems therefore to indicate that it may function as a relatively easy non-destructive protocol to confirm the authenticity of rubber-stamped samples.
Conclusion
EDXRF has been shown to provide a powerful technique to perform profile evaluation of stamps, under specific circumstances, with invaluable applications in many areas of philately. The technique provides a characteristic pool of elements present either in the paper
or colored regions, as well as for rubbers stamps, offering fast, simple and nondestructive chemical analysis that can nicely complement morphological inspections by experts.
Acknowledgments
The authors thanks to CAPES and FAPESP foundation for supporting this research.
References
1. http://exame.abril.com.br/seu-dinheiro/noticias/10-selos-postais-raros-que-so-milionarios-podem-comprar accessed in January 2016.
2. Ferreira, L. E.; A Certain Look at Philately: 2nd ed.; Edições
Húmus Ldta; Vila Nova de Famalicão, 2006.
3. http://www.bbc.co.uk/news/10142014 accessed in January 2015.
4. Chaplin, T. D.; Clark, R. J. H.; Beech, D. R.; J. Raman Spectrosc.
2002, 33, 424.
5. Chaplin, T. D.; Jurado-López, A.; Clark, R. J. H.; Beech, D. R.;
J. Raman Spectrosc. 2004, 35, 600.
6. Oliaiy, P.; Agha-Aligol, D.; Shokouhi, F.; Lamehi-Rachti, M.;
X-Ray Spectrosc.2009, 38, 479.
7. Imperio, E.; Giancane, G.; Valli, L.; Anal. Chem.2013, 85, 7085.
8. Cesareo, R.; Brunetti, A.; X-Ray Spectrosc. 2008, 37, 260. 9. Farquharson, M. J.; Al-Ebraheem, A.; Cornacchi, S.; Gohla,
G.; Lovrics, P.; X-Ray Spectrosc.2013, 42, 349.
10. Vornicu, N.; Bibire, C.; Murariu, E.; Ivanov, D.; X-Ray Spectrosc.2013, 42, 380.
11. Da-Col, J. A.; Bueno, M. I. M.; Melquiades, F. L.; J. Agric. Food Chem.2015, 63, 2406.
12. Shimamoto, G. G.; Terra, J.; Bueno, M. I. M. S.; J. Braz. Chem. Soc.2013, 24, 731.
13. Fittschen, U. E. A.; Streli, C.; Meirer, F.; Alfeld, M.; X-Ray Spectrosc. 2013, 42, 368.
14. Erich, M. S.; J. Environ. Qual. 1991,20, 576.
15. Victor, F. H.; In Determination of Trace Elements in Paper by Energy Dispersive X-Ray Fluorescence; Willians, J. C., ed.; American Chemical Society: Washington, 1981.
16. Nöller, R.; Stud. Conserv.2015, 60, 2015.
17. Elias, M.; Chartier, C.; Prevot, G.; Garay, H.; Vignaud, C.; Mat. Sci. Eng.: B 2006, 127, 70.
18. Ash, M.; Ash, I.; Handbook of Fillers, Extenders, and Diluents, 2nd ed.; Synapse Information Resources: New York, 2007.
19. http://www.webexhibits.org/pigments/indiv/overview/ leadwhite.html accessed in January 2016.
20. http://www.webexhibits.org/pigments/indiv/recipe/prussblue. html accessed in January 2016.
21. http://www.webexhibits.org/pigments/indiv/overview/viridian. html accessed in January 2016.
22. http://www.webexhibits.org/pigments/indiv/overview/crorange. html accessed in January 2016.
23. Orlandini, V.; The Book and Paper Group Annual 28: Effect of Aqueous Treatments on Nineteenth-Century Iron-Gall-Ink
Documents: Calcium Phytate Treatment - Optimization of
Existing Protocols; Book and Paper Group: West Virginia, 2009.
24. Meyer, P.; Catálogo de Selos do Brasil 2008, 56a ed.; RHM
Ltda: São Paulo, 2008.
Submitted: November 24, 2015
Published online: January 29, 2016