Cop
yright
© ABE&M t
odos os dir
eit
os r
eser
vados
.
Are skeletally mature female rats a
suitable model to study osteoporosis?
Ratas esqueleticamente maduras são um modelo satisfatório para estudar osteoporose?
Claudia Cardoso Netto1, Vivian Cristine Correia Vieira1,
Lizanka Paola Figueiredo Marinheiro2, Sherry Agellon3,
Hope Weiler3, Mário Roberto Maróstica Jr.1
ABSTRACT
Objective: To analyze if female Wistar rats at 56 weeks of age are a suitable model to study os-teoporosis. Materials and methods: Female rats with 6 and 36 weeks of age (n = 8 per group) were kept over a 20-week period and fed a diet for mature rodents complete in terms of Ca, phosphorous, and vitamin D. Excised femurs were measured for bone mass using dual-energy x-ray absorptiometry, morphometry, and biomechanical properties. The following serum mar-kers of bone metabolism were analyzed: parathyroid hormone (PTH), osteocalcin (OC), osteo-protegerin (OPG), receptor activator of nuclear factor κappa B ligand (RANKL), C-terminal pep-tides of type I collagen (CTX-I), total calcium, and alkaline phosphatase (ALP) activity. Results: Rats at 56 weeks of age showed important bone metabolism differences when compared with the younger group, such as, highest diaphysis energy to failure, lowest levels of OC, CTX-I, and ALP, and elevated PTH, even with adequate dietary Ca. Conclusion: Rats at 26-week-old rats may be too young to study age-related bone loss, whereas the 56-week-old rats may be good models to represent the early stages of age-related changes in bone metabolism. Arq Bras Endocrinol Metab. 2012;56(4):259-64
Keywords
Aging; bone metabolism; osteoporosis; menopause
RESUMO
Objetivo: Avaliar se ratas Wistar com 56 semanas de idade são um modelo satisfatório para es-tudar osteoporose. Materiais e métodos: Ratas com 6 e 36 semanas de idade (n = 8 por grupo) foram criadas por um período de 20 semanas e alimentadas com dieta completa em Ca, fósforo e vitamina D para ratas adultas. Os fêmures foram analisados quanto à massa óssea pela téc-nica de absortiometria por dupla fonte de raios-X, morfometria e propriedades biomecâtéc-nicas; os marcadores séricos do metabolismo ósseo analisados foram paratormônio (PTH), osteocal-cina (OC), osteoprotegerina (OPG), fator receptor ativador nuclear κappa B ligante (RANKL), peptídeos C-terminal de colágeno tipo I (CTX-I), cálcio total e atividade da fosfatase alcalina (FA). Resultados: As ratas com 56 semanas de vida apresentaram uma importante diferença no metabolismo ósseo quando comparadas ao grupo das ratas jovens, como, por exemplo, maior energia para quebrar a diáise do fêmur, menores níveis de OC, CTX-I e ALP e maiores níveis de PTH mesmo com dieta adequada em cálcio. Conclusão: As ratas com 26 semanas de vida podem ser consideradas muito jovens para estudar a perda óssea relacionada à idade, porém, as ratas com 56 semanas de vida podem representar um bom modelo dos estágios iniciais das alterações associadas à idade no metabolismo ósseo. Arq Bras Endocrinol Metab. 2012;56(4):259-64
Descritores
Envelhecimento; metabolismo ósseo; osteoporose; menopausa
1 Food and Nutrition Department, Food and Engineering College, Universidade Estadual de Campinas (Unicamp), Campinas, SP, Brasil 2 Gynecology Department, Fernandes Figueira Institute, Rio de Janeiro, RJ, Brazil 3 School of Dietetics and Human Nutrition, McGill University Montreal, QC, Canada
Correspondence to:
Claudia Cardoso Netto PO Box 6121, Universidade Estadual de Campinas, 13083-970, Campinas, SP, Brazil [email protected]
Cop
yright
© ABE&M t
odos os dir
eit
os r
eser
vados
.
INTRODUCTION
L
ife expectancy in industrialized nations continues to increase, raising concerns over various health is sues related to aging. It is estimated that, in the next 30 years, the proportion of people over the age of 65 years will double from 12% to 22%25% of the population in the USA and Canada (1). Similarly, in Europe, it is es timated that this age group exceeds one in every thou sand people, and will grow from 21.4 million in year 2000 to 35.7 million in year 2025. The most dramatic population growth is in the oldest age group, over 80 years of age, and is mainly represented by women. In Europe, for example, there are 15.2 million women aged 80 years old and above, compared with only 6.2 million men; this age group has virtually doubled from 7.2 million women and 3.3 million men since 1970 (2).Estrogen metabolism is extremely important for the regulation of bone metabolism (3,4). With the aging of the female population around the world, and conse quently prolonged deiciency of this hormone with me nopause, the prevalence of osteopenia and osteoporosis is expected to increase markedly (2). Owing to the rapid decline in estrogen with menopause, rates of bone loss accelerate during menopausal years, resulting in accele rated rates of osteoporosis. After the menopausal years, the rate of bone loss in women slows slightly and beco mes more comparable with that seen in older men (5).
According to a WHO Study Group, by the age of 75 years, approximately 30% of Caucasian women may be classiied as having osteoporosis. This is related to declining BMD at the femoral neck, which is predictive of fractures with severe clinical consequences (1,2).
The rat is commonly used in osteoporosis research. In comparison with human studies, rat studies are easily controlled, provide rapid results due to the short life span of the animals, and enable access to the skeleton. The adult rat skeleton has many similarities with the human skeleton. The long bones of both species elon gate by epiphyseal growth (endochondral ossiication) and increase in crosssectional area by periosteal gro wth (secondary intramembranous ossiication). Radial growth slows to very low rates in adult rats, as it does in humans. The secondary spongiosa in rats undergoes sequential remodeling, similar to that observed in hu man cancellous bone (6).
Despite the similarity between human and rat bone metabolism, studies to prevent, manage, and analyze osteopenia and osteoporosis mechanisms have focused
heavily on the relatively young ovariectomized (OVX) rat model (7,8), rather than aged or skeletally mature female rats. Thus, the objective of this study was to analyze if skeletally mature female Wistar rats at 56 weeks of age are suitable models to study natural oste oporosis caused by aging.
MATERIALS AND METHODS
Animals and diets
Female Wistar rats at 6 and 36 weeks of age (n = 8 per group), weighing approximately 250 g and 350 g, respectively, were obtained from the Multidisciplinary Center for Biological Research at the Universidade Es tadual de Campinas (Unicamp, Campinas, São Paulo, Brazil). Animals were housed individually in stainless steel hanging cages at controlled temperature (21 24˚C) and humidity (55%), and with a 12:12h light:dark cycle throughout the study. Animals were kept over a 20week period, during which they were fed ad libitum
a nutritionally complete diet for mature rodents based on the AIN93M formulation (9), containing the re commended amounts of Ca (5 g/kg of diet), phospho rous (3 g/kg of diet), and vitamin D (1000 U/kg of diet, Table 1). At the end of the study, animals were 26 (n = 8) and 56 (n = 8) weeks of age. The protocol of this study was approved by Animal Experimental Ethics Committee of the Universidade Estadual de Campinas.
Tissue collection
All animals were killed by decapitation, and trunk blood samples were collected and stored on ice until
Table 1. Diets formulated based on the AIN-93M (9)
Ingredients (g/kg of diet)
Cornstarch 465.692
Casein (≥ 85% protein) 140.000
Dextrinized cornstarch (90%-94% tetrasaccharides) 155.000
Sucrose 100.000
Soybean oil 40.000
Cellulose 50.000
Mineral mix (AIN-93M-MX) 35.000
Vitamin mix (AIN-93-VX) 10.000
L-Cystine 1.800
Choline bitartrate (41.1% choline) 2.500
Cop
yright
© ABE&M t
odos os dir
eit
os r
eser
vados
.
they were centrifuged to obtain serum (3,000 rpm/10 min; FANEM Excelsa Baby I – model 206/São Pau lo – Brazil). Serum samples were stored at 80˚C un til analysis. Femur and tibia were excised and stored at 20˚C until analysis.
Dual-energy x-ray absorptiometry scans (DXA)
The right femur (whole femur, hip axis, and diaphysis) was scanned for bone area (BA), bone mineral content (BMC), and bone mineral density (BMD) in a water bath using DXA (4500A; Hologic Inc., Bedford, MA, USA; small animal software in high resolution mode QDR 12.3) (10). Precision errors (%) for triplicate scans of BA, BMC, and BMD were 25.6, 24.3, and 6.1, respectively, for the whole femur; 6.1, 6.2, and 6.0, respectively, for the hip axis; and, 3.9, 4.7, and 5.6, res pectively, for the femur diaphysis.
Bone morphometry
After DXA analysis, right and left femurs were thorou ghly cleaned of soft tissue. Morphometric measures were taken with a digital caliper, as described elsewhere (10), and recorded to the nearest 0.01 mm. All measu res were recorded in triplicate by the same trained exa miner, and included length, and head, neck, hip axis, diaphysis, and distal epiphysis width.
Biomechanical properties
The right femur diaphysis was selected to represent cor tical bone, which is known as a site of bone loss caused by aging (11). Biomechanical properties included ener gy to failure (N), maximum load (N), resilience (x103J),
and stiffness (x103 N/m). Tests were conducted using
a threepoint bending rheolometer (Hydraulic Equip ment Service, INC.; 810 TestStar II MTS; Houston, Texas/USA), as described elsewhere (8). Measurement conditions were the following: sample space, 18 mm; plunger speed, 2 mm/min; and load range, 100 kN.
Serum markers of bone metabolism
Serum parathyroid hormone (PTH), osteocalcin (OC), osteoprotegerin (OPG), receptor activator of nuclear factor κappa B ligand (RANKL), and Cterminal pepti des of type I collagen (CTXI) were measured by enzy melinked immunosorbent assays speciic for rats (Rat Bone Panel 3 – PTH and Osteocalcin; Rat Bone Pa nel 1 – osteoprotegerin; Rat Bone Panel 2 – RANKL, Millipore, Massachusetts, USA; CTXI of the Immu
nodiagnostic Systems Ltd., Arizona, USA). Serum total calcium and alkaline phosphatase (ALP) activity were measured by colorimetric method (Calcium CAT no. 00800, Laborlab – São Paulo/Brazil; alkaline phospha tase activity LB 170123800, Biodiagnostic – Paraná/ Brazil) in Beckman Coulter DU70 spectrophotometer (Beckman Coulter Inc., California, USA).
All biochemical assays were performed according to the manufacturer’s instructions, in duplicate. Assay sensitivity, and intraassay and interassay coeficient of variation (% CV) were respectively: PTH = 0.3 pg/mL, 3.5% CV and 8.1% CV; OC = 1.6 pg/mL, 2.9% CV and 4.6% CV; OPG = 2.3 pg/mL, 3.1% CV and 3.4% CV; RANKL = 1.1 pg/mL, 3.1% CV and 9.0 %CV; CTXI = 2 ng/mL, 5.6% CV and 10.5% CV, ALP = 24 U/I, 1.2% CV and 0.99% CV.
Statistical methods
Differences between age groups were tested using Student’s ttest. Criteria of normal and equal variances between groups were met with a level of signiicance of 0.05, using GraphPad Prism 5.0 (GraphPad, Inc.; La Jolla, CA, USA). All data are recorded as means and standard errors of the mean (SEM).
RESULTS
Feed intake and body weight
Body weight was greater (p< 0.05) in the female rats at 56 weeks of age than at 26 weeks of age (233.5 ± 2.5 g
vs. 333.9 ± 0.9 g) upon arrival at the facility. Daily feed in
take during the experiment was not different between age groups (26 weeks: 15.2 ± 0.6 g; 56 weeks: 15.6 ± 0.6 g).
Bone mass (DXA) and morphometry
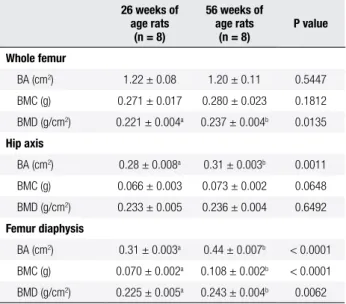
Femur diaphysis BA, BMC and BMD, whole femur BMD, hip axis BA, and femur wet weight, length, and head, diaphysis, and distal epiphysis width results were greater (p< 0.05) for female rats at 56 weeks of age than for female rats at 26 weeks of age (Tables 2 and 3). Ho wever, hip axis BMC and BMD, and neck and hip axis widths were not different (p > 0.05) between age groups.
Biomechanics properties
Cop
yright
© ABE&M t
odos os dir
eit
os r
eser
vados
.
Table 2. Bone area (BA), mineral content (BMC), and bone mineral density (BMD) of femur and mandible of female rats at 26 and 56 weeks of age
26 weeks of age rats
(n = 8)
56 weeks of age rats
(n = 8)
P value
Whole femur
BA (cm2) 1.22 ± 0.08 1.20 ± 0.11 0.5447
BMC (g) 0.271 ± 0.017 0.280 ± 0.023 0.1812
BMD (g/cm2) 0.221 ± 0.004a 0.237 ± 0.004b 0.0135
Hip axis
BA (cm2) 0.28 ± 0.008a 0.31 ± 0.003b 0.0011
BMC (g) 0.066 ± 0.003 0.073 ± 0.002 0.0648
BMD (g/cm2) 0.233 ± 0.005 0.236 ± 0.004 0.6492
Femur diaphysis
BA (cm2) 0.31 ± 0.003a 0.44 ± 0.007b < 0.0001
BMC (g) 0.070 ± 0.002a 0.108 ± 0.002b < 0.0001
BMD (g/cm2) 0.225 ± 0.005a 0.243 ± 0.004b 0.0062
Data are presented as means (SEM). BA: bone area; BMC: bone mineral content; BMD: bone mineral density. Within rows, values with different letters indicate signiicant differences (p < 0.05) between the age groups.
Table 3. Morphometry measurements of femur and mandible of female rats 26 and 56 weeks of age
Measurements
26 weeks of age rats
(n = 8)
56 weeks of age rats
(n = 8)
P value
Wet weight (mg) 488.4 ± 16.0a 690.3 ± 6.7b < 0.0001
Length (mm) 30.3 ± 0.2a 33.8 ± 0.2b < 0.0001
Head (mm) 3.55 ± 0.09a 3.82 ± 0.04b 0.0101
Neck (mm) 2.03 ± 0.04 2.06 ± 0.02 0.4630
Hip axis (mm) 7.45 ± 0.05 7.65 ± 0.09 0.0632
Diaphysis region (mm) 3.67 ± 0.09a 4.27 ± 0.04b < 0.0001
Distal epiphysis region (mm)
5.40 ± 0.05a 5.59 ± 0.05b 0.0164
Data are presented as means (SEM). Within rows, values with different letters indicate signiicant differences (p < 0.05) between the age groups.
Table 4. Biomechanical properties of femurs of female rats 26 and 56 weeks of age
26 weeks of age rats
(n = 8)
56 weeks of age rats
(n = 8)
P value
Energy to failure (N) 87.3 ± 1.7a 81.3 ± 0.8b 0.0051
Maximum load (N) 95.3 ± 1.2 93.8 ± 1.1 0.3850
Resilience (x10-3J) 12.3 ± 0.7 11.6 ± 1.3 0.6757
Stiffness (x103 N/m) 330.4 ± 16.6 319.1 ± 36.3 0.5357
Data are presented as means (SEM). Within rows, values with different letters indicate signiicant differences (p < 0.05) between the age groups.
Table 5. Serum markers of bone metabolism of female rats at 26 and 56 weeks of age
Serum markers
26 weeks of age rats
(n = 8)
56 weeks of age rats
(n = 8)
P value
PTH (pg/mL) 2.47 ± 0.30a 6.56 ± 0.57b < 0.0001
OC (ng/mL) 4.12 ± 0.38a 2.82 ± 0.36b 0.0275
CTX-I (ng/mL) 25.12 ± 1.86a 11.98 ± 0.50b < 0.0001
ALP (U/L) 70.56 ± 8.14a 46.22 ± 7.61b 0.0464
OPG (ng/mL) 0.39 ± 0.06a 3.03 ± 0.57b 0.0004
RANKL (pg/mL) 57.55 ± 4.31 80.63 ± 23.75 0.3551
Calcium (mg/dL) 9.66 ± 0.44 8.77 ± 0.25 0.1123
Data are presented as means (SEM). PTH: parathyroid hormone; OC: osteocalcin; OPG: osteoprotegerin; RANKL: receptor activator of nuclear factor κappa B ligand; CTX-I: bone-related degradation products of C-terminal peptides of type I collagen; ALP: alkaline phosphatase (ALP) activity. Within rows, values with different letters indicate signiicant differences (p < 0.05) between the age groups.
Serum markers of bone metabolism
Serum PTH and OPG concentrations were greater (p< 0.05) in rats at 56 weeks of age, and serum OC, CTX I, and ALP activity were lower (p < 0.05) in the same
animals; serum RANKL concentration, and serum to tal calcium were not different (p > 0.05) between the
groups (Table 5).
DISCUSSION
By examining our DXA and morphometry bone re sults, we can suggest that rats at 56 weeks of age did not show aged cortical and cancellous bone depletion. Kiebzak and cols. (12) evaluated cortical (femur mi dshaft tissue area) and trabecular (femur distal meta physis tissue area) bone BMC and BMD of young (24 weeks of age), mature adult (48 weeks of age), and se nescent (96 weeks of age) male and female rats. These investigators also concluded that cortical and trabe cular bone BMC and BMD, and width of the femur increased progressively with advancing age. However, maximum BMD was found in mature adult rats (48 weeks of aged), and this value decreased slightly only in femurs of senescent rats (96 weeks of age). Li and cols. (13) showed that SpragueDawley female rats also began to show decreased cancellous bone (metaphysis tissue area) at 48 weeks of age.
Cop
yright
© ABE&M t
odos os dir
eit
os r
eser
vados
.
without major repercussions on BMD, could account for the modiications in bone strength. The cortical sheath is connected to cancellous bone and consists of interconnected rods and plates. This structure maximi zes strength, while minimizing weight. Loss in structu re occurs with advancing age, and rates of fracture also increase markedly with age. Thus, this result is extre mely important because early osteoporosis is not usually diagnosed and remains asymptomatic; it does not beco me clinically evident until fractures occur, giving rise to signiicant morbidity and some mortality (2).
As for biochemical results, serum PTH was greater (p< 0.05) in rats at 56 weeks of age. This hormone is associated with increased bone resorption: typically, osteoblasts and osteoclasts cells respond to serum PTH elevation, with the net result being increased bone re sorption and rapid release of Ca2+ from the bone ma
trix (16,17). Lips (18) and Mosekilde (19) described that upregulation of serum PTH is directly related with aging in mammals. Kiebzak and cols. (20) did not show agerelated increases in PTH levels of female rats at 24, 48 and 96 weeks of age; however, immunoreactive PTH titers were slightly, but signiicantly, elevated when the data were analyzed by linear regression. In humans, Sa raiva and cols. (21) evaluated the PTH levels in 177 inpatients (125 women and 52 men) with 76.6 ± 9.0 years of age, and 243 outpatients (168 women and 75 men) with 79.1 ± 5.9 years of age; these investigators showed PTH levels corresponding to secondary hyper parathyroidism in 61.7% of the inpatients and in 54% of the outpatients. Russo and cols. (22) also showed PTH levels as secondary hyperparathyroidism in 8% of post menopausal women (n = 251) between 5085 years of age. Saraiva and cols. (21) and Russo and cols. (22) did not show correlations between serum PTH and vitamin D (25OHD) levels. In our study, animals were fed a diet adequate in vitamin D that would support normal PTH metabolism.
Serum OPG level was also increased in rats at 56 weeks of age. This result is supported by Khosla and cols. (24), who measured serum OPG levels in an age stratiied, random sample of men (n = 346 age range, 23 90 years) and women (n = 304; age range 2193 years), and showed that serum OPG levels increased with age in both men and women (171 ± 6 pg/mL; 134 ± 6 pg/mL, respectively). These investigators associated this agerelated OPG elevation as a compensatory phe nomenon to slow down enhanced bone resorption. Probably, this compensatory phenomenon occurs be
cause OPG is a soluble factor produced by osteoblastic cells and it is considered a decoy receptor for RANKL. Indeed, OPG blocks the interaction between RANKL and RANK, inhibiting the terminal stage of osteoclas tic differentiation, and then inhibiting bone resorption. Furthermore, the inhibitory effect of OPG on bone re sorption can be explained not only as a decoy receptor function, but also as a modulator of RANKL halflife. In turn, RANKL controls the bioavailability of OPG and its internalization and degradation (25). In our study, serum RANKL level did not show agerelated difference. However, Norian and cols. (26) described that RANKL may be a reliable metabolite that shows the state of bone metabolism only in the premenopau sal period.
In this study, serum calcium concentration did not show agerelated reductions. It is important to distin guish this model from humans in that rats were fed a nutritionally complete diet throughout aging, providing ample amounts of calcium to sustain calcium balance (9). Kiebzak and cols. (20) did not show agerelated reductions on serum calcium concentration in female rats with 24, 48 and 96 weeks of age, either, using ani mals that were also fed a diet adequate in calcium. In addition, Takada and cols. (23) described that serum calcium concentration changes only in a critical situa tion, such as undernutrition or hyperparathyroidism.
Serum OC, CTXI, and ALP bone markers were lower with aging in this study. OC and CTXI is a biomar ker of bone formation and degradation, respec tively, and ALP is produced by osteoblasts and is pro portional to bone remodeling rates (27). As the main tenance of bone mass depends on the balance between bone formation and bone resorption, these results sug gest that the bone remodeling slows with aging in this rat model. Kiebzak and cols. (20) showed that serum OC decreased progressively from 24 to 48 weeks of age (21%) and from 48 to 96 weeks of age (23%) in female rats; however, these investigators did not show total se rum alkaline phosphatase activity alteration with aging in the same female rats. Iida and Fukuda (28) showed decreased in the total ALP activity up to 36 weeks of age in Wistar female and male rats.
Cop
yright
© ABE&M t
odos os dir
eit
os r
eser
vados
.
differences when compared with the younger group; the physiological response to any intervention is likely to be different as well. For example, highest diaphy sis energy to failure, lowest levels of OC, CTXI, and ALP, and elevated PTH even with adequate dietary Ca might attenuate response to interventions designed to limit agerelated bone loss. Additionally, 26weekold rats may be too young to study agerelated bone loss, whereas the 56weekold rat may be a good model to represent the early stages of agerelated changes in bones.
Disclosure: no potential conlict of interest relevant to this article was reported.
REFERENCES
1. Danilovich N, Maysinger D, Sairam MR. Perspectives on repro-ductive senescence and biological aging: studies in genetically altered follitropin receptor knockout [FORKO] mice. Exp Gerontol. 2004;39:1669-78.
2. World Health Organization – WHO. Prevention and management of osteoporosis prevention. In: World Health Organization, editor. Technical Report Series n° 921. Geneva; 2003.
3. Brown DM, Jowsey J, Bradford DS. Osteoporosis in ovarian dys-genesis. J Pediatr. 1974;84:816-20.
4. White CM, Hergenroeder AC, Klish WJ. Bone mineral density in 15- to 21-year-old eumenorrheic and amenorrheic subjects. Am J Dis Child. 1992;146:31-5.
5. Gaffney-Stomberg E, Insogna KL, Rodriguez NR, Kerstetter JE. Increasing dietary protein requirements in elderly people for opti-mal muscle and bone health. J Am Geriatr Soc. 2009;57(6):1073-9. 6. Martin EA, Ritman EL, Turner RT. Time course of epiphyseal
growth plate fusion in rat tibiae. Bone. 2003;32:261-7.
7. Patlas N, Zadik Y, Yaffe P, Schwartz Z, Ornoy A. Oophorectomy--induced osteopenia in rats in relation to age and time postoo-phorectomy. Cells Tissues Organs. 2000;166(3):267-74.
8. Netto CC, Miyasaka CK. Fructooligosaccharides (FOS) and hormo-nal replacement therapy (HRT) by estrogen suppressed bone re-sorption in the ovariectomized rat. J Med Biol Sci. 2009;8(1):33-8. 9. Reeves PG, Nielsen FH, Fahey GC Jr. AIN-93 puriied diets for
laboratory rodents: inal report of the American Institute of Nu-trition ad hoc writing committee on the reformulation of the AIN--76A rodent diet. J Nutr. 1993;123(11):1939-51.
10. Jamieson JA, Ryz NR, Taylor CG, Weiler HA. Dietary long-chain inulin reduces abdominal fat but has no effect on bone density in growing female rats. Br J Nutr. 2008;100:451-9.
11. Rho JY, Spearing LK, Zioupos P. Mechanical properties and the hierarchical structure of bone. Med Eng Phys. 1998;20:92-102. 12. Kiebzak GM, Smith R, Howe JC, Sacktor B. Bone mineral content
in the senescent rat femur: an assessment using single photon absorptiometry. J Bone Miner Res. 1988;3(3):311-7.
13. Li XJ, Jee WSS, Ke HZ, Mori S, Akamine T. Age-related changes of cancellous and cortical bone histomorphometry in female Spra-gue-Dawley rats. Cell Mater. 1991;1:25-35.
14. Akkus O, Adar F, Schafler MB. Age-related changes in physico-chemical properties of mineral crystals are related to impaired mechanical function of cortical bone. Bone. 2004;34:443-53. 15. Ammann P, Rizzoli R. Bone strength and its determinants.
Osteo-poros Int. 2003;14(Suppl 3):S13-8.
16. Schluter KD. PTH and PTHrP: similar structures but different func-tions. News Physiol Sci. 1999;14:243-49.
17. Khanal RC, Nemere I. Endocrine regulation of calcium transport in epithelia. Clin Exp Pharmacol Physiol. 2008;35(11):1277-87. 18. Lips P. Vitamin D deiciency and secondary hyperparathyroidism
in the elderly: consequences for bone loss and fractures and the-rapeutic implications. Endocr Rev. 2001;22:477-501.
19. Mosekilde L. Vitamin D and the elderly. Clin Endocrinol. 2005;62:265-81.
20. Kiebzak GM, Smith R, Howe JC, Gundberg CM, Sacktor B. Bone status of senescent female rats: chemical, morphometric, and biomechanical analyses. J Bone Miner Res. 1988;3(4):439-46. 21. Saraiva GL, Cendoroglo MS, Ramos LR, Araújo LMQ, Vieira JGH,
Maeda SS, et al. Prevalence of vitamin D deiciency, insuficiency and secondary hyperparathyroidism in the elderly inpatients and living in the community of the city of São Paulo, Brazil. Arq Bras Endocrinol Metabol. 2007;51(3):437-42.
22. Russo LAT, Gregório LH, Lacativa PGS, Marinheiro LPF. Con-centration of 25-hydroxyvitamin D in postmenopausal women with low bone mineral density. Arq Bras Endocrinol Metab. 2009;53(9):1079-87.
23. Takada Y, Matsuyama H, Kato K, Kobayashi N, Yamamura JI, Yahi-ro M, et al. Milk whey pYahi-rotein enhances the bone breaking force in ovariectomized rats. Nutr Res. 1997;17(11):1709-20.
24. Khosla S, Arrighi HM, Melton LJ, Atkinson EJ, O’Fallon WM, Dunstan C, et al. Correlates of osteoprotegerin levels in women and men. Ost Int. 2002;13(5):394-9.
25. Boyce BF, Xing L. Functions of RANKL/RANK/OPG in bone modeling and remodeling. Arch Biochem Biophys. 2008;15(473-2):139-46. 26. Norian JM, Zeitlian G, Adel G, Freeman RG, Santoro NF, Pal L.
Low serum osteoprotegerin levels in premenopausal infertile wo-men with low bone density: an association of relevance? Fertil Steril. 2009;91(2):542-48.
27. Perez-Castrillon JL, Olmos JM, Nan DN, Castillo J, Arozamena J, Montero A, et al. Polymorphisms of the WNT10B gene, bone mineral density, and fractures in postmenopausal women. Calcif Tissue Int. 2009;85(2):113-8.