ACPD
15, 9033–9075, 2015Contribution from biogenic organic
compounds to particle growth
L. Zhou et al.
Title Page
Abstract Introduction
Conclusions References
Tables Figures
◭ ◮
◭ ◮
Back Close
Full Screen / Esc
Printer-friendly Version Interactive Discussion
Discussion
P
a
per
|
Discussion
P
a
per
|
Discussion
P
a
per
|
Discussion
P
a
per
|
Atmos. Chem. Phys. Discuss., 15, 9033–9075, 2015 www.atmos-chem-phys-discuss.net/15/9033/2015/ doi:10.5194/acpd-15-9033-2015
© Author(s) 2015. CC Attribution 3.0 License.
This discussion paper is/has been under review for the journal Atmospheric Chemistry and Physics (ACP). Please refer to the corresponding final paper in ACP if available.
Contribution from biogenic organic
compounds to particle growth during the
2010 BEACHON-ROCS campaign in a
Colorado temperate needle leaf forest
L. Zhou1,2, R. Gierens1, A. Sogachev3, D. Mogensen1, J. Ortega4, J. N. Smith4,5, P. C. Harley4, A. J. Prenni6, E. J. T. Levin7, A. Turnipseed4, A. Rusanen1,
S. Smolander1,8, A. B. Guenther9, M. Kulmala1, T. Karl10, and M. Boy1 1
Department of Physics, P.O. Box 64, 00014 University of Helsinki, Finland
2
Helsinki University Centre of Environment, P.O. Box 65, 00014 University of Helsinki, Finland
3
Department of Wind Energy, Technical University of Denmark, Frederiksborgvej 399, P.O. Box 49, Building 118, 4000, Roskilde, Denmark
4
National Center for Atmospheric Research, Boulder, CO, USA
5
Department of Applied Physics, University of Eastern Finland, 70211 Kuopio, Finland
6
National Park Service, Air Resources Division, Lakewood, CO, USA
7
Department of Atmospheric Science, Colorado State University, Fort Collins, CO, USA
8
ACPD
15, 9033–9075, 2015Contribution from biogenic organic
compounds to particle growth
L. Zhou et al.
Title Page
Abstract Introduction
Conclusions References
Tables Figures
◭ ◮
◭ ◮
Back Close
Full Screen / Esc
Printer-friendly Version Interactive Discussion
Discussion
P
a
per
|
Discussion
P
a
per
|
Discussion
P
a
per
|
Discussion
P
a
per
|
9
Atmospheric Sciences and Global Change Division, Pacific Northwest National Laboratory, Richland, WA, USA
10
University of Innsbruck, Institute for Meteorology and Geophysics (IMGI), Innrain 52, 6020 Innsbruck, Austria
Received: 3 March 2015 – Accepted: 9 March 2015 – Published: 25 March 2015 Correspondence to: L. Zhou ([email protected])
ACPD
15, 9033–9075, 2015Contribution from biogenic organic
compounds to particle growth
L. Zhou et al.
Title Page
Abstract Introduction
Conclusions References
Tables Figures
◭ ◮
◭ ◮
Back Close
Full Screen / Esc
Printer-friendly Version Interactive Discussion
Discussion
P
a
per
|
Discussion
P
a
per
|
Discussion
P
a
per
|
Discussion
P
a
per
|
Abstract
New particle formation (NPF) is an important atmospheric phenomenon. During a NPF event, molecular clusters first form by nucleation and then grow further by condensation of vapors. The growth step is crucial because it controls the number of particles that can become cloud condensation nuclei. In order to better understand the influence of
5
biogenic emissions on particle growth, we carried out modeling studies of NPF events during the BEACHON-ROCS campaign at Manitou Experimental Forest Observatory in Colorado, USA. The site is representative of the semi-arid Western US. The imple-mented chemistry scheme with the latest Criegee intermediates reaction rates under-estimates sulfuric acid concentration by 50 %, suggesting missing atmospheric sulfuric
10
acid sources. The results emphasize the contribution from biogenic volatile organic compound emissions to particle growth by demonstrating the effects of the oxidation products of monoterpenes and 2-Methyl-3-buten-2-ol (MBO). Monoterpene oxidation products are shown to influence the nighttime particle loadings significantly while their concentrations are insufficient to grow the particles during the day. The growth of
ultra-15
fine particles in daytime appears to be closely related to the OH oxidation products of MBO.
1 Introduction
Atmospheric aerosols have the potential to change the climate as they influence the Earth’s radiative balance as well as the hydrological cycle (e.g. Lohmann and Feicher,
20
2005; Kerminen et al., 2005). Apart from their climatic influences, aerosols reduce visibility and impact health. Therefore it is important to understand the life cycle of atmospheric aerosols and estimate their impacts on climate and health. One important phenomenon associated with the atmospheric aerosol system is new particle formation (NPF) (Kulmala et al., 2004c). During a NPF event, molecular clusters first form from
25
ACPD
15, 9033–9075, 2015Contribution from biogenic organic
compounds to particle growth
L. Zhou et al.
Title Page
Abstract Introduction
Conclusions References
Tables Figures
◭ ◮
◭ ◮
Back Close
Full Screen / Esc
Printer-friendly Version Interactive Discussion
Discussion
P
a
per
|
Discussion
P
a
per
|
Discussion
P
a
per
|
Discussion
P
a
per
|
but various studies have suggested possible nucleation compounds including water, sulfuric acid, ammonia, and organic compounds (Zhang et al., 2004; Sipilä et al., 2010; Kirkby et al., 2011; Schobesberger et al., 2013). The nucleated clusters then grow further by condensation of vapors and coagulation (Kulmala et al., 2004b; Kulmala and Kerminen, 2008; Kerminen et al., 2010). This growth step determines the formation
5
rate of detectable particles (usually >3 nm) as well as the impact of NPF on cloud condensation nuclei populations (Kulmala et al., 2013). Organic compounds are the main drivers of the growth step and are thus critical for aerosol formation (Kerminen et al., 2000; Sellegri et al., 2005; Boy et al., 2005; Allan et al., 2006; Laaksonen et al., 2008; Ehn et al., 2014).
10
Volatile organic compounds (VOC) are of both anthropogenic and biogenic origin. Vegetation produces biogenic volatile organic compounds (BVOC) for a variety of phys-iological purposes (e.g. Fuentes et al., 2000; Sharkey et al., 2008). There are complex mechanisms that control BVOC emissions. The emission abundance and chemical speciation varies by vegetation species as well as environmental conditions such as
15
light and temperature. Since the first enclosure study of BVOC emissions in the late 1920s (Isidorov, 1990), numerous assessments by lab experiments and field measure-ments have been carried out to quantify BVOC emissions. The global BVOC emissions by terrestrial ecosystems are estimated to be about 1000 Tg C yr−1, of which about 50 % is isoprene and 15 % is monoterpenes (Guenther et al., 2012). This is nearly
20
eight times the global VOC emissions of anthropogenic origin, which are estimated to be about 130 Tg C yr−1(Lamarque et al., 2010).
The impact of these huge BVOC emissions is of great scientific interest. Apart from their potential impacts on air quality (Andreae and Crutzen, 1997; Atkinson, 2000), BVOC are known to affect the climate system by contributing to aerosol formation and
25
ACPD
15, 9033–9075, 2015Contribution from biogenic organic
compounds to particle growth
L. Zhou et al.
Title Page
Abstract Introduction
Conclusions References
Tables Figures
◭ ◮
◭ ◮
Back Close
Full Screen / Esc
Printer-friendly Version Interactive Discussion
Discussion
P
a
per
|
Discussion
P
a
per
|
Discussion
P
a
per
|
Discussion
P
a
per
|
compounds to be non-volatile or have extremely low volatility (Spracklen et al., 2011; Riipinen et al., 2011; Donahue et al., 2011; Kulmala et al., 2013). For example, Ehn et al. (2014) investigated extremely low volatility organic compounds (ELVOC) aris-ing from monoterpene oxidation, which has been predicted by Kulmala et al. (1998) to enhance the condensational growth of aerosols in chamber experiments under
at-5
mospherically relevant conditions. This study has supplemented the link between sec-ondary organic aerosol (SOA) formation and one of the most abundant families of BVOC, monoterpenes. Besides monoterpenes, 2-Methyl-3-buten-2-ol (MBO), another important BVOC emitted by pine trees in western North America (Harley et al., 1998), is also a potential precursor of SOA (Arthur et al., 2009). Recent smog chamber
stud-10
ies and field measurements revealed that OH-initiated oxidation of MBO leads to SOA formation (Zhang et al., 2012, 2014).
Building on past research about the role of organic compounds in new particle for-mation, we aim to study in particular the influence of biogenic organic compounds on particle growth via a modeling approach. This modeling activity was conducted for the
15
Bio-hydro-atmosphere interactions of Energy, Aerosol, Carbon, H2O, Organics & Ni-trogen – Rocky Mountain Organic Carbon Study (BEACHON-ROCS) field campaign at the Manitou Experimental Forest Observatory (MEFO) during August 2010 (Ortega et al., 2014). The campaign focused on the biosphere–atmosphere exchange of reac-tive organic gases and thus provided an excellent dataset of aerosol precursor gases.
20
The Manitou Experimental Forest Observatory is a mountainous forest site in close proximity to human activity. It provides an opportunity to study biogenic SOA forma-tion at a rural–urban interface (Cui et al., 2014). Various studies have indicated that biogenic SOA formation in forest environments can be enhanced by the inflow of an-thropogenic pollutants (Boy et al., 2008; Hoyle et al., 2011; Jung et al., 2013). The
25
ACPD
15, 9033–9075, 2015Contribution from biogenic organic
compounds to particle growth
L. Zhou et al.
Title Page
Abstract Introduction
Conclusions References
Tables Figures
◭ ◮
◭ ◮
Back Close
Full Screen / Esc
Printer-friendly Version Interactive Discussion
Discussion
P
a
per
|
Discussion
P
a
per
|
Discussion
P
a
per
|
Discussion
P
a
per
|
was to assess the accuracy of reconstructing the highly variable meteorological con-ditions using a column model. The second task was to compare the modeled aerosol precursor gases against the measurements. In addition to sulfuric acid (H2SO4), we focused on MBO and monoterpenes because they dominate the biogenic emissions at the site (Karl et al., 2014; Kaser et al., 2013a, b; Kim et al., 2010). After assessing
5
the model performance with respect to the meteorology and related precursor gases, we proceeded with the study on the effects of BVOC and their oxidation products on particle growth.
2 Materials and methods
2.1 Manitou Experimental Forest Observatory and BEACHON-ROCS field 10
campaign
All observations presented in this study were obtained during the BEACHON-ROCS field campaign at Manitou Experimental Forest Observatory (MEFO) in August 2010. The campaign is part of the BEACHON project, which aims to investigate ecosystem-atmosphere exchange of trace gases and aerosols and their potential feedbacks
be-15
tween biogeochemical and hydrological cycles. Ortega et al. (2014) have provided a very detailed description of the BEACHON project as well as MEFO; here we only provide a summary of the site and campaign descriptions related to this study.
MEFO is located in the Front Range of the Colorado Rocky Mountains (39.1◦N 105.1◦W and 2370 m a.s.l.). It is a mountainous site in close proximity to large urban
20
centers (e.g. Denver is about 85 km northeast of the site and Colorado Springs about 40 km to the southeast). Due to shielding by the Rampart Range to the east and Pikes Peak to the south, the site normally encounters clean continental air masses from the southwest. Exceptions include episodic but frequent intrusions of anthropogenic air masses due to upslope flow during the mornings and air moving downslope from the
25
ACPD
15, 9033–9075, 2015Contribution from biogenic organic
compounds to particle growth
L. Zhou et al.
Title Page
Abstract Introduction
Conclusions References
Tables Figures
◭ ◮
◭ ◮
Back Close
Full Screen / Esc
Printer-friendly Version Interactive Discussion
Discussion
P
a
per
|
Discussion
P
a
per
|
Discussion
P
a
per
|
Discussion
P
a
per
|
site. The median tree age at the site was 49.5 years and the average canopy height was about 18.5 m in 2010 (DiGangi et al., 2011). Approximately 50 % of the precipita-tion falls as rain during the summer season (June–September), primarily during after-noon thunderstorms characterized by brief but intense periods of rainfall and lightning. The site is representative for the semi-arid Western US where biosphere–atmosphere
5
exchange processes of energy, water, carbon, and nitrogen are sensitive to the amount of precipitation.
Measurements of VOC used a valve switching system which changed sampling lines every 5 min and cycled through six Teflon inlets mounted at 1.6, 5.0, 12.0, 17.7, and 25.1 m over a 30 min period. VOC concentrations were measured by a
Proton-Transfer-10
Reaction Mass Spectrometer (PTR-MS, Ionicon Analytik GmbH). The instrument is based on soft chemical ionization using protonated water ions (H3O+) (Hansel et al., 1995; Lindinger et al., 1998). Other trace-gas measurements from this tower include CO, CO2, water vapor, NO, NO2, O3 and SO2. The tower was also equipped with sonic anemometers as well as temperature and radiation probes for continuous
mete-15
orological measurements and for observing turbulent fluxes using a closed-path eddy covariance system. Detailed descriptions of the flux and concentration measurements of VOC are presented in Kaser et al. (2013b). Sulfuric acid and OH concentrations were measured using Chemical-Ionization Mass Spectrometry (CIMS) (Tanner et al., 1997). The inlet was 2.7 m a.g.l., facing perpendicular to the primary wind direction. The
un-20
certainties for H2SO4measurements are estimated to be 30–60 % (Plass-Dülmer et al., 2011). The uncertainties for OH measurements are estimated as 35 % with a detection limit at 4×10⁵molecules cm−3 (Kim et al., 2013). Downwelling NO2 photolysis rates were measured by filter radiometers (Meteorologie Consult GmbH, Junkermann et al., 1989) at the top of the chemistry tower. The ratio of downwelling to upwelling NO2
pho-25
tolysis rate was measured on 10 August 2010. The ratio was then used to estimate the total NO2photolysis rate for the rest of the campaign period (DiGangi et al., 2011).
ACPD
15, 9033–9075, 2015Contribution from biogenic organic
compounds to particle growth
L. Zhou et al.
Title Page
Abstract Introduction
Conclusions References
Tables Figures
◭ ◮
◭ ◮
Back Close
Full Screen / Esc
Printer-friendly Version Interactive Discussion
Discussion
P
a
per
|
Discussion
P
a
per
|
Discussion
P
a
per
|
Discussion
P
a
per
|
period. Sample flow first passed through a diffusion drier and a bipolar charge neutral-izer (Aerosol Dynamics Inc.), containing four210Po strips (NRD Staticmaster 2U500). Particles were then size selected using a differential particle counter (DMA; TSI 3071) and counted with a condensation particle counter (CPC; TSI 3010). The DMA stepped through 20 dry particle diameters chosen such that dlog10Dpremained constant.
Mea-5
surements were made at each size setting for 30 s.
NCAR GPS Advanced Upper-Air Sounding System (GAUS) launched sondes to in-vestigate the evolution of the boundary layer. The measurements are available from 12 August 2010 noon to 14 August 2010 noon and from 21 August 2010 noon to 23 August 2010 noon. The interval between each measurement point is either one or two
10
hours.
2.2 SOSAA model
The SOSAA model is a one-dimensional chemical-transport model with detailed aerosol dynamics. It was constructed to study various processes in the planetary boundary layer in and above a forest canopy, which includes biogenic emissions,
15
vertical transport, air chemistry and aerosol dynamics (Boy et al., 2011; Zhou et al., 2014). The different processes have been modularized so that the model is optimized for implementing various parameterizations. The boundary layer meteorology code is based on the one-dimensional version of SCADIS (SCAlar DIStribution, Sogachev et al., 2002, 2012). The emission module in the model is based on MEGAN (Model
20
of Emissions of Gases and Aerosols from Nature, Guenther et al., 2006). The chemi-cal mechanism scheme is produced by selecting chemichemi-cal reactions primarily from the Master Chemical Mechanism, MCM v3.2 (Jenkin et al., 1997, 2012; Saunders et al., 2003), via the website: http://mcm.leeds.ac.uk/MCM. The selected chemical reactions are processed using the KPP – kinetic preprocessor (Damian et al., 2002). The
chem-25
un-ACPD
15, 9033–9075, 2015Contribution from biogenic organic
compounds to particle growth
L. Zhou et al.
Title Page
Abstract Introduction
Conclusions References
Tables Figures
◭ ◮
◭ ◮
Back Close
Full Screen / Esc
Printer-friendly Version Interactive Discussion
Discussion
P
a
per
|
Discussion
P
a
per
|
Discussion
P
a
per
|
Discussion
P
a
per
|
der clear sky conditions (Korhonen et al., 2004). It includes all basic aerosol processes, including nucleation, condensation, coagulation and dry deposition. The model perfor-mance has been validated against field measurements from Hyytiälä, Finland in various studies (Boy et al., 2013; Mogensen et al., 2011, 2014; Smolander et al., 2014).
The biogenic emission module based on MEGAN requires emission factors for
rep-5
resentative vegetation types to estimate the net fluxes of BVOC from canopy to the at-mosphere. The emission factors define the emission of a given compound at standard conditions and have an uncertainty of a factor of three or more when global default val-ues are used, primarily due to the large variability in emission rates for different plants (Guenther et al., 1995). In this study monoterpene emission factors were obtained
10
from leaf cuvette measurements (Harley et al., 2014), while the MBO emission factor is suggested by Kaser et al. (2013a), which is based on both leaf cuvette emission measurements and canopy-scale analysis.
The chemistry scheme employed by the model for this study includes the full MCM chemical paths for the following parent molecules: methane, methanol, formaldehyde,
15
acetone, acetaldehyde, MBO, isoprene, alpha-pinene, pinene, limonene and beta-caryophyllene. For other emitted organic compounds, for which no MCM chemistry path is available, we have included their first order oxidation reactions with OH, O3 and NO3. Those compounds include: myrcene, sabinene, 3-carene, ocimene, cineole, and “other” monoterpenes, farnesene, and “other” sesquiterpenes (Atkinson, 1994). In
20
the case of linalool we have included its reaction with OH and NO3 to form acetone and “condensable material” and its reaction with O3to additionally produce formalde-hyde. For the reactions of the stabilized Criegee Intermediates (sCI) from alpha-, beta-pinene and limonene, we have used the rates from Mauldin et al. (2012) similar to “Scenario C” in Boy et al. (2013). For the sCI from isoprene, we used the rates from
25
ACPD
15, 9033–9075, 2015Contribution from biogenic organic
compounds to particle growth
L. Zhou et al.
Title Page
Abstract Introduction
Conclusions References
Tables Figures
◭ ◮
◭ ◮
Back Close
Full Screen / Esc
Printer-friendly Version Interactive Discussion
Discussion
P
a
per
|
Discussion
P
a
per
|
Discussion
P
a
per
|
Discussion
P
a
per
|
It is not fully understood which mechanisms drive nucleation in the atmosphere. Var-ious parameterizations have been created for predicting atmospheric nucleation (e.g. Pierce and Adams, 2009; Paasonen et al., 2010). The nucleation mechanism, however, has minor influence on the actual production rate of the observable particles compared to the subsequent growth step because the nucleated clusters have rather short
life-5
times (Kulmala and Kerminen, 2008; Kulmala et al., 2013). For this reason, we opted to use only the kinetic nucleation parameterization in this study (Weber et al., 1997). It was chosen also because Zhou et al. (2014) showed that the SOSAA model with kinetic nucleation parameterization gave good predictions of NPF events at a boreal forest site in Hyytiälä, Finland. In kinetic nucleation, two sulfuric acid molecules collide
10
to form a cluster as in the kinetic gas theory. Some of the formed clusters will break apart, but some will remain stable and then grow to become particles. The nucleation rate,J, is related to the sulfuric acid concentration, [H2SO4], via
J=K×[H2SO4]2 (1)
where K is the kinetic coefficient that includes both the collision frequency and the
15
probability of forming a stable cluster after the collision (Weber et al., 1997; Sihto et al., 2006; Zhou et al., 2014). The nucleated particles were then added to the first size bin (at 2 nm) in the model. Before carrying out our modeling studies for particle growth, a sensitivity study was done to establish a suitable value for the nucleation coefficient
K. By comparing the simulated and DMPS measured total number concentrations for
20
particles between 20 and 80 nm,K was set to 5×10⁻¹⁵cm−3s−1.
The SOSAA model requires four groups of input data. The first group includes the site land cover characteristics, such as the leaf density and canopy height. The sec-ond group consists of meteorological parameters including radiation, vertical profiles of wind speed, temperature and relative humidity. These inputs are available from
25
ACPD
15, 9033–9075, 2015Contribution from biogenic organic
compounds to particle growth
L. Zhou et al.
Title Page
Abstract Introduction
Conclusions References
Tables Figures
◭ ◮
◭ ◮
Back Close
Full Screen / Esc
Printer-friendly Version Interactive Discussion
Discussion
P
a
per
|
Discussion
P
a
per
|
Discussion
P
a
per
|
Discussion
P
a
per
|
radiation inputs, the actinic flux spectrum, was not measured at MEFO, we used the scaled actinic flux spectrum from the Tropospheric Ultraviolet and Visible (TUV) Radi-ation Model (Madronich, 1993). The scaling factors are based on the measured NO2 photolysis rates and the TUV modeled rates (Madronich and Flocke, 1998). The third group consists of five inorganic gas concentrations (NO, NO2, CO, O3 and SO2)
mea-5
sured from the chemistry tower and the sulfuric acid sink to the background particles. The condensation sink of sulfuric acid was calculated based on the method described by Pirjoja et al. (1998). These parameters were read in every half hour with a linear interpolation in between. The last group of input data is the measured particle number size distribution. The model only reads in the measured number size distribution once
10
a day at midnight for initialization. More detailed description of model input is available from Boy et al. (2011).
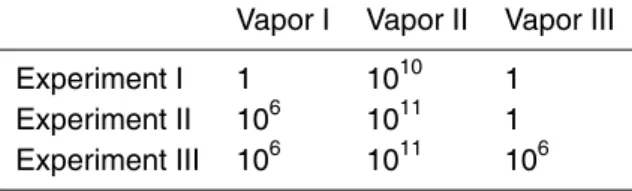
2.3 Modeling experiments
In order to investigate the influence of organics on particle growth, three organic vapors (Vapor I–III) were set to take part in the condensation process in addition to sulfuric
15
acid. Since the main biogenic emissions at the site are MBO and monoterpenes, Vapor I–III were set to be the lumped sums of first stable reaction products from OH, O3and NO3 oxidation of MBO or/and monoterpenes. This treatment of organic condensing vapors is similar to the approach of Lauros et al. (2011) and Zhou et al. (2014). Three model experiments were designed to study the influence of MBO and monoterpenes
20
on particle growth:
– Experiment I: lumped sums of first stable reaction products from OH, O3, and NO3 oxidation of monoterpenes were included as the organic condensing Vapor I, II, and III respectively.
– Experiment II: lumped sums of first stable reaction products from OH, O3, and
25
ACPD
15, 9033–9075, 2015Contribution from biogenic organic
compounds to particle growth
L. Zhou et al.
Title Page
Abstract Introduction
Conclusions References
Tables Figures
◭ ◮
◭ ◮
Back Close
Full Screen / Esc
Printer-friendly Version Interactive Discussion
Discussion
P
a
per
|
Discussion
P
a
per
|
Discussion
P
a
per
|
Discussion
P
a
per
|
– Experiment III: lumped sums of first stable reaction products from OH oxidation of both monoterpenes and MBO were included as the organic condensing Vapor I. Lumped sums of first stable reaction products from O3 and NO3 oxidation of monoterpenes were included as the organic condensing Vapor II and III, which were the same as Vapor II and III in Experiment I.
5
The aerosol module simulates particle growth by calculating the condensation flux of each condensing vapor onto the particle surfaces (Korhonen et al., 2004). An iterative method was used in each experiment to estimate the saturation vapor concentration of the condensing organic vapors, by varying the saturation vapor concentration of each compound and by comparing the modeled particle size distribution with the observed
10
distribution. In all experiments, sulfuric acid condenses onto particles with the assump-tion that once it is condensed, it will not evaporate from the particles.
3 Model validation for meteorology and chemistry
Since the SOSAA model does not accommodate precipitation, all the observational data presented in this section have been filtered to exclude rain events. When
compar-15
ing averaged diurnal profiles of a specific parameter, the modeled profile is the average of the period for which observation data are available.
3.1 Meteorology
Figure 1 presents the average behavior of the modeled temperature, wind speed and relative humidity compared to the measurements above the canopy at 30 m. Because
20
the site is situated in a north–south slope (draining to the north), the meteorology is influenced by the diurnal mountain-valley flows. While daytime wind directions are vari-able, nighttime winds are dominated by the drainage from the south (Ortega et al., 2014). Unfortunately the column model SOSAA cannot capture this behavior related to the topography. The model simulates a comparable temperature for daytime but fails
ACPD
15, 9033–9075, 2015Contribution from biogenic organic
compounds to particle growth
L. Zhou et al.
Title Page
Abstract Introduction
Conclusions References
Tables Figures
◭ ◮
◭ ◮
Back Close
Full Screen / Esc
Printer-friendly Version Interactive Discussion
Discussion
P
a
per
|
Discussion
P
a
per
|
Discussion
P
a
per
|
Discussion
P
a
per
|
to decrease the temperature sufficiently during nighttime. The big diurnal variation ap-plies not only to the temperature but also to the relative humidity (RH). The model again simulates comparable RH levels during the day but fails to capture it at night. The underestimation in RH at night is mainly a result of the overestimation of temper-ature. The simulated wind speed agrees well with the measurements during daytime.
5
At night, the wind speed was observed to fluctuate around 2 m s−1 above the canopy, but the modeled wind speed is around 3 m s−1. As already mentioned, the model can-not simulate the drainage flows related to the topography, and a clear discrepancy of the nighttime wind speeds can be expected as the nighttime drainage has been ob-served to be effective at the site. In general the model gave satisfactory predictions of
10
the three meteorological variables during daytime, though notable deviations are found during nighttime.
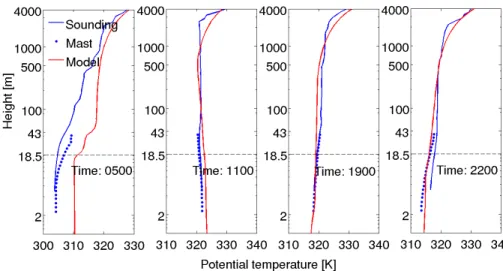
22 August 2010, day of year (DOY) 234, was selected out of the five sounding days for demonstrating vertical profiles of the potential temperature at the site (Fig. 2). Mast measurements are provided in addition to sounding data in order to extend the
mea-15
sured profile close to the surface. Mast measurements and sounding measurements differ because (1) the tower observations presented are half an hour averages, while the sounding can only provide an instantaneous value, (2) the instruments are not the same, (3) measurements were not made at exactly the same location. At 05:00 LT, both the model and measurements show a typical nocturnal stable boundary layer. We focus
20
on the gradient of potential temperature that describes the stability. The model exhibits a stronger gradient at the canopy top (18.5 m) compared to both the mast measure-ments and the sounding observation. The modeled profile improves during daytime. At 11:00 LT, the boundary layer has developed since morning up to about 800 m in the model, while the sounding data show it may be higher than 1 km. The simulated
25
ACPD
15, 9033–9075, 2015Contribution from biogenic organic
compounds to particle growth
L. Zhou et al.
Title Page
Abstract Introduction
Conclusions References
Tables Figures
◭ ◮
◭ ◮
Back Close
Full Screen / Esc
Printer-friendly Version Interactive Discussion
Discussion
P
a
per
|
Discussion
P
a
per
|
Discussion
P
a
per
|
Discussion
P
a
per
|
layer has also been observed in studies made in Hyytiälä, Finland (Mogensen et al., 2014). At 22:00 LT, the nocturnal boundary layer has built up. We see the model pro-file shows a gradient below the canopy at around 10 m, indicating an inversion inside the canopy. The sounding measurements show strongest potential temperature gradi-ent above the canopy. In general, despite the underestimated daytime boundary layer
5
height, the model at least predicted a satisfactory potential temperature profile up to the top of measurement mast.
To investigate the model performance with respect to the surface energy balance and the vertical mixing strength, we compared the modeled average diurnal profile of the latent and sensible heat fluxes and friction velocity with the eddy covariance
measure-10
ments above canopy (Fig. 3). A positive flux indicates that the atmosphere is gaining heat from the surface and vice versa for the negative flux. The modeled latent heat flux is in general comparable with observations except during morning when the model underestimates the fluxes slightly. The sensible heat flux is in general overestimated during daytime. This is probably related to inaccuracies of the other components of
15
the energy balance, namely the heat flux and storage to the soil and the net radiation. These can also cause the leaf temperature to be modeled incorrectly, which promotes the simulated sensible heat flux. The friction velocity is well simulated compared to the measurements during daytime. The nighttime overestimation is due to the overestima-tion of wind speed (Fig. 1), which increases vertical wind shear and thus the amount
20
of turbulent mixing. The well modeled friction velocity suggests that the model should have reasonable vertical turbulence mixing.
To summarize, the model’s meteorological performance is satisfactory during day-time. The simulated basic meteorological parameters (temperature and its gradient, humidity, and wind speed) as well as the turbulent fluxes of latent heat and momentum
25
ACPD
15, 9033–9075, 2015Contribution from biogenic organic
compounds to particle growth
L. Zhou et al.
Title Page
Abstract Introduction
Conclusions References
Tables Figures
◭ ◮
◭ ◮
Back Close
Full Screen / Esc
Printer-friendly Version Interactive Discussion
Discussion
P
a
per
|
Discussion
P
a
per
|
Discussion
P
a
per
|
Discussion
P
a
per
|
height is not large, this is not expected to have a high impact. However, during night-time the drainage flows down the side of the mountain cause difficulties for the model to simulate the meteorological conditions. We therefore focus on daytime conditions in the following analysis.
3.2 Chemistry 5
The chemistry analysis focuses on aerosol precursor gases (MBO, monoterpenes and sulfuric acid), OH and the oxidation products of MBO and monoterpenes. Averaged diurnal concentrations are presented in this section to show the general behavior of modeled chemistry. The averages for MBO and monoterpenes are calculated for 10–23 and 29–31 August 2010 when the PTR-MS measurements are available. The averages
10
for OH and sulfuric acid are calculated for 13 August 2010 noon to 14 August 2010 noon and 16 to 25 August 2010 noon when the CIMS measurements are available. The averages for oxidation products are calculated for 1–8, 19–22, and 25–30 August 2010, when the aerosol particle measurements are available.
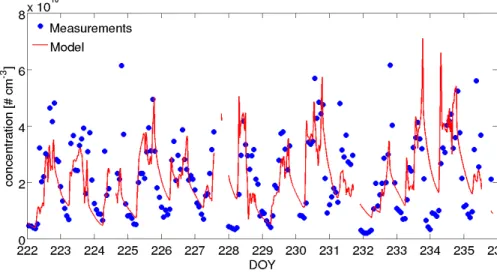
The averaged diurnal profiles show that the monoterpene concentration has a clear
15
diurnal variation in both the observations and model simulation (Fig. 4). The concen-tration is high during the night and low during the day. The nighttime concenconcen-tration is high mainly due to the suppressed boundary layer height and the decreased losses from oxidation. On the other hand, the concentration decreases during daytime as the boundary layer height increases and due to the presence of OH. The model
simu-20
lated comparable concentrations but an increasing trend for MT during night. The main reason could be that the model overestimated the nighttime temperature up to five de-grees, which possibly leads to overestimation of monoterpene emissions. On average the simulated monoterpene concentration during daytime agrees well with the mea-surement (Fig. 4). The MBO concentration is high during daytime and low in nighttime
25
ACPD
15, 9033–9075, 2015Contribution from biogenic organic
compounds to particle growth
L. Zhou et al.
Title Page
Abstract Introduction
Conclusions References
Tables Figures
◭ ◮
◭ ◮
Back Close
Full Screen / Esc
Printer-friendly Version Interactive Discussion
Discussion
P
a
per
|
Discussion
P
a
per
|
Discussion
P
a
per
|
Discussion
P
a
per
|
(DOY 222 to 235). It shows that the modeled concentration is comparable to the mea-surement except at some nights when the concentration is overestimated.
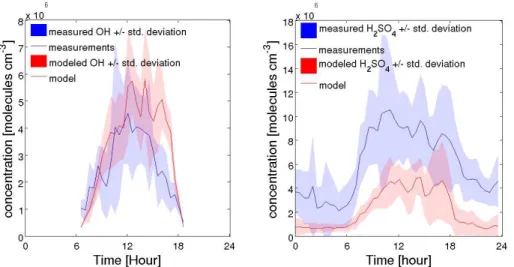
The modeled average diurnal profile of OH is in good agreement with the obser-vations before noon (Fig. 6). After this time, the model results become higher than the observations, likely related to an overestimation of photolysis production in the
af-5
ternoon. Since a scaling factor based on the modeled clear sky and measured NO2 photolysis rate was used to scale the actinic flux spectrum for whole solar radiation wavelength, the overestimated NO2photolysis rate in the afternoon suggests the pho-tolysis production of OH may also be overestimated (Fig. 7). The modeled sulfuric acid concentration is only half of the observed value (Fig. 6). One reason could be that the
10
condensation sink of sulfuric acid is overestimated. Another reason should relate to the unknown sulfuric acid production term missing from the chemistry scheme (Eisele and Tanner, 1993; Boy et al., 2013; Berresheim et al., 2014). Because the underestimation is observed both during night and daytime, the missing production term is likely not related to photolysis. It should also be noted that the CIMS measurements may have
15
uncertainties of 30 to 60 % (Plass-Dülmer et al., 2011). Importantly, the diurnal trend in sulfuric acid concentrations is well captured, which seems to be crucial for correctly simulating new particle formation events.
The modeled diurnal concentration profiles of the sum of first stable reaction products from OH, O3and NO3 oxidation of monoterpenes and MBO are shown in Fig. 8. The
20
concentrations of reaction products from MBO oxidation are 10 to 100 times higher than the concentrations of reaction products from monoterpenes, except in case of NO3 oxidation. The concentrations of O3 oxidation products are about two to three orders of magnitude greater than that of OH oxidation products, irrespective of the precursor species. Comparing to the concentrations of first stable O3oxidation products of MBO,
25
ACPD
15, 9033–9075, 2015Contribution from biogenic organic
compounds to particle growth
L. Zhou et al.
Title Page
Abstract Introduction
Conclusions References
Tables Figures
◭ ◮
◭ ◮
Back Close
Full Screen / Esc
Printer-friendly Version Interactive Discussion
Discussion
P
a
per
|
Discussion
P
a
per
|
Discussion
P
a
per
|
Discussion
P
a
per
|
of monoterpenes exhibit a clear diurnal trend that the concentrations are high during the night low during the day, which are explained by the same diurnal trends of NO3 and monoterpenes concentrations. Opposite to the trend of NO3 oxidation products of monoterpenes, the concentrations of OH oxidation products of MBO show a clear diurnal profile that peaks at noon and drops during night. Because the fast growth of
5
nucleated clusters often happens during daytime, it is suspected that the OH oxidation products of MBO may possibly contribute to the early growth of particles at the site.
The overall outcome of emissions and chemistry is satisfactory in that all relevant aerosol precursor gases are well simulated with respect to the diurnal trends. In theory, underestimation of sulfuric acid concentrations should lead to less SOA formation, but
10
this problem can be compensated for during the sensitivity studies of the nucleation coefficient.
4 Aerosol simulations
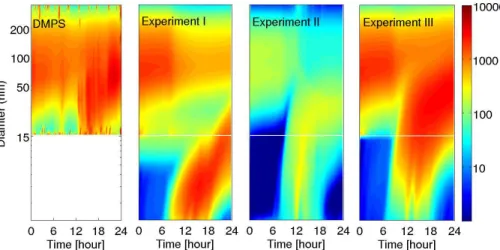
The saturation vapor concentrations of organic condensing vapors (Vapor I, II, and III) in two model experiments are listed in Table 1. The simulation results provide strong
15
evidence that BVOC play an important role in particle growth at MEFO (Fig. 9). In Ex-periment I, despite using a very low saturation vapor concentration of 1 molecule cm−3 for Vapor I (OH oxidation products of monoterpenes), the model simulated insufficient growth for particles to reach 15 nm, which is the minimum detectable size of the DMPS instrument used during the campaign. The saturation vapor concentration for the ozone
20
oxidation products (Vapor II) cannot be less than 1010molecules cm−3 due to its high concentration during the night; otherwise it would cause unrealistic night-time particle growth (Fig. 8). With the same consideration, the saturation vapor concentration of Va-por II in Experiment II was also kept quite high, at 1011molecules cm−3. In Experiment II, nucleated clusters are able to grow large enough to pass the instrument detection
25
ACPD
15, 9033–9075, 2015Contribution from biogenic organic
compounds to particle growth
L. Zhou et al.
Title Page
Abstract Introduction
Conclusions References
Tables Figures
◭ ◮
◭ ◮
Back Close
Full Screen / Esc
Printer-friendly Version Interactive Discussion
Discussion
P
a
per
|
Discussion
P
a
per
|
Discussion
P
a
per
|
Discussion
P
a
per
|
gases present, for example, monoterpenes. Experiment III combined the contributions from the oxidation products of both monoterpenes and MBO – the OH oxidation prod-ucts from MBO enable the freshly nucleated particles in the daytime to grow large and fast enough while the nighttime NO3oxidation products from monoterpenes allow par-ticles to grow up to 100 nm. The simulated growth of parpar-ticles above 15 nm compares
5
well with the DMPS measurements. These simulations are also consistent with results from Levin et al. (2012, 2014) for hygroscopicity measurements at the BEACHON-ROCS site; these authors showed that growth of new particles was likely driven by biogenic secondary organic species, and the NPF events ultimately impacted aerosol chemical and physical properties for particles up to cloud condensation nuclei (CCN)
10
sizes.
Since lump sums of different oxidation products were used as the condensing vapors in this modeling study, it was not possible to assign exact physical properties to the va-pors. Based on the implemented chemistry scheme, the molar mass of the three con-densing vapors should range from 200 to 300 Da. The saturation vapor concentration
15
of 106molecules cm−3would thus correspond to approximately 0.0001–0.0005 µg m−3, which is close to the saturation vapor concentration of the extreme low volatility com-pounds suggested by Donahue et al. (2011). The three experiments suggest the im-portance of extremely low volatility compounds for growing particles, especially the role of monoterpenes and MBO as precursor gases in different time of a day.
20
Particle number size distributions are shown together with above canopy wind direc-tion observadirec-tions for the period of 19 to 22 August 2010 (DOY 231 to 234, Fig. 10), when continuous sulfuric acid, MBO and monoterpene concentration measurements were available (Fig. 11). We see that the modeled onset of nucleation, the first appear-ance of sub-3 nm particles in simulated number size distribution, usually starts when
25
ACPD
15, 9033–9075, 2015Contribution from biogenic organic
compounds to particle growth
L. Zhou et al.
Title Page
Abstract Introduction
Conclusions References
Tables Figures
◭ ◮
◭ ◮
Back Close
Full Screen / Esc
Printer-friendly Version Interactive Discussion
Discussion
P
a
per
|
Discussion
P
a
per
|
Discussion
P
a
per
|
Discussion
P
a
per
|
the change in wind direction. On 19 August 2010 (DOY 231) around noon the wind direction changed from west to northeast and to north. At the same time as the air mass changed, we see a decrease in the concentration of measured background par-ticles larger than 100 nm. At that time a burst of parpar-ticles between 20 to 50 nm was observed. These particles were likely formed north of the measurement site and then
5
brought to the site through advection. A few hours later at about 19:00 LT, a short rain quickly washed out most particles. This burst of particles before the rain matched well with the simulated particle number size distribution for the same time period. We sus-pect that a new particle formation event did occur in the forest on that day, but was just not captured by the measurement instrument. In the evening, particles were removed
10
by precipitation. Similarly on 20 August 2010 (DOY 232), when the wind direction fluc-tuated between north and south and the air mass was transported around the forest, we see a burst of particles between 20 to 50 nm in the afternoon. For the rest of the day the particles were observed to continue growing while wind persisted blowing from the south. The southern wind was likely to bring polluted air to the site at late evening,
15
which appeared as the high concentration of particles over between 50 and 100 nm. Apart from this abrupt increase in concentrations of 50–100 nm particles, which can-not be captured by the column model, the observed number size distribution is well simulated. Although no new particle formation was observed on 21 August 2010 (DOY 233), the model simulated a weak formation event. This tendency of the model to
pre-20
dict new particle formation events when none are observed has already been reported in the previous SOSAA model study by Zhou et al. (2014). It likely results from our incomplete understanding of the NPF phenomenon, especially in cluster nucleation. Kinetic nucleation parameterization by sulfuric acid is indeed too simple to account for the process, which makes the simulated nucleation too sensitive to sulfuric acid
25
ACPD
15, 9033–9075, 2015Contribution from biogenic organic
compounds to particle growth
L. Zhou et al.
Title Page
Abstract Introduction
Conclusions References
Tables Figures
◭ ◮
◭ ◮
Back Close
Full Screen / Esc
Printer-friendly Version Interactive Discussion
Discussion
P
a
per
|
Discussion
P
a
per
|
Discussion
P
a
per
|
Discussion
P
a
per
|
the area but the instrument failed to capture the complete process due to possible advection in the forest.
5 Conclusions
We applied the 1-D chemical-transport model with detailed aerosol dynamics, SOSAA, to simulate results obtained during the summer 2010 BEACHON-ROCS campaign at
5
Manitou Forest Observatory. The model succeeded in reconstructing the meteorolog-ical conditions and several important gas species including OH, MBO and monoter-penes during the daytime. Although the latest Criegee reaction rates have been in-cluded, sulfuric acid concentration is still underestimated by 50 % compared to the measurements.
10
The SOSAA model indicated that mixing strength and chemistry can be reasonably predicted and so aerosol simulations were then conducted in order to investigate par-ticle growth. Due to the assumption of horizontal homogeneity for a column model, there is some uncertainty due to the incomplete description of the area’s complex terrain and inhomogeneous forest composition. Nevertheless, model simulations are
15
useful for investigating SOA formation, depicting the phenomenon with less influence of horizontal advection, which can hamper our direct field observations. By diluting the advection effects via averaging, Fig. 9 presents a possible pattern of particle growth at the site based on measurements and a successful reproduction of the phenomenon by a state-of-the-art model incorporating the latest knowledge of the processes involved.
20
The modeled results emphasize the contribution from local BVOC emissions to the particle growth. It is indicated that the organic condensing compounds responsible for the growth of ultrafine particles may have a low saturation vapor concentration around 106molecules cm−3. The compounds should have a similar daily pattern and concen-tration level as the OH oxidation products of MBO, which is the dominant local biogenic
25
ACPD
15, 9033–9075, 2015Contribution from biogenic organic
compounds to particle growth
L. Zhou et al.
Title Page
Abstract Introduction
Conclusions References
Tables Figures
◭ ◮
◭ ◮
Back Close
Full Screen / Esc
Printer-friendly Version Interactive Discussion
Discussion
P
a
per
|
Discussion
P
a
per
|
Discussion
P
a
per
|
Discussion
P
a
per
|
to the particle loading during nighttime could be important. Due to the anthropogenic origin of SO2, which is the precursor gas of sulfuric acid that triggers nucleation, the model study suggests that new particle formation events are likely to happen locally in the forest and meantime under the influence of anthropogenic pollution.
The SOSAA model has been shown as a good tool for studying various atmospheric
5
processes including SOA formation constrained by observations. The model is ex-pected to improve in several aspects, one of which is the growth parameterization. At the moment the chosen condensing molecules are lumped to several condensing vapor classes and assigned with approximated properties. A new parameterization that calculates the exact physical properties, such as saturation vapor pressure, for each
10
specific condensing molecule is being developed.
Acknowledgements. We would like to thank the National Center for Atmospheric Research (NCAR) Advanced Study Program, Helsinki University Centre of Environment (HENVI), the EC Seventh Framework Program (Marie Curie Reintegration Program, “ALP-AIR”, grant no. 334 084) and the Nordic Centers of Excellence CRAICC for their generous financial support.
15
We would like to acknowledge participants in the NCAR BEACHON project for data sharing. We wish to express thanks to our colleagues for all the discussions, especially to Sasha Madronich, Tuomo Nieminen and Sam Hall for the valuable suggestions. We thank CSC-IT center, Finland for providing the computing service. The National Center for Atmospheric Research is spon-sored by the United States National Science Foundation. Any opinions, findings and
conclu-20
sions or recommendations expressed in the publication are those of the authors and do not necessarily reflect the views of the National Science Foundation.
References
Allan, J. D., Alfarra, M. R., Bower, K. N., Coe, H., Jayne, J. T., Worsnop, D. R., Aalto, P. P., Kulmala, M., Hyötyläinen, T., Cavalli, F., and Laaksonen, A.: Size and composition
measure-25
ACPD
15, 9033–9075, 2015Contribution from biogenic organic
compounds to particle growth
L. Zhou et al.
Title Page
Abstract Introduction
Conclusions References
Tables Figures
◭ ◮
◭ ◮
Back Close
Full Screen / Esc
Printer-friendly Version Interactive Discussion
Discussion
P
a
per
|
Discussion
P
a
per
|
Discussion
P
a
per
|
Discussion
P
a
per
|
Andreae, M. O. and Crutzen, P. J.: Atmospheric aerosols: biogeochemical sources and role in atmospheric chemistry, Science, 276, 1052–1058, doi:10.1126/science.276.5315.1052, 1997.
Atkinson, R.: Gas–phase tropospheric chemistry of organic compounds, J. Phys. Chem. Ref. Data, 2, 1–216, 1994.
5
Atkinson, R.: Atmospheric chemistry of VOCs and NOx, Atmos. Environ., 34, 2063–2101, 2000. Berresheim, H., Adam, M., Monahan, C., O’Dowd, C., Plane, J. M. C., Bohn, B., and Rohrer, F.:
Missing SO2oxidant in the coastal atmosphere? – Observations from high-resolution mea-surements of OH and atmospheric sulfur compounds, Atmos. Chem. Phys., 14, 12209– 12223, doi:10.5194/acp-14-12209-2014, 2014.
10
Boy, M., Kulmala, M., Ruuskanen, T. M., Pihlatie, M., Reissell, A., Aalto, P. P., Keronen, P., Dal Maso, M., Hellen, H., Hakola, H., Jansson, R., Hanke, M., and Arnold, F.: Sulphuric acid closure and contribution to nucleation mode particle growth, Atmos. Chem. Phys., 5, 863– 878, doi:10.5194/acp-5-863-2005, 2005.
Boy, M., Karl, T., Turnipseed, A., Mauldin, R. L., Kosciuch, E., Greenberg, J., Rathbone, J.,
15
Smith, J., Held, A., Barsanti, K., Wehner, B., Bauer, S., Wiedensohler, A., Bonn, B., Kul-mala, M., and Guenther, A.: New particle formation in the Front Range of the Colorado Rocky Mountains, Atmos. Chem. Phys., 8, 1577–1590, doi:10.5194/acp-8-1577-2008, 2008. Boy, M., Sogachev, A., Lauros, J., Zhou, L., Guenther, A., and Smolander, S.: SOSA – a
new model to simulate the concentrations of organic vapours and sulphuric acid inside
20
the ABL – Part 1: Model description and initial evaluation, Atmos. Chem. Phys., 11, 43–51, doi:10.5194/acp-11-43-2011, 2011.
Boy, M., Mogensen, D., Smolander, S., Zhou, L., Nieminen, T., Paasonen, P., Plass-Dülmer, C., Sipilä, M., Petäjä, T., Mauldin, L., Berresheim, H., and Kulmala, M.: Oxidation of SO2 by stabilized Criegee intermediate (sCI) radicals as a crucial source for atmospheric sulfuric
25
acid concentrations, Atmos. Chem. Phys., 13, 3865–3879, doi:10.5194/acp-13-3865-2013, 2013.
Chan, A. W. H., Galloway, M. M., Kwan, A. J., Chhabra, P. S., Keutsch, F. N., Wennberg, P. O., Flagan, R. C., and Seinfeld, J. H.: Photooxidation of 2-Methyl-3-Buten-2-ol (MBO) as a po-tential source of secondary organic aerosol, Environ. Sci. Technol., 43, 4647–4652, 2009.
30
ACPD
15, 9033–9075, 2015Contribution from biogenic organic
compounds to particle growth
L. Zhou et al.
Title Page
Abstract Introduction
Conclusions References
Tables Figures
◭ ◮
◭ ◮
Back Close
Full Screen / Esc
Printer-friendly Version Interactive Discussion
Discussion
P
a
per
|
Discussion
P
a
per
|
Discussion
P
a
per
|
Discussion
P
a
per
|
site influenced by anthropogenic pollution during BEACHON-RoMBAS 2011, Atmos. Chem. Phys., 14, 11011–11029, doi:10.5194/acp-14-11011-2014, 2014.
Damian, V., Sandu, A., Damian, M., Potra, F., and Carmichael, G. R.: The kinetic preprocessor KPP-a software environment for solving chemical kinetics, Comput. Chem. Eng., 26, 1567– 1579, 2002.
5
Dee, D. P., Uppala, S. M., Simmons, A. J., Berrisford, P., Poli, P., and Kobayashi, S.: The ERA-Interim reanalysis: configuration and performance of the data assimilation system, Q. J. Roy. Meteor. Soc., 137, 553–597, 2011.
DiGangi, J. P., Boyle, E. S., Karl, T., Harley, P., Turnipseed, A., Kim, S., Cantrell, C., Maudlin III, R. L., Zheng, W., Flocke, F., Hall, S. R., Ullmann, K., Nakashima, Y., Paul, J. B.,
10
Wolfe, G. M., Desai, A. R., Kajii, Y., Guenther, A., and Keutsch, F. N.: First direct mea-surements of formaldehyde flux via eddy covariance: implications for missing in-canopy formaldehyde sources, Atmos. Chem. Phys., 11, 10565–10578, doi:10.5194/acp-11-10565-2011, 2011.
Ehn, M., Thornton, J. A., Kleist, E., Sipilä, M., Junninen, H., Pullinen, I., Springer, M.,
15
Rubach, F., Tillmann, R., Lee, B., Lopez-Hilfiker, F., Andres, S., Acir, I., Rissanen, M., Jokinen, T., Schobesberger, S., Kangasluoma, J., Kontkanen, J., Nieminen, T., Kurten, T., Nielsen, L. B., Jorgensen, S., Kjaergaard, H. G., Canagaratna, M., Maso, M. D., Berndt, T., Petäjä, T., Wahner, A., Kerminen, V., Kulmala, M., Worsnop, D. R., Wildt, J., and Mentel, T. F.: A large source of low-volatility secondary organic aerosol, Nature, 506, 476–479, 2014.
20
Eisele, F. L. and Tanner, D. J.: Measurement of the gas phase concentration of H2SO4 and methane sulfonic acid and estimates of H2SO4 production and loss in the atmosphere, J. Geophys. Res.-Atmos., 98, 9001–9010, doi:10.1029/93JD00031, 1993.
Fuentes, J. D., Gu, L., Lerdau, M., Atkinson, R., Baldocchi, D., Bottenheim, J. W., Ciccioli, P., Lamb, B., Geron, C., Guenther, A., Sharkey, T. D., and Stockwell, W.: Biogenic hydrocarbons
25
in the atmospheric boundary layer: a review, B. Am. Meteorol. Soc., 81, 1537–1575, 2000. Guenther, A., Hewitt, C. N., Erickson, D., Fall, R., Geron, C., Graedel, T., Harley, P., Klinger, L.,
Lerdau, M., Mckay, W. A., Pierce, T., Scholes, B., Steinbrecher, R., Tallamraju, R., Taylor, J., and Zimmerman, P.: A global model of natural volatile organic compound emissions, J. Geo-phys. Res.-Atmos., 100, 8873–8892, doi:10.1029/94JD02950, 1995.
30
ACPD
15, 9033–9075, 2015Contribution from biogenic organic
compounds to particle growth
L. Zhou et al.
Title Page
Abstract Introduction
Conclusions References
Tables Figures
◭ ◮
◭ ◮
Back Close
Full Screen / Esc
Printer-friendly Version Interactive Discussion
Discussion
P
a
per
|
Discussion
P
a
per
|
Discussion
P
a
per
|
Discussion
P
a
per
|
Aerosols from Nature), Atmos. Chem. Phys., 6, 3181–3210, doi:10.5194/acp-6-3181-2006, 2006.
Guenther, A. B., Jiang, X., Heald, C. L., Sakulyanontvittaya, T., Duhl, T., Emmons, L. K., and Wang, X.: The Model of Emissions of Gases and Aerosols from Nature version 2.1 (MEGAN2.1): an extended and updated framework for modeling biogenic emissions, Geosci.
5
Model Dev., 5, 1471–1492, doi:10.5194/gmd-5-1471-2012, 2012.
Hansel, A., Jordan, A., Holzinger, R., Prazeller, P., Vogel, W., and Lindinger, W.: Proton transfer reaction mass spectrometry: on-line trace gas analysis at the ppb level, Int. J. Mass Spec-trom., 149, 609–619, 1995.
Harley, P., Eller, A., Guenther, A., and Monson, R.: Observations and models of emissions of
10
volatile terpenoid compounds from needles of ponderosa pine trees growing in situ: control by light, temperature and stomatal conductance, Oecologia, 176, 35–55, 2014.
Hoyle, C. R., Boy, M., Donahue, N. M., Fry, J. L., Glasius, M., Guenther, A., Hallar, A. G., HuffHartz, K., Petters, M. D., Petäjä, T., Rosenoern, T., and Sullivan, A. P.: A review of the anthropogenic influence on biogenic secondary organic aerosol, Atmos. Chem. Phys., 11,
15
321–343, doi:10.5194/acp-11-321-2011, 2011.
Isidorov, V.: Organic Chemistry of the Earth’s Atmosphere, Springer-Verlag, Berlin, 1990. Jenkin, M. E., Saunders, S. M., and Pilling, M. J.: The tropospheric degradation of volatile
organic compounds: a protocol for mechanism development, Atmos. Environ., 31, 81–104, 1997.
20
Jenkin, M. E., Saunders, S. M., Wagner, V., and Pilling, M. J.: Protocol for the development of the Master Chemical Mechanism, MCM v3 (Part B): tropospheric degradation of aromatic volatile organic compounds, Atmos. Chem. Phys., 3, 181–193, doi:10.5194/acp-3-181-2003, 2003.
Junkermann, F., Platt, U., and Volz-Thomas, A.: A photoelectric detector for the measurement
25
of photolysis frequencies of ozone and other atmospheric molecules, J. Atmos. Chem., 8, 203–227, 1989.
Jung, J., Miyazaki, Y., and Kawamura, K.: Different characteristics of new particle formation between urban and deciduous forest sites in Northern Japan during the summers of 2010– 2011, Atmos. Chem. Phys., 13, 51–68, doi:10.5194/acp-13-51-2013, 2013.
30
ACPD
15, 9033–9075, 2015Contribution from biogenic organic
compounds to particle growth
L. Zhou et al.
Title Page
Abstract Introduction
Conclusions References
Tables Figures
◭ ◮
◭ ◮
Back Close
Full Screen / Esc
Printer-friendly Version Interactive Discussion
Discussion
P
a
per
|
Discussion
P
a
per
|
Discussion
P
a
per
|
Discussion
P
a
per
|
Kaser, L., Karl, T., Guenther, A., Graus, M., Schnitzhofer, R., Turnipseed, A., Fischer, L., Harley, P., Madronich, M., Gochis, D., Keutsch, F. N., and Hansel, A.: Undisturbed and dis-turbed above canopy ponderosa pine emissions: PTR-TOF-MS measurements and MEGAN 2.1 model results, Atmos. Chem. Phys., 13, 11935–11947, doi:10.5194/acp-13-11935-2013, 2013a.
5
Kaser, L., Karl, T., Schnitzhofer, R., Graus, M., Herdlinger-Blatt, I. S., DiGangi, J. P., Sive, B., Turnipseed, A., Hornbrook, R. S., Zheng, W., Flocke, F. M., Guenther, A., Keutsch, F. N., Apel, E., and Hansel, A.: Comparison of different real time VOC measurement techniques in a ponderosa pine forest, Atmos. Chem. Phys., 13, 2893–2906, doi:10.5194/acp-13-2893-2013, 2013b.
10
Kerminen, V., Virkkula, A., Hillamo, R., Wexler, A. S., and Kulmala, M.: Secondary organics and atmospheric cloud condensation nuclei production, J. Geophys. Res.-Atmos., 105, 9255– 9264, doi:10.1029/1999JD901203, 2000.
Kerminen, V., Lihavainen, H., Komppula, M., Viisanen, Y., and Kulmala, M.: Direct observational evidence linking atmospheric aerosol formation and cloud droplet activation, Geophys. Res.
15
Lett., 32, L14803, doi:10.1029/2005GL023130, 2005.
Kerminen, V.-M., Petäjä, T., Manninen, H. E., Paasonen, P., Nieminen, T., Sipilä, M., Junni-nen, H., Ehn, M., Gagné, S., Laakso, L., RiipiJunni-nen, I., Vehkamäki, H., Kurten, T., Ortega, I. K., Dal Maso, M., Brus, D., Hyvärinen, A., Lihavainen, H., Leppä, J., Lehtinen, K. E. J., Mirme, A., Mirme, S., Hõrrak, U., Berndt, T., Stratmann, F., Birmili, W., Wiedensohler, A., Metzger, A.,
20
Dommen, J., Baltensperger, U., Kiendler-Scharr, A., Mentel, T. F., Wildt, J., Winkler, P. M., Wagner, P. E., Petzold, A., Minikin, A., Plass-Dülmer, C., Pöschl, U., Laaksonen, A., and Kul-mala, M.: Atmospheric nucleation: highlights of the EUCAARI project and future directions, Atmos. Chem. Phys., 10, 10829–10848, doi:10.5194/acp-10-10829-2010, 2010.
Kim, S., Karl, T., Guenther, A., Tyndall, G., Orlando, J., Harley, P., Rasmussen, R., and Apel, E.:
25
Emissions and ambient distributions of Biogenic Volatile Organic Compounds (BVOC) in a ponderosa pine ecosystem: interpretation of PTR-MS mass spectra, Atmos. Chem. Phys., 10, 1759–1771, doi:10.5194/acp-10-1759-2010, 2010.
Kim, S., Wolfe, G. M., Mauldin, L., Cantrell, C., Guenther, A., Karl, T., Turnipseed, A., Greenberg, J., Hall, S. R., Ullmann, K., Apel, E., Hornbrook, R., Kajii, Y., Nakashima, Y.,
30
ACPD
15, 9033–9075, 2015Contribution from biogenic organic
compounds to particle growth
L. Zhou et al.
Title Page
Abstract Introduction
Conclusions References
Tables Figures
◭ ◮
◭ ◮
Back Close
Full Screen / Esc
Printer-friendly Version Interactive Discussion
Discussion
P
a
per
|
Discussion
P
a
per
|
Discussion
P
a
per
|
Discussion
P
a
per
|
dominated ecosystem, Atmos. Chem. Phys., 13, 2031–2044, doi:10.5194/acp-13-2031-2013, 2013.
Kirkby, J., Curtius, J., Almeida, J., Dunne, E., Duplissy, J., Ehrhart, S., Franchin, A., Gagne, S., Ickes, L., Kurten, A., Kupc, A., Metzger, A., Riccobono, F., Rondo, L., Schobesberger, S., Tsagkogeorgas, G., Wimmer, D., Amorim, A., Bianchi, F., Breitenlechner, M., David, A.,
Dom-5
men, J., Downard, A., Ehn, M., Flagan, R. C., Haider, S., Hansel, A., Hauser, D., Jud, W., Junninen, H., Kreissl, F., Kvashin, A., Laaksonen, A., Lehtipalo, K., Lima, J., Lovejoy, E. R., Makhmutov, V., Mathot, S., Mikkila, J., Minginette, P., Mogo, S., Nieminen, T., Onnela, A., Pereira, P., Petäjä, T., Schnitzhofer, R., Seinfeld, J. H., Sipilä, M., Stozhkov, Y., Stratmann, F., Tome, A., Vanhanen, J., Viisanen, Y., Vrtala, A., Wagner, P. E., Walther, H., Weingartner, E.,
10
Wex, H., Winkler, P. M., Carslaw, K. S., Worsnop, D. R., Baltensperger, U., and Kulmala, M.: Role of sulphuric acid, ammonia and galactic cosmic rays in atmospheric aerosol nucleation, Nature, 476, 429–433, 2011.
Korhonen, H., Lehtinen, K. E. J., and Kulmala, M.: Multicomponent aerosol dynamics model UHMA: model development and validation, Atmos. Chem. Phys., 4, 757–771,
15
doi:10.5194/acp-4-757-2004, 2004.
Kulmala, M. and Kerminen, V.: On the formation and growth of atmospheric nanoparticles, Atmos. Res., 90, 132–150, 2008.
Kulmala, M., Toivonen, A., Mäkelä, J. M., and Laaksonen, A.: Analysis of the growth of nucle-ation mode particles observed in Boreal forest, Tellus B, 50, 449–462, 1998.
20
Kulmala, M., Kerminen, V., Anttila, T., Laaksonen, A., and O’Dowd, C. D.: Organic aerosol formation via sulphate cluster activation, J. Geophys. Res.-Atmos., 109, D04205, doi:10.1029/2003JD003961, 2004a.
Kulmala, M., Laakso, L., Lehtinen, K. E. J., Riipinen, I., Dal Maso, M., Anttila, T., Kerminen, V.-M., Hõrrak, U., Vana, V.-M., and Tammet, H.: Initial steps of aerosol growth, Atmos. Chem.
25
Phys., 4, 2553–2560, doi:10.5194/acp-4-2553-2004, 2004b.
Kulmala, M., Vehkamäki, H., Petäjä, T., Dal Maso, M., Lauri, A., Kerminen, V.-M., Birmili, W., and McMurry, P. H.: Formation and growth rates of ultrafine atmospheric particles: a review of observations, J. Aerosol Sci., 35, 143–176, 2004c.
Kulmala, M., Kontkanen, J., Junninen, H., Lehtipalo, K., Manninen, H. E., Nieminen, T.,
30
Du-ACPD
15, 9033–9075, 2015Contribution from biogenic organic
compounds to particle growth
L. Zhou et al.
Title Page
Abstract Introduction
Conclusions References
Tables Figures
◭ ◮
◭ ◮
Back Close
Full Screen / Esc
Printer-friendly Version Interactive Discussion
Discussion
P
a
per
|
Discussion
P
a
per
|
Discussion
P
a
per
|
Discussion
P
a
per
|
plissy, J., Vehkamäki, H., Bäck, J., Kortelainen, A., Riipinen, I., Kurtén, T., Johnston, M. V., Smith, J. N., Ehn, M., Mentel, T. F., Lehtinen, K. E. J., Laaksonen, A., Kerminen, V., and Worsnop, D. R.: Direct observations of atmospheric aerosol nucleation, Science, 339, 943– 946, doi:10.1126/science.1227385, 2013.
Laaksonen, A., Kulmala, M., O’Dowd, C. D., Joutsensaari, J., Vaattovaara, P., Mikkonen, S.,
5
Lehtinen, K. E. J., Sogacheva, L., Dal Maso, M., Aalto, P., Petäjä, T., Sogachev, A., Yoon, Y. J., Lihavainen, H., Nilsson, D., Facchini, M. C., Cavalli, F., Fuzzi, S., Hoffmann, T., Arnold, F., Hanke, M., Sellegri, K., Umann, B., Junkermann, W., Coe, H., Allan, J. D., Alfarra, M. R., Worsnop, D. R., Riekkola, M. -L., Hyötyläinen, T., and Viisanen, Y.: The role of VOC oxi-dation products in continental new particle formation, Atmos. Chem. Phys., 8, 2657–2665,
10
doi:10.5194/acp-8-2657-2008, 2008.
Lamarque, J.-F., Bond, T. C., Eyring, V., Granier, C., Heil, A., Klimont, Z., Lee, D., Liousse, C., Mieville, A., Owen, B., Schultz, M. G., Shindell, D., Smith, S. J., Stehfest, E., Van Aar-denne, J., Cooper, O. R., Kainuma, M., Mahowald, N., McConnell, J. R., Naik, V., Riahi, K., and van Vuuren, D. P.: Historical (1850–2000) gridded anthropogenic and biomass
burn-15
ing emissions of reactive gases and aerosols: methodology and application, Atmos. Chem. Phys., 10, 7017–7039, doi:10.5194/acp-10-7017-2010, 2010.
Lauros, J., Sogachev, A., Smolander, S., Vuollekoski, H., Sihto, S.-L., Mammarella, I., Laakso, L., Rannik, Ü., and Boy, M.: Particle concentration and flux dynamics in the atmo-spheric boundary layer as the indicator of formation mechanism, Atmos. Chem. Phys., 11,
20
5591–5601, doi:10.5194/acp-11-5591-2011, 2011.
Levin, E. J. T., Prenni, A. J., Petters, M. D., Kreidenweis, S. M., Sullivan, R. C., Atwood, S. A., Ortega, J., DeMott, P. J., and Smith, J. N.: An annual cycle of size-resolved aerosol hygroscopicity at a forested site in Colorado, J. Geophys. Res.-Atmos., 117, D06201, doi:10.1029/2011jd016854, 2012.
25
Levin, E. J. T., Prenni, A. J., Palm, B. B., Day, D. A., Campuzano-Jost, P., Winkler, P. M., Krei-denweis, S. M., DeMott, P. J., Jimenez, J. L., and Smith, J. N.: Size-resolved aerosol com-position and its link to hygroscopicity at a forested site in Colorado, Atmos. Chem. Phys., 14, 2657–2667, doi:10.5194/acp-14-2657-2014, 2014.
Lindinger, W., Hansel, A., and Jordan, A.: On-line monitoring of volatile organic compounds
30