ACPD
11, 14455–14493, 2011Aging fingerprints
V. Zelenay et al.
Title Page
Abstract Introduction
Conclusions References
Tables Figures
◭ ◮
◭ ◮
Back Close
Full Screen / Esc
Printer-friendly Version Interactive Discussion
Discussion
P
a
per
|
Dis
cussion
P
a
per
|
Discussion
P
a
per
|
Discussio
n
P
a
per
|
Atmos. Chem. Phys. Discuss., 11, 14455–14493, 2011 www.atmos-chem-phys-discuss.net/11/14455/2011/ doi:10.5194/acpd-11-14455-2011
© Author(s) 2011. CC Attribution 3.0 License.
Atmospheric Chemistry and Physics Discussions
This discussion paper is/has been under review for the journal Atmospheric Chemistry and Physics (ACP). Please refer to the corresponding final paper in ACP if available.
Aging fingerprints in combustion
particles
V. Zelenay1, R. Mooser2,*, T. Tritscher3, A. Kˇrepelov ´a1, M. F. Heringa3,
R. Chirico3,**, A. S. H. Pr ´ev ˆot3, E. Weingartner3, U. Baltensperger3, J. Dommen3, B. Watts4, J. Raabe4, T. Huthwelker4, and M. Ammann1
1
Laboratory of Radiochemistry and Environmental Chemistry, Paul Scherrer Institut, 5232 Villigen PSI, Switzerland
2
EMPA, Swiss Federal Laboratories for Materials Research and Testing, Electronics/Metrology Laboratory, Ueberlandstrasse 129, 8600 D ¨ubendorf, Switzerland
3
Laboratory of Atmospheric Chemistry, Paul Scherrer Institut, 5232 Villigen PSI, Switzerland 4
Swiss Light Source, Paul Scherrer Institut, 5232 Villigen PSI, Switzerland *
now at: swissQuant Group AG, Kuttelgasse 7, 8001 Zurich, Switzerland **
now at: Italian National Agency for New Technologies, Energy and Sustainable Economic Development (ENEA), UTAPRAD-DIM, Via E. Fermi 45, 00044 Frascati, Italy
Received: 13 April 2011 – Accepted: 18 April 2011 – Published: 11 May 2011
Correspondence to: M. Ammann ([email protected])
ACPD
11, 14455–14493, 2011Aging fingerprints
V. Zelenay et al.
Title Page
Abstract Introduction
Conclusions References
Tables Figures
◭ ◮
◭ ◮
Back Close
Full Screen / Esc
Printer-friendly Version Interactive Discussion
Discussion
P
a
per
|
Dis
cussion
P
a
per
|
Discussion
P
a
per
|
Discussio
n
P
a
per
Abstract
Soot particles can significantly influence the Earth’s climate by absorbing and scatter-ing solar radiation as well as by actscatter-ing as cloud condensation nuclei. However, despite their environmental (as well as economic and political) importance, the way these prop-erties are affected by atmospheric processing is still a subject of discussion. In this
5
work, soot particles emitted from two different cars, a EURO 2 transporter, a EURO 3 passenger vehicle, and a wood stove were investigated on a single-particle basis. The emitted exhaust, including the particulate and the gas phase, was processed in a smog chamber with artificial solar radiation. Single particle specimens of both un-processed and aged soot were characterized using x-ray absorption spectroscopy and
10
scanning electron microscopy. Comparison of the spectra from the unprocessed and aged soot particles revealed changes in the carbon functional group content, such as that of carboxylic carbon, which can be ascribed to both the condensation of secondary organic compounds on the soot particles and oxidation of primary soot particles upon photochemical aging. Changes in the morphology and size of the single soot particles
15
were also observed upon aging. Furthermore, we show that the soot particles take up water in humid environments and that their water uptake capacity increases with photochemical aging.
1 Introduction
The Earth’s radiation balance is strongly affected by atmospheric aerosol particles,
20
which absorb and scatter radiation (direct effect) or act as cloud condensation nuclei (indirect effect). In contrast to most aerosols, which cool the atmosphere by scattering radiation, soot particles, containing black carbon, warm the atmosphere by absorb-ing sunlight. This contribution is estimated to be the second only to carbon dioxide (Jacobson, 2001) and depends heavily on the source of the soot particles and their
at-25
ACPD
11, 14455–14493, 2011Aging fingerprints
V. Zelenay et al.
Title Page
Abstract Introduction
Conclusions References
Tables Figures
◭ ◮
◭ ◮
Back Close
Full Screen / Esc
Printer-friendly Version Interactive Discussion
Discussion
P
a
per
|
Dis
cussion
P
a
per
|
Discussion
P
a
per
|
Discussio
n
P
a
per
|
components). Such processing can change the light scattering and absorption proper-ties (such as the single scattering albedo) of the soot particles (Adachi et al., 2010) as well as their lifetime in the atmosphere.
During atmospheric processing, the physical and chemical properties of soot parti-cles are continuously altered through condensation and evaporation of various organic
5
and inorganic compounds (Saathoffet al., 2003), coagulation with, e.g., sulfate parti-cles (Worringen et al., 2008), oxidation (Petters et al., 2006), and restructuring (Abel et al., 2003). Such processing introduces large uncertainties in the quantitative evalu-ation of the radiative forcing of atmospheric soot particles (Moffet and Prather, 2009). Therefore, because the properties of atmospheric soot particles are highly variable
10
and also strongly impact the Earth’s radiation balance, experiments that further our understanding of these particles are essential to our understanding of, and ability to accurately model, the Earth’s climate.
Coating experiments have previously been performed under defined laboratory con-ditions using, for example, carboxylic acids (Xue et al., 2009) or sulfuric acid (Zhang
15
et al., 2008), in which changes in morphology were observed. Xue et al. (2009) re-ported that coating soot particles with glutaric and succinic acid increased both light scattering (up to 3.8 fold) and light absorption (less than 1.2 fold). While such labora-tory experiments are useful in providing detailed information on the physical properties of processed particles, they do not represent the breadth of atmospheric processing
20
that environmentally relevant soot particles are subject to, which is certainly much more complex (Robinson et al., 2007; Hamilton et al., 2004; Saathoffet al., 2003; Weingart-ner et al., 1997).
Atmospheric aging of soot has been assessed via aircraft (Schwarz et al., 2008) and balloon measurements (Renard et al., 2005) and indicate a fast mixing of soot
25
ACPD
11, 14455–14493, 2011Aging fingerprints
V. Zelenay et al.
Title Page
Abstract Introduction
Conclusions References
Tables Figures
◭ ◮
◭ ◮
Back Close
Full Screen / Esc
Printer-friendly Version Interactive Discussion
Discussion
P
a
per
|
Dis
cussion
P
a
per
|
Discussion
P
a
per
|
Discussio
n
P
a
per
Filling the gap between laboratory and field studies, smog chamber experiments are ideally suited to following the evolution of secondary organic aerosols (SOA’s) gener-ated from the photo-oxidation of volatile organic compounds (VOC’s). Some examples of such experiments that are related to the present investigation, were performed with exhaust from a diesel power generator (Sage et al., 2008; Weitkamp et al., 2007) as
5
well as from biomass burning (Grieshop et al., 2009). This photochemical processing of exhaust is assumed to be the dominant soot aging mechanism, which is also directly related to the radiative properties of soot (Moffet and Prather, 2009). Therefore, smog chamber experiments provide the possibility to observe atmospheric like processing under controlled conditions (Paulsen et al., 2005).
10
This paper reports, for the first time, a combined investigation of morphological and chemical modifications, including hygroscopic properties at the single soot particle level for atmospheric like processing in a smog chamber.
2 Experimental section
2.1 Sample preparation 15
All soot samples were sampled from the smog chamber (Paulsen et al., 2005) located at the Paul Scherrer Institut (PSI), Switzerland. A detailed description of the exper-iments is given by Chirico et al. (2010) and Heringa et al. (2011) and will be only briefly described here. The smog chamber, a Teflon bag with a volume of 27 m3, is temperature controlled within the range of 20–25◦C. Sunlight irradiation is simulated
20
with four xenon arc lamps with a cutoffat 280 nm. Different online particle analysis in-struments were operated during the experiments, such as a scanning mobility particle sizer (SMPS), a volatility and hygroscopic tandem differential mobility analyzer (V/H-TDMA) (Duplissy et al., 2009; Tritscher et al., 2011), and an Aerodyne, high resolution, time-of-flight, aerosol mass spectrometer (AMS) (DeCarlo et al., 2006), to provide
com-25
ACPD
11, 14455–14493, 2011Aging fingerprints
V. Zelenay et al.
Title Page
Abstract Introduction
Conclusions References
Tables Figures
◭ ◮
◭ ◮
Back Close
Full Screen / Esc
Printer-friendly Version Interactive Discussion
Discussion
P
a
per
|
Dis
cussion
P
a
per
|
Discussion
P
a
per
|
Discussio
n
P
a
per
|
AMS measures only compounds which evaporate at 600◦C and hence, the refractory part of soot is not included in the AMS measurements.
Emissions were sampled from two different cars, a EURO 2 Volkswagen Transporter TDI Syncro from December 2000 (not equipped with a catalytic converter), a EURO 3 Opel Astra 2.0 DTA from February 2002 (equipped with a diesel oxidation catalyst
5
(DOC)), and a log wood stove (Attika Avant). The unfiltered exhaust gas of the two cars was diluted with particle-free, preheated (150◦C) air by a factor of seven immediately after emission. The exhaust was led through a heated (150◦C) injection system into the indoor smog chamber with a final dilution ratio of around 1:120 Chirico et al. (2010). The transfer and dilution system for the exhaust from the wood stove was heated to
10
80◦C. One hour after injection, the arc lamps in the smog chamber were turned on to begin irradiation. In case of the car exhaust samples, ozone was introduced into the smog chamber to oxidize NO to NO2, prior to irradiation. Once the lamps were switched on, propene (which is not a SOA precursor, Cocker et al., 2001) was added to increase the VOC/NOxratio and to raise the OH· levels. Both cars were started with
15
cold motors and were run idle during injection.
Note that the STXM-NEXAFS measurements of the aged and fresh diesel combus-tion particles stem from processes conducted on different days but with identical pro-cessing and sampling conditions. For example, AMS measurements show a compara-ble increase in organic compounds. Also note that the high resolution AMS data from
20
the EURO 3 car, i.e., O/C ratios, were taken from a separate, but identical, experiment run due to a software error during the experiments from which the STXM-NEXAFS samples were prepared.
In the wood stove experiments, the exhaust was injected into the chamber during the flaming phase and the arc lamps were switched on without the addition of ozone or
25
propene.
ACPD
11, 14455–14493, 2011Aging fingerprints
V. Zelenay et al.
Title Page
Abstract Introduction
Conclusions References
Tables Figures
◭ ◮
◭ ◮
Back Close
Full Screen / Esc
Printer-friendly Version Interactive Discussion
Discussion
P
a
per
|
Dis
cussion
P
a
per
|
Discussion
P
a
per
|
Discussio
n
P
a
per
aging, the first changes in hygroscopic properties of the soot particles were observed in the HTDMA (Hygroscopicity Tandem Differential Mobility Analyzer) and the sampling of the aged soot particles was started.
For sampling, the soot particles were pumped out of the smog chamber, with a gas-flow of about 1.2 l min−1
, charged via a corona charger and deposited
electrostat-5
ically (0.8 kV) onto a silicon nitride membrane (Silson Ltd., Northampton, UK). The membrane was glued (crystal bond, SPI suppliers, West Chester, USA) onto a small sample holder of the microreactor (see below). For the aged particles, the sampling was run for around four hours between two and six hours after the arc lamps were turned on in order to obtain a reasonable coverage of the membrane substrate. The
10
particle concentration in the smog chamber was measured to range between 10 000– 20 000 particles cm−3.
2.2 Microreactor
Exposure of the sample to various relative humidity and temperature environments dur-ing x-ray measurements in the PolLux microscope was enabled by a custom
microre-15
actor (see Huthwelker et al. (2010) for a detailed description). Briefly, the microreactor consists of two parts: the sample substrate membrane, where the submicron particles are deposited and the body of the microreactor, which includes a capping membrane and a gas flow inlet and outlet. Fixing the two halves of the microreactor results in sand-wiching the sample particles between two 50 nm thick silicon nitride membranes (with
20
about 300 µm separation) and thus within the enclosed volume of the microreactor. The membranes allow transmission of x-rays for STXM and NEXAFS measurements, while the microreactor gas inlet and outlet allows access to the enclosed volume for control of the sample environment.
The temperature of the microreactor is controlled by the combination of a heater
25
ACPD
11, 14455–14493, 2011Aging fingerprints
V. Zelenay et al.
Title Page
Abstract Introduction
Conclusions References
Tables Figures
◭ ◮
◭ ◮
Back Close
Full Screen / Esc
Printer-friendly Version Interactive Discussion
Discussion
P
a
per
|
Dis
cussion
P
a
per
|
Discussion
P
a
per
|
Discussio
n
P
a
per
|
chamber was evacuated to 10−2mbar in order to reduce attenuation of the x-ray beam. A variable portion of the gas flow through the reactor can be, if required, humidified by passing the gas over a temperature controlled water bath. The relative humidity (RH) is measured using capacative sensors, operated at room temperature, at the exit line of the microscope chamber. A thermocouple mounted at the microreactor itself is used
5
to enable corrections of the RH for the precise temperature in the microreactor. The RH can be adjusted from 0 to 95 % RH.
2.3 STXM-NEXAFS analysis
The STXM and NEXAFS analyses were performed at the PolLux beamline (Raabe et al., 2008) of the Swiss Light Source (SLS) located at the Paul Scherrer Institut.
10
Photons in the range of 200–1200 eV are provided by this beamline with an energy resolution (E/∆E) of about 3000. The end station is equipped with a STXM operated with a spatial resolution of about 40 nm for the present experiments. The calibration of the spectra was performed by measuring the well-defined transitions of polystyrene spheres at the carbon edge (Dhez et al., 2003). All soot samples were measured in
15
the microreactor (Zelenay et al., 2011a; Huthwelker et al., 2010).
To normalize the spectra and images, the Lambert-Beer law (OD=−ln(I/I0)=d µ) was used, with OD being the optical density,µthe mass absorption coefficient,d the thickness of the sample, I the transmitted light intensity through the particle, and I0 the incident light intensity (measured as the transmitted light intensity in a particle-free
20
region nearby an individual particle).
All spectra were measured in the image stack mode, i.e., a series of images at closely spaced energy steps (Jacobsen et al., 2000). These image stacks were taken in energy steps of 0.15 eV in the range of 284–292.5 eV and in 0.3 eV steps in the range of 280–284 and 292.5–320 eV, respectively at the carbon K-edge (C K-edge).
25
ACPD
11, 14455–14493, 2011Aging fingerprints
V. Zelenay et al.
Title Page
Abstract Introduction
Conclusions References
Tables Figures
◭ ◮
◭ ◮
Back Close
Full Screen / Esc
Printer-friendly Version Interactive Discussion
Discussion
P
a
per
|
Dis
cussion
P
a
per
|
Discussion
P
a
per
|
Discussio
n
P
a
per
from transmission images by applying the Lambert−Beer law. The chemical maps were generated from the absorption maps by subtracting the pre-edge absorption. The spectra were extracted using aXis2000 (Hitchcock, 2006).
2.4 Scanning electron microscope
The morphology of the particles was also analyzed using an SEM (Scanning Electron
5
Microscope) (Zeiss Supra VP55) with a resolution of 1 nm operated at a voltage of 5 kV. The analysis was performed with the soot particles collected on the same sample holder, i.e., the same day and time, as for the microspectroscopy analysis. Size distri-butions were extracted from SEM images using the equivalent projected area diameter (Merkus, 2009). This distribution was obtained by calculating the projected surface
10
area of the particles using threshold images. Qualitative observations and trends of particle sizes are discussed rather than quantitative values, although it was shown that for small agglomerates (<100 nm) this method gives reliable values (Ku and Maynard, 2005). Note that the sampling of the soot particles took about four hours so that no evo-lution of the particles sizes can be observed as with the SMPS and therefore averaged
15
SMPS size distributions are shown.
Fractal dimensions were determined from the SEM images (Ku and Maynard, 2005) using the box counting method of ImageJ, a public domain image analysis program developed at the National Institutes of Health.
2.5 HTDMA 20
In this study, data from the H-part (hygroscopicity) of the V/HTDMA are presented. Dry, monodispersed aerosols are selected in the first DMA. After exposure to high relative humidity (RH) the aerosol particles are scanned with a second DMA coupled to a CPC (Condensation Particle Counter). All instrument parts are accommodated in a temperature controlled housing. The hygroscopic growth factor (GF) is defined as
25
ACPD
11, 14455–14493, 2011Aging fingerprints
V. Zelenay et al.
Title Page
Abstract Introduction
Conclusions References
Tables Figures
◭ ◮
◭ ◮
Back Close
Full Screen / Esc
Printer-friendly Version Interactive Discussion
Discussion
P
a
per
|
Dis
cussion
P
a
per
|
Discussion
P
a
per
|
Discussio
n
P
a
per
|
The V/H-TDMA is equipped with a pre-humidification system in front of the first DMA. Particles are exposed to very high RH close to 100 % before they are dried and size selected. Turning the pre-humidifier on allows restructuring of the fractal soot. The oc-currence of restructuring can be identified when periods with and without pre-humidifier show a different GF.
5
3 Results and discussion
3.1 Particle morphology and size distribution
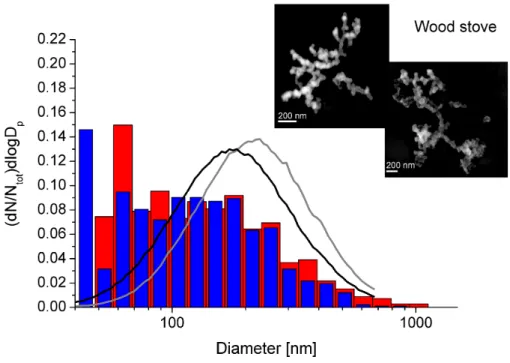
Number size distributions of wood combustion particles are shown in Fig. 1. The blue bars represent the size distribution extracted from SEM images of fresh particles. For comparison, the SMPS size distribution is added to the plot as a black line. All size
10
distributions are normalized by the total number of particles. The size distribution of the projected area diameter for aged particles is shown with red bars. Again, the SMPS size distribution plot is added, colored grey. The SMPS data show that the mean electrical mobility diameter of the fresh particles is 190 nm. The evaluation of the size distribution using SEM images shows that most particles have a size between 60
15
and 250 nm with a tail reaching up to about 700 nm. The aged particles show slightly larger diameters and also a tail reaching towards larger diameters (1 µm). This is in agreement with the SMPS data, which shows a shift in diameter to around 240 nm. Obviously, the amount of small particles is somewhat overestimated. This may be re-lated to the way the soot particles were sampled. Also note that two different kinds of
20
calculations were used to obtain the size data. We used 2-D microscopic images to obtain a diameter, while the SMPS measures the electrical mobility diameter, see also Ku and Maynard (2005). Figure 1 also illustrates SEM images of single wood com-bustion particles. The left SEM image illustrates two fresh wood comcom-bustion particles, the right one an aged particle. A typical wood combustion particle consists of primary
25
ACPD
11, 14455–14493, 2011Aging fingerprints
V. Zelenay et al.
Title Page
Abstract Introduction
Conclusions References
Tables Figures
◭ ◮
◭ ◮
Back Close
Full Screen / Esc
Printer-friendly Version Interactive Discussion
Discussion
P
a
per
|
Dis
cussion
P
a
per
|
Discussion
P
a
per
|
Discussio
n
P
a
per
(Vernooij et al., 2009; Kocbach et al., 2005). Because the exhaust of the wood burning was sampled during the flaming phase, no tar balls were found (Vernooij et al., 2009).
The aged wood combustion particles show very often a partly collapsed chain-like structure, especially in large particles (>800 nm) as shown in Fig. 1, but the calculated fractal dimensions remains unchanged within error. 1.81 (±0.08) was measured for
5
fresh particles and 1.84 (±0.06) for aged particles. It should be noted, however, that this result may be somehow biased by the fact that semivolatile secondary organic aerosol may have evaporated in the high vacuum of the SEM, such that the actual fractal dimension of the aged particles may be higher.
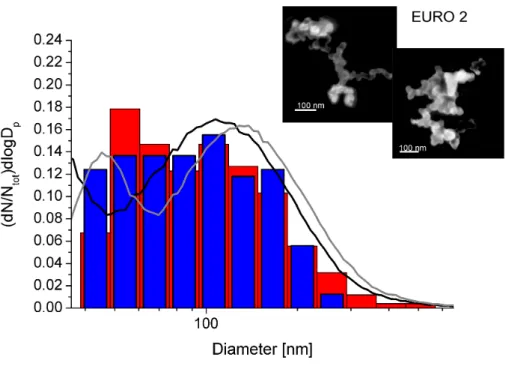
Figure 2 illustrates the different particle number size distributions from the EURO
10
2 car exhaust. The color code is the same as described for Fig. 1. The evaluation of the SEM images from fresh particles shows that most particle sizes are found be-tween 40 nm and 200 nm, also here a small tailing to around 250 nm is observed. The aged particles show a size distribution up to 600 nm. The SMPS measurements show an increase in the mean electrical mobility diameter from 85 nm for fresh particles to
15
125 nm upon aging in the smog chamber. Again, SEM images of single particles are depicted in the Figure. Consistent with other authors (Adachi et al., 2007; van Poppel et al., 2005; Kis et al., 2006), primary particles are found with a size of about 30–40 nm aggregated in chains. Inspections by eye do not reveal changes in aggregation of the particles, which is supported by the evaluation of the fractal dimensions revealing 1.84
20
(±0.03) for fresh and 1.85 (±0.05) for processed particles, respectively.
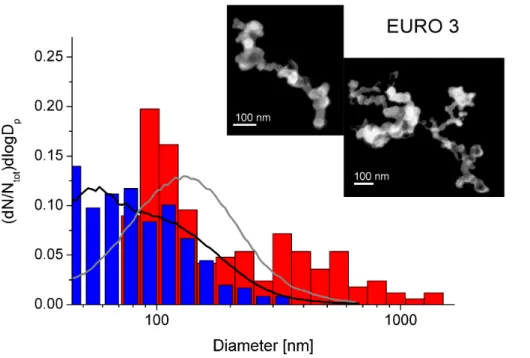
Figure 3 shows the particle size distributions of the EURO 3 passenger car exhaust. The symbols and colors are explained in conjunction with Fig. 1. While the fresh parti-cles have sizes between 50 and 200 nm, comparable to the partiparti-cles emitted from the EURO 2 transporter, the aged particles show sizes around 100 nm with a second mode
25
ACPD
11, 14455–14493, 2011Aging fingerprints
V. Zelenay et al.
Title Page
Abstract Introduction
Conclusions References
Tables Figures
◭ ◮
◭ ◮
Back Close
Full Screen / Esc
Printer-friendly Version Interactive Discussion
Discussion
P
a
per
|
Dis
cussion
P
a
per
|
Discussion
P
a
per
|
Discussio
n
P
a
per
|
might also stem from coagulation on the substrate being enhanced due to electrostatic effects during sampling. SEM images of a single particle each are added in the his-togram. Again, the primary particles of fresh and aged soot show the typical size of about 30–40 nm as observed for the transporter. Also in this case, no changes of the aggregation of the soot chains upon soot aging were observed, which is supported by
5
the fractal dimensions being 1.87 (±0.03) for fresh soot particles and 1.87 (±0.03) for aged particles. Small changes in the fractal dimensions in the wood stove combus-tion particles indicate collapsing of the soot chains. The morphology of soot particles stemming from the cars do not seem to be influenced significantly by aging.
The equivalent projected area diameter shows, in general, a comparable particle size
10
distribution as measured by the SMPS and the size increases were also reproduced. These results confirm that the 150–200 nm diameter particles that were chosen for STXM analysis were representative of the total particle populations.
3.2 STXM-NEXAFS characterization
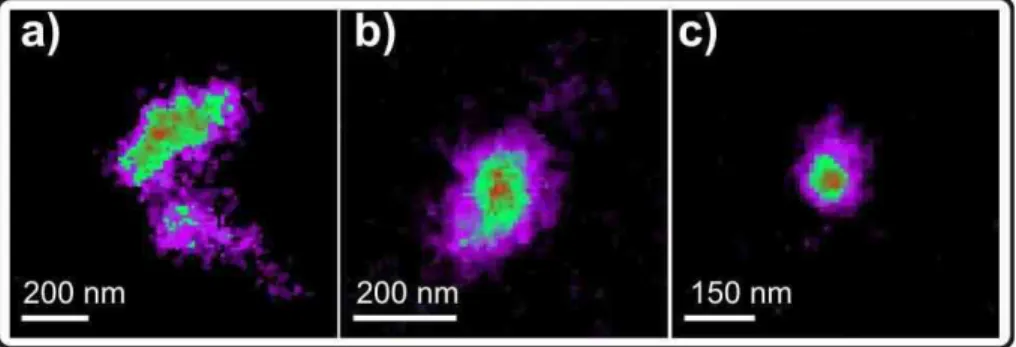
Figure 4 illustrates STXM absorption maps of soot particles from the wood stove (left
15
panel), from the EURO 2 transporter (middle panel) and from the EURO 3 passenger car (right panel).
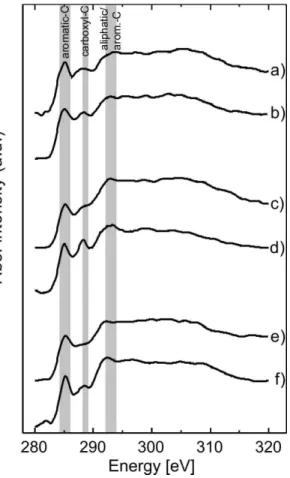
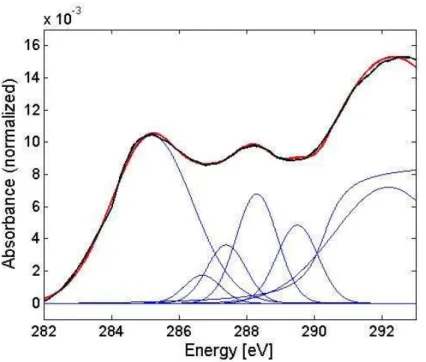
NEXAFS spectra from the single particles are shown in Fig. 5. Each spectrum is taken from the average of a spatial area within a single particle, using the image-stacks described above. Specific chemical species were quantified from the spectra by
fit-20
ting with Gaussian functions representing characteristic near-edge resonances (Outka and St ¨ohr, 1988), using resonance positions adopted from Hopkins et al. (2007). The peak energies were fixed at the C 1s→ π⋆ transition of aromatic carbon in benzo-quinone (benzo-quinone-C, 284.2 eV), the unsaturated carbon (aromatic-C, 285.2 eV), the phenolic or ketone carbon (phenol-C, 286.7 eV), the carboxylic carbon (carboxyl-C,
25
ACPD
11, 14455–14493, 2011Aging fingerprints
V. Zelenay et al.
Title Page
Abstract Introduction
Conclusions References
Tables Figures
◭ ◮
◭ ◮
Back Close
Full Screen / Esc
Printer-friendly Version Interactive Discussion
Discussion
P
a
per
|
Dis
cussion
P
a
per
|
Discussion
P
a
per
|
Discussio
n
P
a
per
shows the NEXAFS spectrum of an aged wood combustion particle. A broad absorp-tion feature at 305 eV indicates a highπ-bond conjugation (Diaz and Hussain, 2007). Due to the inhomogeneous composition of soot small shifts in the maxima of the tran-sition energies of the single particles are expected. But only the maxima of the peak intensities at 285.3, 288.3 and 292 eV could be unambiguously distinguished for the
5
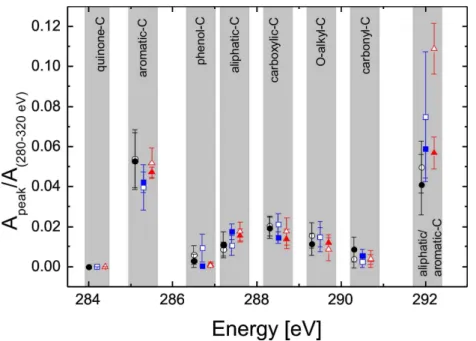
fit of the spectrum. The maximum of the unsaturated carbon peak shifted from 285.1 to 285.3 eV, while the transition of the carboxyl carbon was assigned between 288.3– 288.4 eV. The aliphatic/aromatic-C peak shifted from 292 to 292.2 eV. Note that these energy shifts are close to the energy resolution of the beamline. All other maxima were fixed at the aforementioned values. The peak fitting results are presented in Fig. 7.
An-10
other uncertainty is introduced by the arctangent function representing the ionization edge, whereby the height and slope of this function are unknown for the single parti-cles. Since it can be assumed that more than only one ionization energy is found for the broad variety of carbon species (Outka and St ¨ohr, 1988), the uncertainty is difficult to estimate. The spectra were normalized via the area of the whole spectrum.
15
Spectrum a) in Fig. 5 shows the averaged NEXAFS spectrum of the fresh wood com-bustion particle. A distinct absorption at 285 eV and at 292 eV suggests a high aromatic content in the combustion particles. Further, an absorption in the carboxyl-C region (288.5 eV) can be observed, which suggests also a high content in carboxyl-C. The Gaussian fit analysis shown in Fig. 7 demonstrates that the absorption from
quinone-20
C (284.2 eV) is absent. Furthermore, the analysis shows that fresh wood combustion particles exhibit small absorption at the phenolic-C energy but high transition inten-sity from carbonyl-C. However, also alkyl- and O-alkyl-C are involved in the absorption spectrum. Spectrum b) in Fig. 5 shows the averaged spectrum of the correspond-ing aged particles. Again, high absorption intensities are found at 285 and 292 eV,
25
ACPD
11, 14455–14493, 2011Aging fingerprints
V. Zelenay et al.
Title Page
Abstract Introduction
Conclusions References
Tables Figures
◭ ◮
◭ ◮
Back Close
Full Screen / Esc
Printer-friendly Version Interactive Discussion
Discussion
P
a
per
|
Dis
cussion
P
a
per
|
Discussion
P
a
per
|
Discussio
n
P
a
per
|
(Fig. 5) at 285 divided by the peak height at 292 eV is used to quantify the degree of graphitization in carbonaceous materials (di Stasio and Braun, 2006). This ratio slightly decreases in this case from 0.84 to 0.80 upon aging indicating an increase in alkyl-C and decrease in aromatic-C, which includes also unsaturated carbon. AMS measure-ments performed by Heringa et al. (2011) showed a slight increase atm/z 44, which
5
is attributed to carboxylic groups (CO+2), from 10.1 to 10.3 % which correspond well to our carboxyl measurements. The AMS data also shows that photo-oxidation increases the organic carbon by a factor of 3 compared to primary particles. As this increase is significant but yet the NEXAFS spectra do not reveal strong changes in the functional groups, we can conclude that the condensed species show in general similar chemical
10
fingerprints as the fresh particles but with slightly increased carboxyl-C, alkyl-C or O-alkyl-C and less carbonyl-C. Spectrum c) in Fig. 5 shows an averaged spectrum of the fresh soot particles emitted from the EURO 2 transporter. A high absorption intensity at 285.2 eV can be observed. The steep increase at 292 eV and the absorption at 305 eV show the high degree of conjugation from large PAHs, graphene and graphite type
15
moieties. A weak absorption is found at around 288.3 eV that indicates a low degree of oxidization of the soot particles. The fitting analysis (Fig. 7) shows strong particle to particle variability in the absorption intensities of the aromatic carbon, especially the absorption intensity at 292 eV. Again, the fitting analysis shows no evidence for phenol-or quinone-C absphenol-orption.
20
The spectrum of the aged particles depicted in trace d of Fig. 5 show a slightly higher aromatic content with an absorption feature at 305 eV. The ratio of the peak height at 285 divided by the peak height at 292 eV increases upon aging, from 0.63 to 0.72, indi-cating a decrease in alkyl-C, which is consistent with the AMS measurements (Chirico et al., 2010), and increase in unsaturated carbon, respectively. The carboxylic-C at
25
ACPD
11, 14455–14493, 2011Aging fingerprints
V. Zelenay et al.
Title Page
Abstract Introduction
Conclusions References
Tables Figures
◭ ◮
◭ ◮
Back Close
Full Screen / Esc
Printer-friendly Version Interactive Discussion
Discussion
P
a
per
|
Dis
cussion
P
a
per
|
Discussion
P
a
per
|
Discussio
n
P
a
per
mass while in the aged particles a fraction of 5.4 % is observed. This increase inm/z
44 may be explained by the condensation of photo-chemically aged compounds. The organic mass was shown to increase by a factor of around 4 in this experiment due to formation of SOA. Therefore, we conclude that this increase in carboxylic-C in the NEXAFS spectra is mostly likely due to such organic compounds. Besides the highly
5
oxidized carbon compounds that condense on the soot particles, the aged particles show a high content of unsaturated and phenolic carbon which might also stem from oligomerization and aldol type condensation reactions. Aldol condensation requires acidic conditions, but also ammonium salts and carbonate salts were shown to be effi -cient catalysts for similar aggregation reactions in atmospheric aerosols (Nozi `ere et al.,
10
2010). Thus, particulate phase aging processes may be the result of both the conden-sation of gas phase species and chemical processes initiated within the condensed phase (Zelenay et al., 2011b).
The averaged spectrum (Fig. 5e) of the unprocessed soot of the passenger car shows also a high absorption of the aromatic carbon at 285.2, as well as at 292 and
15
305 eV. Again, this points to a high graphitic content in these particles (Diaz and Hus-sain, 2007). As already observed in the other fresh particles emitted from the trans-porter, the absorption intensity of the carboxyl-C is low and no phenol-C nor quinone-C absorption is observed. This is confirmed by the fitting analysis. The corresponding spectrum of the aged particles is shown in Fig. 5f). An increase in the absorption
20
intensity of the carboxyl-C region is observed, which is also supported by the AMS measurements revealing an increase in the carboxyl content from 1.6 % in fresh soot particles to a content of 3.2 % in aged particles. This increase was accompanied by a comparably small increase in the aromatic-C at 285.2 and 292 eV in the NEXAFS spectra. The Gaussian fitting analysis, displayed in Fig. 7, confirms the aforementioned
25
ACPD
11, 14455–14493, 2011Aging fingerprints
V. Zelenay et al.
Title Page
Abstract Introduction
Conclusions References
Tables Figures
◭ ◮
◭ ◮
Back Close
Full Screen / Esc
Printer-friendly Version Interactive Discussion
Discussion
P
a
per
|
Dis
cussion
P
a
per
|
Discussion
P
a
per
|
Discussio
n
P
a
per
|
Additionally, it shows that no phenol-C and quinone-C evolved during the processing in the smog chamber. As in this case the AMS observed only a slight increase in organic mass by around 25 % from the starting concentration, we need to take into account that also primary soot particles might have been oxidized upon aging in the smog chamber and are jointly responsible for the observed changes in the NEXAFS
5
spectrum. Therefore, the increase in carboxylic-C might also stem from primary parti-cle oxidation and not necessarily from the oxidized organic compounds that condensed on the soot particle. The increase of the alkyl-C must have originated from condensed organic compounds as there is no other source available that could reasonably explain this increase.
10
Additionally, O to C ratios can be calculated by comparing the pre-edge (280 eV) and the post-edge absorption (320 eV) with the attenuation coefficients taken from Chantler (Chantler, 1995) and assuming only carbon and oxygen being present in the soot parti-cles. A ratio (and corresponding standard deviation) of 0.30 (±0.22) for fresh and 0.35 (±0.30) for aged wood combustion particles is found confirming only small additional
15
incorporation of oxygen in the particles. Comparable values are revealed from AMS data, which showed a ratio of 0.35 for fresh wood combustion particles and a ratio of 0.40 for processed particles. Note, that only compounds that evaporate at 600◦C are measured with the AMS. The diesel combustion particles show a lower O/C ratio of 0.16 (±0.39) for fresh and 0.32 (±0.27) for the aged EURO 2 diesel exhaust particles.
20
This is consistent with the addition of carboxyl-C and phenol-C in the particles as ob-served in the NEXAFS spectra. The AMS data reveal an O/C ratio of 0.1 for fresh and 0.34 for aged particles. Ratios of 0.12 (±0.13) for the fresh and 0.25 (±0.18) for aged particles emitted from the EURO 3 passenger car were found, consistent with AMS data (0.1 for fresh and 0.22 for processed particles). These values are consistent
25
ACPD
11, 14455–14493, 2011Aging fingerprints
V. Zelenay et al.
Title Page
Abstract Introduction
Conclusions References
Tables Figures
◭ ◮
◭ ◮
Back Close
Full Screen / Esc
Printer-friendly Version Interactive Discussion
Discussion
P
a
per
|
Dis
cussion
P
a
per
|
Discussion
P
a
per
|
Discussio
n
P
a
per
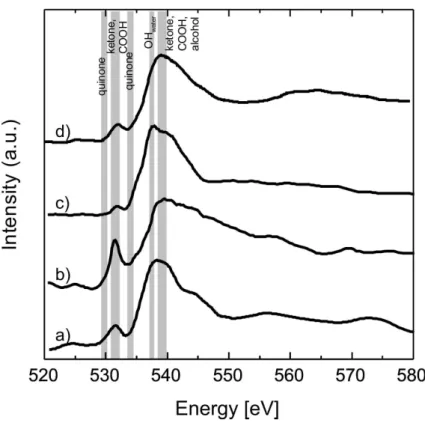
3.3 Water uptake in soot particles
The water uptake behavior of the different soot particles was investigated via NEXAFS spectra measured at the oxygen edge and images measured at the oxygen edge and carbon pre-edge. The carbon NEXAFS analysis revealed a relatively low O/C ratio in most of the single soot particles. A NEXAFS analysis at the oxygen edge was impeded
5
by the low oxygen content in the dry particles which lead to low absorption and insuffi -cient statistics for clear spectra. The O K-edge spectra reported below were measured for the aged wood stove sample at 0 % and 90 % RH and the fresh wood combustion particles at 90 % RH as well as for the aged soot from the EURO 2 transporter at 90 % RH. The spectra at the oxygen edge were only obtained from 2–3 particles, selected
10
for having sufficient absorption at the oxygen edge and therefore may not be entirely representative.
Spectrum a) in Fig. 8 shows the oxygen spectrum of unprocessed wood stove soot measured at 90 % RH. The main absorption is found at 538.2 eV, which is attributed to the transition of ketone-, carboxyl- or alcohol-O. A second absorption is found at around
15
532 eV. This absorption intensity is assigned to the O 1s→π⋆ transition of carboxyl-and ketone-O (Hopkins et al., 2007). Spectrum b) is from the aged soot sample from the wood stove at 0 % RH, which also displays a strong absorption peaks centered at 532 eV and 539 eV, and are attributed to the transitions of the aforementioned oxygenic functional groups. Spectrum c) is also from an aged wood combustion particle as b) but
20
measured at 90 % RH. This spectrum strongly resembles that of liquid water (Tzvetkov et al., 2008; Cavalleri et al., 2002; Wernet et al., 2004). Since water does not absorb at 532 eV, this peak is strongly diminished and indicates the dilution of the organic compounds (Myneni et al., 2002; Naslund et al., 2005; Wernet et al., 2004). Figure 8 d) shows the spectrum of the EURO 2 transporter exhaust particles, measured at 90 %
25
ACPD
11, 14455–14493, 2011Aging fingerprints
V. Zelenay et al.
Title Page
Abstract Introduction
Conclusions References
Tables Figures
◭ ◮
◭ ◮
Back Close
Full Screen / Esc
Printer-friendly Version Interactive Discussion
Discussion
P
a
per
|
Dis
cussion
P
a
per
|
Discussion
P
a
per
|
Discussio
n
P
a
per
|
Therefore, significant amounts of water were absorbed by the aged wood combustion particles, but not by the car exhaust particles. Interestingly, while potassium salts are expected to be associated with wood combustion particles and which can be expected to participate in water uptake, the characteristic potassium double peak near 300 eV was not observed in the C-edge spectra. The other spectra shown in Fig. 8 measured
5
at high humidity did not exhibit the typical features of water either and so we conclude that the amount of water absorbed by the particles of these particular two soot samples was low, without formation of a substantial aqueous phase. Images of individual soot particles were recorded at different RH in order to quantify water uptake. As described above, the oxygen content was too low in certain soot particles, so that measurements
10
at the oxygen edge were not possible in many cases. Therefore, the changes in the pre-edge region at the carbon edge were used to map the water uptake in particles with low oxygen content. The advantage here is that the particle positions are determined using the x-ray absorption at the carbon edge and hence there is no pre-selection bias towards oxygen content of the dry particles. Nevertheless, note that the contribution
15
of oxygen to absorption at the carbon pre-edge remains small and therefore also the differences in absorption intensity at various RH. Therefore, criteria for detecting water uptake were defined, which include (1) a consistent change of the absorption intensity of the single particles with varying RH; this means that the absorption increased simul-taneously with RH and vice versa, and (2) larger than 10 % difference in the absorption
20
intensities of the single particle upon water uptake. No changes in the soot morphology were observed upon water uptake. The expected small changes upon restructuring are beyond the spatial resolving power of STXM as operated in the present experiments. The time steps in between the different RH settings were chosen to be at least 30 min before the measurements were continued in order to allow the water uptake to reach
25
equilibrium.
ACPD
11, 14455–14493, 2011Aging fingerprints
V. Zelenay et al.
Title Page
Abstract Introduction
Conclusions References
Tables Figures
◭ ◮
◭ ◮
Back Close
Full Screen / Esc
Printer-friendly Version Interactive Discussion
Discussion
P
a
per
|
Dis
cussion
P
a
per
|
Discussion
P
a
per
|
Discussio
n
P
a
per
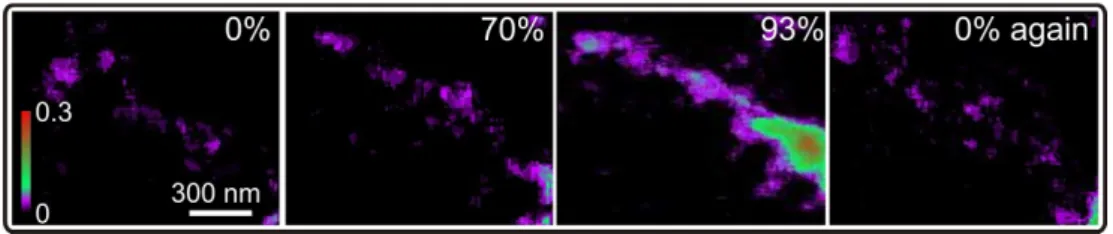
at 93 % RH. A very high uptake can be observed in some parts of the soot structure, which is colored in green and red. Here, an averaged water column of about 40 nm per image pixel is observed (assuming a density of 1 g cm−3). In the other regions of the particle, an average water column of around 10 nm is observed. Returning again to 0 % RH, the absorption decreases to the initial values. From 16 investigated
parti-5
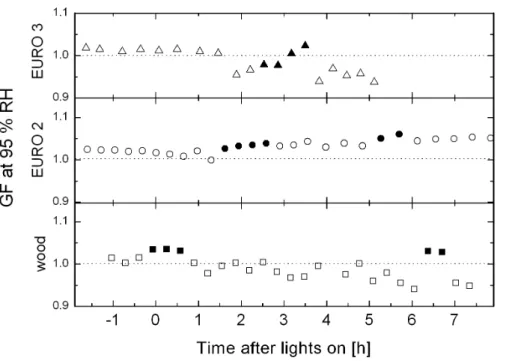
cles/structures, 11 were found to take up water. The unprocessed wood particles were also measured, but the absorption intensity was inconsistent during changes of RH and so the evaluation of these data has been omitted. The HTDMA measurements, shown in Fig. 10, indicate a restructuring of the soot particles after exposure to 95 % RH. A GF of 0.95 was measured after six hours. Although a strong restructuring was
10
observed indicating a compaction of the aged soot particles under high RH, after pre-humidification a GF of only 1.03 was measured (Fig. 10), indicating little water uptake. Note that the HTDMA measures the electrical mobility diameter (equivalent diameter calculated from the mobility of the charged particles in the carrier gas). In contrast, the x-ray absorption measurements quantify the water uptake in terms of mass, which is a
15
better indicator of water uptake in these particles. Figure 11 shows the water uptake in a fresh particle of the EURO 2 transporter. These images were measured at the carbon pre-edge at 0 %, 80 %, 90 % and again at 0 % RH. The increase in absorption intensity can be already observed at 80 % with some additional increase in absorption at 90 % RH. After returning the RH to 0 %, the absorption intensity was observed in this case
20
to not fully decrease to the initial level. This residual additional absorption could stem from either x-ray radiation damage or residual water trapped in the soot particle due to irreversible transformation of the soot particle during “swelling” (Popovicheva et al., 2008). However, we find an average water column of 15 nm in this soot particle at 90 % RH. The particle is calculated to have an average thickness of around 55 nm assuming
25
a density of 1 cm3g−1for the dry carbon backbone. From the 10 investigated particles, 3 particles were found to take up water.
ACPD
11, 14455–14493, 2011Aging fingerprints
V. Zelenay et al.
Title Page
Abstract Introduction
Conclusions References
Tables Figures
◭ ◮
◭ ◮
Back Close
Full Screen / Esc
Printer-friendly Version Interactive Discussion
Discussion
P
a
per
|
Dis
cussion
P
a
per
|
Discussion
P
a
per
|
Discussio
n
P
a
per
|
was observed in 12 particles. The aging in the smog chamber showed a shift from a low uptake capability of fresh soot particles to a higher uptake capability in aged particles. This increase in particle hygroscopicity was also measured with the HTDMA, see Fig. 10. A GF of 1.02 was measured before processing of the soot particles and a GF of 1.04 was observed after 5 h of processing (the observed GF increased further
5
to 1.06 with pre-humidification).
Figure 12 shows an example of an unprocessed soot particle from the EURO 3 pas-senger car. This combustion particle was measured at 0 %, 85 % and returning to 0 % RH again. No significant change in x-ray absorbance was observed at any of the three RH levels. In other words, no water uptake was observed in any of the unprocessed
10
EURO 3 exhaust particles investigated. In half of the aged particles emitted from the passenger car, water associated within the particle was observed at 90 % RH, in agree-ment with the HTDMA measureagree-ments. While the fresh soot particles did not show any change in GF (GF≈1.01), GFs of 0.96 and 1 without and with phumidification, re-spectively, were observed after processing in the smog chamber and a restructuring,
15
caused by the condensation of oxidized compounds.
It is essential to understand the physical and chemical properties of soot particles in order to model their influence on the climate. The physical properties include size and morphology of the soot particles. In these experiments, we observed an increase in particle size calculated using the projected surface area from SEM images of soot
par-20
ticles. An increase of the mean particle size from 85 nm to 125 nm such as observed in the processing of wood combustion particles, could increase the single scattering albedo by about 50 % (Moffet and Prather, 2009). The calculated fractal dimensions of the soot particles indicate that their morphology did not change significantly. One reason might be that a larger amount of hydrophilic compounds need to be condensed
25
ACPD
11, 14455–14493, 2011Aging fingerprints
V. Zelenay et al.
Title Page
Abstract Introduction
Conclusions References
Tables Figures
◭ ◮
◭ ◮
Back Close
Full Screen / Esc
Printer-friendly Version Interactive Discussion
Discussion
P
a
per
|
Dis
cussion
P
a
per
|
Discussion
P
a
per
|
Discussio
n
P
a
per
almost a factor of 1.3 (Mikhailov et al., 2006). The spectroscopic analysis of the inves-tigated single soot particles revealed a high variability in the chemical composition of the particles. This variability makes a general description of soot particles very difficult. Additionally, a high impact on the particle chemistry of after-treatment devices like the oxidation catalyst in diesel cars was found. For example, less condensation of oxidized
5
organic compounds was observed on soot particles emitted from diesel cars with an after-treatment device. For the wood combustion particles, no substantial differences in the absorption spectra were observed. Therefore, the combustion source and the corresponding after-treatment devices are important factors to describe the chemical composition of the single particles. Such factors influence their absorption and
scat-10
tering (Mikhailov et al., 2006) as well as their CCN behavior. An important indicator for the CCN activity is, besides their size, their water uptake behavior at subsaturated con-ditions. So we showed that fresh diesel cars without any after treatment can take up water while soot particles treated with after-treatment device did not show substantial water uptake.
15
4 Conclusions
Single particle analysis was performed on fresh and aged wood combustion and diesel exhaust particles using scanning transmission x-ray spectro-microscopy and SEM analysis. The use of a custom reactor cell allowed in-situ exposure to varying rela-tive humidity environments and hence the analysis of water uptake behavior in single
20
particles. Two different cars, a EURO 2 transporter and a EURO 3 passenger car, and a wood stove were chosen as combustion sources. Aging of the particles was performed in a smog chamber. Analysis of the particle morphology reveals that all par-ticles increased in size upon photochemical aging. Using NEXAFS spectroscopy, we found that in wood combustion particles the chemical fingerprints of unaged particles
25
ACPD
11, 14455–14493, 2011Aging fingerprints
V. Zelenay et al.
Title Page
Abstract Introduction
Conclusions References
Tables Figures
◭ ◮
◭ ◮
Back Close
Full Screen / Esc
Printer-friendly Version Interactive Discussion
Discussion
P
a
per
|
Dis
cussion
P
a
per
|
Discussion
P
a
per
|
Discussio
n
P
a
per
|
carbonyl-C content. Aging of the particles from the EURO 2 car lead to a higher con-tent in unsaturated carbon as well as a higher concon-tent in phenols and carboxyl carbon, indicating that both condensation of oxidized species from the gas phase as well as par-ticle phase chemical processes contributed to the composition of aged parpar-ticles. The EURO 3 car particles revealed only small changes in the spectra upon
photochemi-5
cal aging due to either condensation from the gas phase or oxidation of primary soot. Furthermore, we showed that the water uptake behavior upon processing changed. We found that after processing the number of particles taking up water increased in accordance with HTDMA measurements. These changes can be directly related to the chemical fingerprints measured with NEXAFS. Therefore, the increased amount of
10
carboxyls/phenols stemming either from direct oxidation of the soot particles or from condensation of organic compounds on the soot particles lead to higher water uptake ability of the particles.
Acknowledgements. The SEM measurements were performed in the Laboratory for Mikro- und Nanotechnology at the PSI, especially Anja Weber is acknowledged. The NEXAFS
measure-15
ments were performed at the Swiss Light Source (SLS), Paul Scherrer Institut, Switzerland. The PolLux end station was financed by the Deutsches Ministerium f ¨ur Bildung und Forschung (BMBF), contract 05 KS4WE1/6. This work was supported by the Competence Center in En-ergy and Mobility (CCEM-CH) through the project NEADS. We thank M. Birrer for technical support and Lisa Pfaffenberger for insightful discussions. We also thank the Federal Offices
20
ACPD
11, 14455–14493, 2011Aging fingerprints
V. Zelenay et al.
Title Page
Abstract Introduction
Conclusions References
Tables Figures
◭ ◮
◭ ◮
Back Close
Full Screen / Esc
Printer-friendly Version Interactive Discussion
Discussion
P
a
per
|
Dis
cussion
P
a
per
|
Discussion
P
a
per
|
Discussio
n
P
a
per
References
Abel, S. J., Haywood, J. M., Highwood, E. J., Li, J., and Buseck, P. R.: Evolution of biomass burning aerosol properties from an agricultural fire in southern Africa, Geophys. Res. Lett., 30, 1783–1786, 2003. 14457
Adachi, K., Chung, S. H., Friedrich, H., and Buseck, P. R.: Fractal parameters of individual
5
soot particles determined using electron tomography: Implications for optical properties, J. Geophys. Res.-Atmos., 112, D14202, doi:10.1029/2006JD008296, 2007. 14464
Adachi, K., Chung, S. H., and Buseck, P. R.: Shapes of soot aerosol particles and implications for their effects on climate, J. Geophys. Res., 115, D15206, 0148–0227, 2010. 14457 Cavalleri, M., Ogasawara, H., Pettersson, L. G. M., and Nilsson, A.: The interpretation of X-ray
10
absorption spectra of water and ice, Chem. Phys. Lett., 364, 363–370, 2002. 14470
Chantler, C. T.: Theoretical Form-Factor, Attenuation and Scattering Tabulation forZ=1–92 fromE=1–10 eV toE=0.4–1.0 MeV, J. Phys. Chem. Ref. Data, 24, 71–591, 1995. 14469 Chirico, R., DeCarlo, P. F., Heringa, M. F., Tritscher, T., Richter, R., Pr ´ev ˆot, A. S. H., Dommen,
J., Weingartner, E., Wehrle, G., Gysel, M., Laborde, M., and Baltensperger, U.: Impact
15
of aftertreatment devices on primary emissions and secondary organic aerosol formation potential from in-use diesel vehicles: results from smog chamber experiments, Atmos. Chem. Phys., 10, 11545–11563, doi:10.5194/acp-10-11545-2010, 2010. 14458, 14459, 14467 Cocker, D. R., Mader, B. T., Kalberer, M., Flagan, R. C., and Seinfeld, J. H.: The effect of
water on gas-particle partitioning of secondary organic aerosol: II. m-xylene and
1,3,5-20
trimethylbenzene photooxidation systems, Atmos. Environ., 35, 6073–6085, 2001. 14459 DeCarlo, P. F., Kimmel, J. R., Trimborn, A., Northway, M. J., Jayne, J. T., Aiken, A. C.,
Go-nin, M., Fuhrer, K., Horvath, T., Docherty, K. S., Worsnop, D. R., and Jimenez, J. L.: Field-deployable, high-resolution, time-of-flight aerosol mass spectrometer, Anal. Chem., 78, 8281–8289, 2006. 14458
25
Dhez, O., Ade, H., and Urquhart, S. G.: Calibrated NEXAFS spectra of some common poly-mers, J. Electron. Spectrosc. Relat. Phenom., 128, 85–96, 2003. 14461
di Stasio, S. and Braun, A.: Comparative NEXAFS study on soot obtained from an ethylene/air flame, a diesel engine, and graphite, Energy Fuels, 20, 187–194, 2006. 14467
Diaz, J., O. R. M. and Hussain, Z.: Structure of amorphous carbon from
near-30
ACPD
11, 14455–14493, 2011Aging fingerprints
V. Zelenay et al.
Title Page
Abstract Introduction
Conclusions References
Tables Figures
◭ ◮
◭ ◮
Back Close
Full Screen / Esc
Printer-friendly Version Interactive Discussion
Discussion
P
a
per
|
Dis
cussion
P
a
per
|
Discussion
P
a
per
|
Discussio
n
P
a
per
|
Duplissy, J., Gysel, M., Sjogren, S., Meyer, N., Good, N., Kammermann, L., Michaud, V., Weigel, R., Martins dos Santos, S., Gruening, C., Villani, P., Laj, P., Sellegri, K., Metzger, A., McFiggans, G. B., Wehrle, G., Richter, R., Dommen, J., Ristovski, Z., Baltensperger, U., and Weingartner, E.: Intercomparison study of six HTDMAs: results and recommendations, Atmos. Meas. Tech., 2, 363–378, doi:10.5194/amt-2-363-2009, 2009. 14458
5
Grieshop, A. P., Logue, J. M., Donahue, N. M., and Robinson, A. L.: Laboratory investigation of photochemical oxidation of organic aerosol from wood fires 1: measurement and simulation of organic aerosol evolution, Atmos. Chem. Phys., 9, 1263–1277, doi:10.5194/acp-9-1263-2009, 2009. 14458
Hamilton, J. F., Webb, P. J., Lewis, A. C., Hopkins, J. R., Smith, S., and Davy, P.: Partially
10
oxidised organic components in urban aerosol using GCXGC-TOF/MS, Atmos. Chem. Phys., 4, 1279–1290, doi:10.5194/acp-4-1279-2004, 2004. 14457
Heringa, M. F., DeCarlo, P. F., Chirico, R., Tritscher, T., Dommen, J., Weingartner, E., Richter, R., Wehrle, G., Prevot, A. S. H., and Baltensperger, U.: Investigations of primary and sec-ondary particulate matter of different wood combustion appliances with a high-resolution
15
time-of-flight aerosol mass spectrometer, Atmos. Chem. Phys. Discuss., 11, 8081–8113, doi:10.5194/acpd-11-8081-2011, 2011. 14458, 14467
Hitchcock, A.: Analysis of X-ray Images and Spectra, 2006. 14462
Hopkins, R., Tivanski, A. V., Marten, B. D., and Gilles, M. K.: Chemical bonding and structure of black carbon reference materials and individual carbonaceous atmospheric aerosol, J.
20
Aerosol Sci., 38, 573–591, 2007. 14465, 14470
Huthwelker, T., Zelenay, V., Birrer, M., Krepelova, A., Raabe, J., Tzvetkov, G., Vernooij, M. G. C., and Ammann, M.: An in situ cell to study phase transitions in individual aerosol particles on a substrate using scanning transmission x-ray microspectroscopy, Rev. Sci. Instrum., 81, 113706-9, doi:10.1063/1.3494604, 2010. 14460, 14461
25
Jacobsen, C., Wirick, S., Flynn, G., and Zimba, C.: Soft X-ray spectroscopy from image se-quences with sub-100 nm spatial resolution, Journal of Microscopy-Oxford, 197, 173–184, 2000. 14461
Jacobson, M. Z.: Strong radiative heating due to the mixing state of black carbon in atmospheric aerosols, Nature, 409, 695–697, 2001. 14456
30
doi:10.5194/acp-5-ACPD
11, 14455–14493, 2011Aging fingerprints
V. Zelenay et al.
Title Page
Abstract Introduction
Conclusions References
Tables Figures
◭ ◮
◭ ◮
Back Close
Full Screen / Esc
Printer-friendly Version Interactive Discussion
Discussion
P
a
per
|
Dis
cussion
P
a
per
|
Discussion
P
a
per
|
Discussio
n
P
a
per
3033-2005, 2005. 14457
Kis, V. K., Psfai, M., and L ´ab ´ar, J. L.: Nanostructure of atmospheric soot particles, Atmos. Environ., 40, 5533–5542, 2006. 14464
Kocbach, A., Johansen, B. V., Schwarze, P. E., and Namork, E.: Analytical electron microscopy of combustion particles: a comparison of vehicle exhaust and residential wood smoke, Sci.
5
Total Environ., 346, 231–243, 2005. 14464
Ku, B. K. and Maynard, A. D.: Comparing aerosol surface-area measurements of monodis-perse ultrafine silver agglomerates by mobility analysis, transmission electron microscopy and diffusion charging, J. Aerosol Sci., 36, 1108–1124, doi:10.1016/j.jaerosci.2004.12.003, 2005. 14462, 14463
10
Merkus, H.: Particle size measurements: fundamentals, practice, quality, Springer, Dodrecht, 2009. 14462
Mikhailov, E., Vlasenko, S. S., Podgorny, I. A., Ramanathan, V., and Corrigan, C. E.: Optical properties of soot – water drop agglomerates: An experimental study, J. Geophys. Res, 111, D07209, doi:10.1029/2005JD006389, 2006. 14473, 14474
15
Moffet, R. C. and Prather, K. A.: In-situ measurements of the mixing state and optical properties of soot with implications for radiative forcing estimates, P. Natl. Acad. Sci., 106, 11872– 11877, 2009. 14457, 14458, 14473
Myneni, S., Luo, Y., Naslund, L. A., Cavalleri, M., Ojamae, L., Ogasawara, H., Pelmenschikov, A., Wernet, P., Vaterlein, P., Heske, C., Hussain, Z., Pettersson, L. G. M., and Nilsson,
20
A.: Spectroscopic probing of local hydrogen-bonding structures in liquid water, J. Phys.-Condensed Matter, 14, L213–L219, 2002. 14470
Naslund, L. A., Luning, J., Ufuktepe, Y., Ogasawara, H., Wernet, P., Bergmann, U., Pettersson, L. G. M., and Nilsson, A.: X-ray Absorption Spectroscopy Measurements of Liquid Water, J. Phys. Chem. B, 109, 13835–13839, 2005. 14470
25
Nozi `ere, B., Dziedzic, P., and C ´ordova, A.: Inorganic ammonium salts and carbonate salts are efficient catalysts for aldol condensation in atmospheric aerosols, Phys. Chem. Chem. Phys., 12, 3864–3872, 2010. 14468
Outka, D. A. and St ¨ohr, J.: Curve Fitting Analysis of near-Edge Core Excitation-Spectra of Free, Adsorbed, and Polymeric Molecules, J. Chem. Phys., 88, 3539–3554, 1988. 14465, 14466
30
ACPD
11, 14455–14493, 2011Aging fingerprints
V. Zelenay et al.
Title Page
Abstract Introduction
Conclusions References
Tables Figures
◭ ◮
◭ ◮
Back Close
Full Screen / Esc
Printer-friendly Version Interactive Discussion
Discussion
P
a
per
|
Dis
cussion
P
a
per
|
Discussion
P
a
per
|
Discussio
n
P
a
per
|
and physics, Environ. Sci. Technol., 39, 2668–2678, 2005. 14458
Petters, M. D., Prenni, A. J., Kreidenweis, S. M., DeMott, P. J., Matsunaga, A., Lim, Y. B., and Ziemann, P. J.: Chemical aging and the hydrophobic-to-hydrophilic conversion of carbona-ceous aerosol, Geophys. Res. Lett., 33, L24806, doi:10.1029/2006GL027249, 2006. 14457 Popovicheva, O., Persiantseva, N. M., Shonija, N. K., DeMott, P., Koehler, K., Petters, M.,
5
Kreidenweis, S., Tishkova, V., Demirdjian, B., and Suzanne, J.: Water interaction with hy-drophobic and hydrophilic soot particles, Phys. Chem. Chem. Phys., 10, 2332–2344, 2008. 14472
Raabe, J., Tzvetkov, G., Flechsig, U., Boge, M., Jaggi, A., Sarafimov, B., Vernooij, M. G. C., Huthwelker, T., Ade, H., Kilcoyne, D., Tyliszczak, T., Fink, R. H., and Quitmann, C.: PolLux:
10
A new facility for soft x-ray spectromicroscopy at the Swiss Light Source, Rev. Sci. Instrum., 79, 113704, doi:10.1063/1.3021472, 2008. 14461
Renard, J. B., Ovarlez, J., Berthet, G., Fussen, D., Vanhellemont, F., Brogniez, C., Hadam-cik, E., Chartier, M., and Ovarlez, H.: Optical and physical properties of stratospheric aerosols from balloon measurements in the visible and near-infrared domains. III. Presence
15
of aerosols in the middle stratosphere, Appl. Opt., 44, 4086–4095, 2005. 14457
Robinson, A. L., Donahue, N. M., Shrivastava, M. K., Weitkamp, E. A., Sage, A. M., Grieshop, A. P., Lane, T. E., Pierce, J. R., and Pandis, S. N.: Rethinking organic aerosols: Semivolatile emissions and photochemical aging, Science, 315, 1259–1262, 2007. 14457
Saathoff, H., Naumann, K. H., Schnaiter, M., Schock, W., Mohler, O., Schurath, U.,
Weingart-20
ner, E., Gysel, M., and Baltensperger, U.: Coating of soot and (NH4)(2)SO4 particles by ozonolysis products of alpha-pinene, J. Aerosol Sci., 34, 1297–1321, 2003. 14457
Sage, A. M., Weitkamp, E. A., Robinson, A. L., and Donahue, N. M.: Evolving mass spec-tra of the oxidized component of organic aerosol: results from aerosol mass spectrometer analyses of aged diesel emissions, Atmos. Chem. Phys., 8, 1139–1152,
doi:10.5194/acp-8-25
1139-2008, 2008. 14458
Schwarz, J. P., Spackman, J. R., Fahey, D. W., Gao, R. S., Lohmann, U., Stier, P., Watts, L. A., Thomson, D. S., Lack, D. A., Pfister, L., Mahoney, M. J., Baumgardner, D., Wilson, J. C., and Reeves, J. M.: Coatings and their enhancement of black carbon light absorption in the tropical atmosphere, J. Geophys. Res.-Atmos., 113, D03203, doi:10.1029/2007JD009042,
30
2008. 14457
ACPD
11, 14455–14493, 2011Aging fingerprints
V. Zelenay et al.
Title Page
Abstract Introduction
Conclusions References
Tables Figures
◭ ◮
◭ ◮
Back Close
Full Screen / Esc
Printer-friendly Version Interactive Discussion
Discussion
P
a
per
|
Dis
cussion
P
a
per
|
Discussion
P
a
per
|
Discussio
n
P
a
per
hygroscopicity of aging secondary organic aerosol in a smog chamber, Atmos. Chem. Phys. Discuss., 11, 7423–7467, doi:10.5194/acpd-11-7423-2011, 2011. 14458
Tzvetkov, G., Graf, B., Fernandes, P., Fery, A., Cavalieri, F., Paradossi, G., and Fink, R. H.: In situ characterization of gas-filled microballoons using soft X-ray microspectroscopy, Soft Matter, 4, 510–514, 2008. 14470
5
van Poppel, L. H., Friedrich, H., Spinsby, J., Chung, S. H., Seinfeld, J. H., and Buseck, P. R.: Electron tomography of nanoparticle clusters: Implications for atmospheric lifetimes and ra-diative forcing of soot, Geophys. Res. Lett., 32, L24811, doi:10.1029/2005GL024461, 2005. 14464
Vernooij, M. G. C., Mohr, M., Tzvetkov, G., Zelenay, V., Huthwelker, T., Kaegi, R., Gehrig, R.,
10
and Grobety, B.: On Source Identification and Alteration of Single Diesel and Wood Smoke Soot Particles in the Atmosphere; An X-Ray Microspectroscopy Study, Environ. Sci. Technol., 43, 5339–5344, 2009. 14464
Weingartner, E., Burtscher, H., and Baltensperger, U.: Hygroscopic properties of carbon and diesel soot particles, Atmos. Environ., 31, 2311–2327, 1997. 14457
15
Weitkamp, E. A., Sage, A. M., Pierce, J. R., Donahue, N. M., and Robinson, A. L.: Organic Aerosol Formation from Photochemical Oxidation of Diesel Exhaust in a Smog Chamber, Environ. Sci. Technol., 41, 6969–6975, 2007. 14458
Wernet, P., Nordlund, D., Bergmann, U., Cavalleri, M., Odelius, M., Ogasawara, H., Naslund, L. A., Hirsch, T. K., Ojamae, L., Glatzel, P., Pettersson, L. G. M., and Nilsson, A.: The
20
structure of the first coordination shell in liquid water, Science, 304, 995–999, 2004. 14470 Worringen, A., Ebert, M., Trautmann, T., Weinbruch, S., and Helas, G.: Optical properties of
internally mixed ammonium sulfate and soot particles–a study of individual aerosol particles and ambient aerosol populations, Appl. Opt., 47, 3835–3845, 2008. 14457
Xue, H. X., Khalizov, A. F., Wang, L., Zheng, J., and Zhang, R. Y.: Effects of dicarboxylic acid
25
coating on the optical properties of soot, Phys. Chem. Chem. Phys., 11, 7869–7875, 2009. 14457
Zelenay, V., Ammann, M., Krepelova, A., Birrer, M., Tzvetkov, G., Vernooij, M. G. C., Raabe, J., and Huthwelker, T.: Direct observation of water uptake and release in individual submicrom-eter sized ammonium sulfate and ammonium sulfate/adipic acid particles using X-ray
mi-30
crospectroscopy, J. Aerosol Sci., 42, 38–51, 0021-8502 doi:10.1016/j.jaerosci.2010.11.001, 2011a. 14461
ACPD
11, 14455–14493, 2011Aging fingerprints
V. Zelenay et al.
Title Page
Abstract Introduction
Conclusions References
Tables Figures
◭ ◮
◭ ◮
Back Close
Full Screen / Esc
Printer-friendly Version Interactive Discussion
Discussion
P
a
per
|
Dis
cussion
P
a
per
|
Discussion
P
a
per
|
Discussio
n
P
a
per
|
M.: UV/Vis radiation increases steady-state uptake of ozone on soot, J. Geophys. Res., doi:10.1029/2010JD015500, in press, 2011b. 14468
Zhang, R. Y., Khalizov, A. F., Pagels, J., Zhang, D., Xue, H. X., and McMurry, P. H.: Variability in morphology, hygroscopicity, and optical properties of soot aerosols during atmospheric processing, P. Natl. Acad. Sci., 105, 10291–10296, 2008. 14457
ACPD
11, 14455–14493, 2011Aging fingerprints
V. Zelenay et al.
Title Page
Abstract Introduction
Conclusions References
Tables Figures
◭ ◮
◭ ◮
Back Close
Full Screen / Esc
Printer-friendly Version Interactive Discussion
Discussion
P
a
per
|
Dis
cussion
P
a
per
|
Discussion
P
a
per
|
Discussio
n
P
a
per
|
ACPD
11, 14455–14493, 2011Aging fingerprints
V. Zelenay et al.
Title Page
Abstract Introduction
Conclusions References
Tables Figures
◭ ◮
◭ ◮
Back Close
Full Screen / Esc
Printer-friendly Version Interactive Discussion
Discussion
P
a
per
|
Dis
cussion
P
a
per
|
Discussion
P
a
per
|
Discussio
n
P
a
per
|
Fig. 4. STXM absorption images, measured at 320 eV, of aged soot particles emitted from(a)