ACPD
14, 12591–12634, 2014Secondary Organic Aerosol
D. F. Zhao et al.
Title Page
Abstract Introduction
Conclusions References
Tables Figures
◭ ◮
◭ ◮
Back Close
Full Screen / Esc
Printer-friendly Version Interactive Discussion
Discussion
P
a
per
|
D
iscussion
P
a
per
|
Discussion
P
a
per
|
Discuss
ion
P
a
per
|
Atmos. Chem. Phys. Discuss., 14, 12591–12634, 2014 www.atmos-chem-phys-discuss.net/14/12591/2014/ doi:10.5194/acpd-14-12591-2014
© Author(s) 2014. CC Attribution 3.0 License.
Atmospheric Chemistry and Physics
Open Access
Discussions
This discussion paper is/has been under review for the journal Atmospheric Chemistry and Physics (ACP). Please refer to the corresponding final paper in ACP if available.
Secondary Organic Aerosol (SOA)
formation from hydroxyl radical oxidation
and ozonolysis of monoterpenes
D. F. Zhao1, M. Kaminski1, P. Schlag1, H. Fuchs1, I.-H. Acir1, B. Bohn1, R. Häseler1, A. Kiendler-Scharr1, F. Rohrer1, R. Tillmann1, M. J. Wang1, R. Wegener1, J. Wildt2, A. Wahner1, and T. F. Mentel1
1
Institute of Energy and Climate Research, IEK-8: Troposphere, Forschungszentrum Jülich, Jülich, 52425, Germany
2
Institute of Bio- and Geosciences, IBG-2, Forschungszentrum Jülich, Jülich, 52425, Germany
Received: 25 April 2014 – Accepted: 6 May 2014 – Published: 16 May 2014
Correspondence to: T. F. Mentel (t.mentel@fz-juelich.de)
Published by Copernicus Publications on behalf of the European Geosciences Union.
ACPD
14, 12591–12634, 2014Secondary Organic Aerosol
D. F. Zhao et al.
Title Page
Abstract Introduction
Conclusions References
Tables Figures
◭ ◮
◭ ◮
Back Close
Full Screen / Esc
Printer-friendly Version Interactive Discussion
Discussion
P
a
per
|
D
iscussion
P
a
per
|
Discussion
P
a
per
|
Discuss
ion
P
a
per
|
Abstract
Oxidation by hydroxyl radical (OH) and ozonolysis are the two major pathways of day-time biogenic volatile organic compounds (VOCs) oxidation and secondary organic aerosol (SOA) formation. In this study, we investigated the particle formation of several common monoterpenes (α-pinene,β-pinene, and limonene) by OH dominated oxida-5
tion, which has seldom been investigated. OH oxidation experiments were carried out in the SAPHIR chamber in Jülich, Germany, at low NOx (0.01–1 ppbV) and low ozone (O3) concentration. OH concentration and OH reactivity were measured directly so that the overall reaction rates of organic compounds with OH were quantified. Multi-generation reaction process, particle growth, new particle formation, particle yield, and 10
chemical composition were analyzed and compared with that of monoterpene ozonol-ysis. Multi-generation products were found to be important in OH dominated SOA for-mation. The relative role of functionalization and fragmentation in the reaction process of OH oxidation was analyzed by examining the particle mass and the particle size as a function of OH dose. We developed a novel method which quantitatively links parti-15
cle growth to the reaction of OH with organics in a reaction system. This method was also used to analyze the evolution of functionalization and fragmentation of organics in the particle formation by OH oxidation. It shows that functionalization of organics was dominant in the beginning of the reaction (within two lifetimes of the monoterpene) and fragmentation started to be dominant after that. We compared particle formation 20
from OH oxidation with that from pure ozonolysis. In individual experiments, growth rates of the particle size did not necessarily correlate with the reaction rate of monoter-pene with OH and O3. Comparing the size growth rates at the similar reaction rates of monoterpene with OH or O3indicates that generally, OH oxidation and ozonolysis had similar efficiency in particle growth. The SOA yield ofα-pinene and limonene by ozonol-25
ysis was higher than that of OH oxidation. Aerosol mass spectrometry (AMS) shows SOA elemental composition from OH oxidation follows a slope shallower than −1 in
ACPD
14, 12591–12634, 2014Secondary Organic Aerosol
D. F. Zhao et al.
Title Page
Abstract Introduction
Conclusions References
Tables Figures
◭ ◮
◭ ◮
Back Close
Full Screen / Esc
Printer-friendly Version Interactive Discussion
Discussion
P
a
per
|
D
iscussion
P
a
per
|
Discussion
P
a
per
|
Discuss
ion
P
a
per
|
hydrogen. SOA from OH oxidation had higher H/C ratios than SOA from ozonolysis. In ozonolysis, a process with significant hydrogen loss seemed to play an important role in SOA formation.
1 Introduction
As an important class of atmospheric aerosol, organic aerosol (OA) comprises a signif-5
icant fraction of aerosol mass. It accounts for around 50 % of dry tropospheric submi-cron aerosol mass in many urban and rural locations (Kanakidou et al., 2005; Jimenez et al., 2009; Zhang et al., 2011). OA has an important impact on air pollution, human health and climate on the regional and global scale. A large fraction of organic aerosol is contributed by secondary organic aerosol (SOA). In spite of intensive studies in the 10
recent years, the source of SOA still has considerable uncertainties with the estimated global source ranging from 120 to 1820 Tg a−1
(Hallquist et al., 2009; Spracklen et al., 2011; Goldstein and Galbally, 2007). SOA is believed to mainly originate from the bio-genic volatile organic compounds (BVOCs) from plants (Hallquist et al., 2009). Among them, monoterpenes are important due to their high emission rates and high reactivity 15
(Chung and Seinfeld, 2002; Guenther et al., 1995, 2012).
The impact of SOA on the radiation budget of the Earth thus on climate depends on its particle number concentration, size distribution and composition, which affect optical properties and cloud condensation nuclei (CCN) activity of an aerosol (Andreae and Rosenfeld, 2008). Understanding particle formation and growth is therefore critical for 20
assessing the impact of SOA.
Particle formation and growth from BVOC are mainly initiated by hydroxyl radical (OH) and ozone (O3) oxidation during daytime. SOA formation from ozonolysis of sev-eral monoterpenes such as α-pinene, β-pinene and limonene has been studied ex-tensively (Iinuma et al., 2005; Presto et al., 2005; Shilling et al., 2009; Yu et al., 1999; 25
Ortega et al., 2012; Saathoffet al., 2009; Tillmann et al., 2010; Hoffmann et al., 1997; Griffin et al., 1999; Lee et al., 2006; Ma et al., 2008). However, particle formation from
ACPD
14, 12591–12634, 2014Secondary Organic Aerosol
D. F. Zhao et al.
Title Page
Abstract Introduction
Conclusions References
Tables Figures
◭ ◮
◭ ◮
Back Close
Full Screen / Esc
Printer-friendly Version Interactive Discussion
Discussion
P
a
per
|
D
iscussion
P
a
per
|
Discussion
P
a
per
|
Discuss
ion
P
a
per
|
OH oxidation of monoterpenes has been much less investigated and pure OH oxidation of monoterpenes has seldom been investigated due to the presence of O3 formed in the photooxidation process (Eddingsaas et al., 2012; Ng et al., 2007; Lee et al., 2006). SOA formation from pure OH oxidation of monoterpenes regarding the reaction pro-cess such as the formation and role of multi-generation products, and the influence of 5
OH oxidation on particle growth is not clear. Particularly, despite the importance of the OH oxidation in the particle formation, the quantitative effect of OH oxidation on parti-cle growth is not available. Here we focus on the SOA formation from OH oxidation of monoterpenes.
It is also interesting to compare the relative importance of OH oxidation with ozonol-10
ysis of monoterpenes in particle nucleation and growth. A number of studies have in-vestigated this question (Bonn and Moortgat, 2002; Burkholder et al., 2007; Hao et al., 2009; Mentel et al., 2009), but often at high VOC concentrations and the results are controversial. Some studies have shown the importance of ozonolysis in new particle formation (NPF) (Bonn and Moortgat, 2002) while others have emphasized the impor-15
tance of OH oxidation (Burkholder et al., 2007; Hao et al., 2009; Mentel et al., 2009). Studies at the simulation chamber JPAC (Jülich Plant Aerosol Atmosphere Chamber) suggest OH and H2SO4 are needed to initiate NPF (Mentel et al., 2009; Kiendler-Scharr et al., 2009a, 2012; Ehn et al., 2014). Ehn et al. (2014) suggest thatα-pinene ozonolysis produces a class of extreme low volatile organic compounds (ELVOC), a re-20
cently discovered highly oxidized multifunctional products, which are important for the nucleation and possibly make up 50–100 % of SOA in early stages of particle growth in Hyytiälä (Ehn et al., 2012). Regarding particle growth, Burkholder et al. (2007) stated that particle size growth rates for different oxidation sources are nearly indistinguish-able. Yet, Hao et al. (2009), using the real BVOC emissions from plants, showed a much 25
ACPD
14, 12591–12634, 2014Secondary Organic Aerosol
D. F. Zhao et al.
Title Page
Abstract Introduction
Conclusions References
Tables Figures
◭ ◮
◭ ◮
Back Close
Full Screen / Esc
Printer-friendly Version Interactive Discussion
Discussion
P
a
per
|
D
iscussion
P
a
per
|
Discussion
P
a
per
|
Discuss
ion
P
a
per
|
and growth is that the OH oxidation and ozonolysis have seldom been separated when comparing the SOA formation from both pathways.
In addition, the reaction rates of OH and O3with organics have to be quantified and comparable when one investigates the relative role of OH oxidation and ozonolysis in particle formation. To obtain the reaction rates of VOCs with OH, the OH concentra-5
tion is a required parameter. However, none of these previous studies directly mea-sured the OH concentration, which was either not stated or just modeled. Since the detailed chemistry, including HOx generation pathways, of BVOC photooxidation is still not well understood, modeled OH concentrations may have significant uncertainties (Fuchs et al., 2013; Kaminiski, 2014; Kim et al., 2013; Whalley et al., 2011). Conse-10
quently, the relative importance of OH oxidation and ozonolysis in particle formation and growth may have large uncertainties when the comparison of both cases is based on modeled OH concentrations and corresponding reaction rates with OH.
In this study, we investigated the SOA formation and growth of several common monoterpenes,α-pinene,β-pinene and limonene, by OH oxidation at ambient relevant 15
conditions. The OH oxidation experiments were conducted at low O3 concentration to ensure that OH oxidation was the dominant reaction pathway. OH concentration was measured directly, as was the total reactivity (kOH) of whole the reaction system with respect to OH, so that the overall reaction rates of organics with OH were directly quantified (Lou et al., 2010). Direct derivation of the overall reaction rate of organ-20
ics with OH (product of OH reactivity from organics and the OH concentration) from measured parameters is a unique feature of this study. The multi-generation reaction process, particle growth, new particle formation, particle yield, and particle composi-tion were analyzed. A novel method which quantitatively established the relacomposi-tionship of particle mass growth rate with the reaction rate with OH was developed for the first 25
time here to the best of our knowledge. This method was further used to analyze the multi-generation reaction process. Particle formation by OH oxidation was compared with that by ozonolysis. Ozonolysis experiments were done in the presence of CO as OH scavenger, so that ozonolysis was the dominant reaction pathway at still ambient
ACPD
14, 12591–12634, 2014Secondary Organic Aerosol
D. F. Zhao et al.
Title Page
Abstract Introduction
Conclusions References
Tables Figures
◭ ◮
◭ ◮
Back Close
Full Screen / Esc
Printer-friendly Version Interactive Discussion
Discussion
P
a
per
|
D
iscussion
P
a
per
|
Discussion
P
a
per
|
Discuss
ion
P
a
per
|
relevant HO2/ RO2ratios. The relative roles of OH oxidation and ozonolysis in the SOA formation and particle growth were evaluated from comparisons of OH and O3 domi-nated experiments. In particular, we used low VOC concentration (∼4 ppb) with natural
sunlight conditions resulting in low particle loading (sub µg m−3
to several µg m−3
). The low particle loading allowed us to investigate the particle formation, particle growth 5
and multi-generation reaction process under ambient relevant conditions (Presto and Donahue, 2006; Shilling et al., 2008, 2009; Pathak et al., 2007). It also minimized the condensation of early generation products with low oxidation state which is of little relevance for ambient conditions (Shilling et al., 2009; Pfaffenberger et al., 2013).
2 Experimental 10
2.1 Experiment setup and instrumentation
The experiments were carried out in the outdoor atmosphere simulation chamber SAPHIR (Simulation of Atmospheric PHotochemistry In a large Reaction chamber), Forschungszentrum Jülich, Germany. SAPHIR is a 270 m3 double-wall Teflon cham-ber of cylindrical shape. The details of the chamcham-ber have been previously described 15
(Rohrer et al., 2005; Bohn et al., 2005). The chamber uses natural sunlight as light source and is equipped with a louvre system to simulate dark processes when louvre is closed. It is operated with high purity synthetic air (Linde Lipur, purity 99.9999 %). A continuous flow of 7–9 m3h−1
maintains the chamber at a slight overpressure of
∼50 Pa and compensates for the sampling losses by various instruments. This flow
20
causes dilution of the reaction mixture with clean air at an average loss rate coeffi -cient of 9.35×10⁻⁶s−1(residence time of∼30 h), agreeing well with the dilution rates
determined from measured H2O and CO2time series. Pure nitrogen (Linde Lipur, pu-rity 99.9999 %) constantly flushes the space between the inner and outer Teflon wall to prevent intrusion of contaminants into the chamber. A fan ensures mixing of trace 25
ACPD
14, 12591–12634, 2014Secondary Organic Aerosol
D. F. Zhao et al.
Title Page
Abstract Introduction
Conclusions References
Tables Figures
◭ ◮
◭ ◮
Back Close
Full Screen / Esc
Printer-friendly Version Interactive Discussion
Discussion
P
a
per
|
D
iscussion
P
a
per
|
Discussion
P
a
per
|
Discuss
ion
P
a
per
|
alone applies equally to suspended particles and gases. Particles in the chamber are subject to additional wall losses as reported previously (Salo et al., 2011; Fry et al., 2011). Size effects of the particle loss were neglected here because of the narrow size distribution (geometric standard deviation<1.3).
For the experiments described here, the chamber was equipped with instrumentation 5
characterizing gas-phase and particle-phase species, as well as physical parameters including temperature, relative humidity, flow rate and photolysis frequencies.
The actinic flux and the according photolysis frequencies were provided from mea-surements of a spectral radiometer (Bohn et al., 2005). NO and NO2 measurements were performed with a chemiluminescence analyzer (ECO PHYSICS TR480) equipped 10
with a photolytic converter (ECO PHYSICS PLC760). O3was measured by an UV ab-sorption spectrometer (ANSYCO model O341M). The concentrations of the VOCs were measured by a proton transfer reaction- mass spectrometer (PTR-MS, Ionicon) (Jor-dan et al., 2009) and gas chromatography coupled to a mass spectrometer (GC-MS, PerkinElmer) (Apel et al., 2008; Kaminiski, 2014). In the ozonolysis experiments, reac-15
tions of VOCs with O3in the sample line were found to cause additional monoterpene loss. Monoterpene concentrations were therefore also quantified from initial monoter-pene concentrations and the losses by reaction according to the reaction rate of O3 with monoterpenes determined from measured O3and by dilution.
OH, HO2, and RO2radicals were measured using laser induced fluorescence (LIF). 20
The uncertainty of the OH measurement, determined by the accuracy of the calibration of the LIF instrument, is 10 % (1σ). The details of LIF instrument were described by Fuchs et al. (2012). The OH radicals inside SAPHIR are mainly formed by the photol-ysis of HONO coming off the walls, and to a minor fraction by O3 photolysis (Rohrer et al., 2005). OH reactivity (kOH) was measured also using LIF and laser flash photoly-25
sis (Lou et al., 2010). The OH concentration was used to calculate the OH dose in order to better compare different experiments. The OH dose is the integral of the OH con-centration over time and gives the cumulated OH concon-centrations to which gases and particles were exposed at a given time of an experiment. One hour exposure to typical
ACPD
14, 12591–12634, 2014Secondary Organic Aerosol
D. F. Zhao et al.
Title Page
Abstract Introduction
Conclusions References
Tables Figures
◭ ◮
◭ ◮
Back Close
Full Screen / Esc
Printer-friendly Version Interactive Discussion
Discussion
P
a
per
|
D
iscussion
P
a
per
|
Discussion
P
a
per
|
Discuss
ion
P
a
per
|
atmospheric OH concentrations of 2×10⁶molecules cm−3 results in an OH dose of
7.2×10⁹molecules cm−3s. The OH concentration and OH reactivity were also used to
calculate the reaction rate of OH with all organics.
Particle size distributions were measured by a scanning mobility particle sizer (SMPS, TSI DMA3081/TSI CPC3785) with a size range 9.82–414.2 nm. Aerosol yield 5
was calculated using SMPS mass concentration assuming a density of 1 g cm−3
to compare with previous studies in the literature. The particle mass concentration cor-rected for dilution and wall loss is shown here unless otherwise stated.
The chemical composition of SOA was characterized by a High-Resolution Time-of-Flight Aerosol Mass Spectrometer (HR-ToF-AMS, Aerodyne Research Inc., DeCarlo 10
et al., 2006). Particles enter the instrument through an aerodynamic lens and are fo-cused to a particle beam. The particles impact on a tungsten oven at 600◦
C and are flash-vaporized into vapors under vacuum. The vapors are then ionized by 70 eV elec-tron impact (EI), and the resulting ions are detected by a time-of-flight mass spectrome-ter operating at either a high-sensitivity mode (V-mode) or a high mass resolution mode 15
(W-mode). In this study we used the so-called MS mode which gets the size integrated overall composition of SOA.
To characterize the degree of oxidation of particles, the O/C ratio was obtained. The O/C and H/C ratio was derived by the elemental analysis of mass spectra obtained in the high mass resolution W-mode as described by Aiken et al. (2007) and (2008). 20
An updated procedure to calculate O/C and H/C was reported to be in development (Canagaratna et al., 2014). However, the details have not been published yet, there-fore, the traditional method is still used here to derive the elemental ratio. Corrections for the minor influence of gaseous components were done before the calculation of the H/C and O/C ratio. Chamber air contains CO2 and water vapor and both gas phase 25
ACPD
14, 12591–12634, 2014Secondary Organic Aerosol
D. F. Zhao et al.
Title Page
Abstract Introduction
Conclusions References
Tables Figures
◭ ◮
◭ ◮
Back Close
Full Screen / Esc
Printer-friendly Version Interactive Discussion
Discussion
P
a
per
|
D
iscussion
P
a
per
|
Discussion
P
a
per
|
Discuss
ion
P
a
per
|
the particle signals before the elemental analysis (Allan et al., 2004). No collection efficiency correction was further used.
2.2 Experiment procedure
Two kinds of experiments, photooxidation and ozonolysis of monoterpenes were car-ried out under humid conditions with a starting RH∼75 %. The summary of the
ex-5
perimental conditions is shown in Table 1. All the experiments were conducted under NOx<∼1 ppb. No NOx was added to the chamber, and background NOx originated
mainly from the wall. In the photooxidation experiments, the O3 concentration was
<3 ppb at the start of each experiment and did not exceed 20 ppb over the course of an experiment. The OH oxidation was the dominant oxidation pathway (>∼95 % of
10
monoterpene loss). In a typical procedure, air in the chamber was first humidified and then the louvre system was opened for around 1.5 h. Afterwards monoterpene was injected and the reaction of monoterpene with OH occurred. After the photooxidation process, which was finished by closing the louvre system, the reaction mixtures stayed in the dark for around 1 h before they were flushed out.
15
The ozonolysis experiments were conducted in the dark. After humidification CO and monoterpene were added to the chamber. CO (∼40 ppm) was used as OH scavenger
to ensure that oxidation by O3was the dominant reaction pathway (>95 % of OH was scavenged) with little contribution of the OH oxidation to monoterpenes losses. After-wards, O3 generated from an UV O3 generator was added to the chamber to start 20
ozonolysis reaction of monoterpenes.
3 Methods
In the reaction of monoterpenes with OH and O3, oxidation products are generated, which condense on the particle phase resulting in particle growth. In the case of OH oxidation, multi-generation products can be formed from first generation products, as 25
ACPD
14, 12591–12634, 2014Secondary Organic Aerosol
D. F. Zhao et al.
Title Page
Abstract Introduction
Conclusions References
Tables Figures
◭ ◮
◭ ◮
Back Close
Full Screen / Esc
Printer-friendly Version Interactive Discussion
Discussion
P
a
per
|
D
iscussion
P
a
per
|
Discussion
P
a
per
|
Discuss
ion
P
a
per
|
OH also reacts with saturated compounds. Particle growth depends on the condensa-tion flux, thus the concentracondensa-tion of condensing products, of all generacondensa-tions. Since the concentration of condensing products is a function of the reaction rate, particle growth is closely related to the reaction rate of organics. We explored the relationship between particle mass growth and reaction rate of the organics with OH. When particles grow, 5
the particle diameter enlarges and the particle mass increases due to the condensa-tion of the reaccondensa-tion products. Here we use the term “particle size growth rate” to denote the particle diameter increase and “mass growth rate” to denote the particle mass in-creases. In the following we will establish a quantitative relationship of the particle mass growth rate with the reaction rate of OH with organics for the first time, to the best of our 10
knowledge. Since all condensing species contribute to the particle mass growth rate, the particle mass growth rate must be related to the reaction rate of all organic species with OH, which is directly accessible from the OH concentration measurement and the
kOH measurement in this study. The particle mass growth rate is derived from sum of the particle mass growth due to all condensing compounds.
15
In a first step, we will relate the overall mass growth to the OH gas-phase reaction rates with all organic species. We describe that by a reaction of VOC i with OH, in which for simplicity one molecule of speciesi reacts with OH, forming one molecule of speciesi+of the next generation:
i+OH−→i+ (R1)
20
According to the Raoult’s law we have the following equation, assuming the gas phase and particle phase are in equilibrium:
Cig= C
p
i
CtP ·C0
i, (1)
whereCgi andCpi are the concentrations ofi in the gas phase and in the particle phase 25
(molecules cm−3
ACPD
14, 12591–12634, 2014Secondary Organic Aerosol
D. F. Zhao et al.
Title Page
Abstract Introduction
Conclusions References
Tables Figures
◭ ◮
◭ ◮
Back Close
Full Screen / Esc
Printer-friendly Version Interactive Discussion
Discussion
P
a
per
|
D
iscussion
P
a
per
|
Discussion
P
a
per
|
Discuss
ion
P
a
per
|
concentration ofi (molecules cm−3
) andCtpis the concentration of all molecules in the particle phase, thusCpi/Ctp is the mole fraction of i. For high volatility species,C0i is high for given Cgi and thus Cpi is low or even negligible. The opposite is true for low volatility species,C0i is low andCpi is high.
When an infinitesimal concentration ofi, dCgi, reacts via Reaction (R1), correspond-5
ing to a change of i in the particle phase, dCip, from Eq. (1), one can get Eq. (2), because loss ofi is compensated by gain ini+andCtpis approximately conserved
dCig=dC
p
i
CPt ·C0
i. (2)
Re-arranging Eq. (2), one can get 10
dCip=C
P
t
Ci0 ·dCg
i. (3)
Similarly, one can get
dCip+1= C
P
t
C0i+1 ·dCg
i+1. (4)
15
For the change of the particle mass concentration (m, µg m−3
) due to the reaction of speciesi by Reaction (R1), we have
dm
dt
i
=dm
p
i+
dt +
dmpi
dt . (5)
ACPD
14, 12591–12634, 2014Secondary Organic Aerosol
D. F. Zhao et al.
Title Page
Abstract Introduction
Conclusions References
Tables Figures
◭ ◮
◭ ◮
Back Close
Full Screen / Esc
Printer-friendly Version Interactive Discussion
Discussion
P
a
per
|
D
iscussion
P
a
per
|
Discussion
P
a
per
|
Discuss
ion
P
a
per
|
dmpi (µg m−3
) and dCipcan be related by
dmpi =dC
p
i ·Mi10
6
·106
NA , (6)
whereMi is the molecular weight of species i (mol kg−1
) and NA is Avogadro’s Con-stant.
5
Similarly with Eq. (6), for speciesi+, one can get
dmpi+=dC
p
i+·Mi+10
6
·106
NA
. (7)
By applying the relationship ofi andi+in the Reaction (R1), we express,
dCig+=−dCg
i. (8)
10
Substituting Eqs. (3), (4), (6–8) into Eq. (5), one can get
dm
dt
i
=dC
g
i
dt ·C
p t
106·106 NA
Mi
Ci0 −Mi+
C0i+
!
. (9)
AssumingMi+ andMi are similar, with an average molecular weight M, one can get 15
mt=C p t
106·106
NA M, (10)
wheremtis total particle mass concentration. Substituting Eq. (10) into Eq. (9), one can get
dm
dt
i
=dC
g
i
dt ·mt
1
C0i
− 1
C0i+
!
. (11)
ACPD
14, 12591–12634, 2014Secondary Organic Aerosol
D. F. Zhao et al.
Title Page
Abstract Introduction
Conclusions References
Tables Figures
◭ ◮
◭ ◮
Back Close
Full Screen / Esc
Printer-friendly Version Interactive Discussion
Discussion
P
a
per
|
D
iscussion
P
a
per
|
Discussion
P
a
per
|
Discuss
ion
P
a
per
|
If we relax our assumption that one molecule of i+ is formed from the loss of one molecule ofi in the Reaction (R1), e.g. in case of fragmentation, Eq. (11) still holds (as shown in Appendix A).
According to the reaction ofi with OH, we have
dCgi
dt =−ROH,i, (12)
5
whereROH,i is the reaction rate of species i with OH. Substitute Eq. (12) into Eq. (11),
dm
dt
i
=ROH,i·mt
1
Ci0+
− 1
C0i
!
. (13)
10
Considering all the species contributing to the particle phase, we have
dmt
dt =
X
i
ROH,imt
1
Ci0+
− 1
Ci0
!
. (14)
Re-arrange Eq. (14),
dmt
dt =mt
X
i
ROH,i
P
i=1
ROH,i
1
C0
i+
− 1
C0
i
P
i
ROH,i
. (15)
15
Summing up all the species, we have
ROH=X
i
ROH,i, (16)
whereinROHis the reaction rate of all organics with OH. 20
ACPD
14, 12591–12634, 2014Secondary Organic Aerosol
D. F. Zhao et al.
Title Page
Abstract Introduction
Conclusions References
Tables Figures
◭ ◮
◭ ◮
Back Close
Full Screen / Esc
Printer-friendly Version Interactive Discussion
Discussion
P
a
per
|
D
iscussion
P
a
per
|
Discussion
P
a
per
|
Discuss
ion
P
a
per
|
In the next step, we will derive a system characterizing quantity in order to overcome the underdetermined knowledge about the individual components due to the complex-ity of monoterpene degradation. We define a new metric, GEOH(t,i) (particle growth efficiency in respect to the reaction of OH with all organics in the whole reaction sys-tem (including the VOCs and their oxidation products)) in Eq. (17) for speciesi: 5
GEOH(t,i)= 1
C0i+
− 1
C0i . (17)
One can also define
P
i
ROH,i·C10
i+
P
i
ROH,i =
1
C0i+
, (18)
10 and
P
i
ROH,i· 1
C0i
P
i
ROH,i
= 1
C0i
. (19)
C0i+andC
0
i are obtained from the average of 1/C0i for all organics weighed by the
reac-tion rate with OH, which in a certain way reflect the overall saturareac-tion vapor pressures. 15
Substituting Eqs. (16), (18) and (19) into Eq. (15), one can get
dmt
dt =ROH·mt·
1
C0i+
− 1
C0i
!
. (20)
Then, as Eq. (17), one can also define
GEOH(t)= 1
C0i+
− 1
C0i
. (21)
ACPD
14, 12591–12634, 2014Secondary Organic Aerosol
D. F. Zhao et al.
Title Page
Abstract Introduction
Conclusions References
Tables Figures
◭ ◮
◭ ◮
Back Close
Full Screen / Esc
Printer-friendly Version Interactive Discussion
Discussion
P
a
per
|
D
iscussion
P
a
per
|
Discussion
P
a
per
|
Discuss
ion
P
a
per
|
GEOH(t), a system describing quantity, is derived here in order to characterize the chemical system. It is an overall average of GEOH(t,i) weighted by reaction rate with OH of each species. Substituting Eq. (21) into Eq. (20),
dmt
dt =ROH·mt·GEOH(t) (22)
5
Arranging Eq. (22), one can get
GEOH(t)=
dmt
dt
ROH·mt
(23)
Equation (22) shows a quantitative relationship of the particle mass growth rate with the reaction rate of OH of all organics, which are linked by GEOH(t). GEOH(t) is the mass 10
growth rate normalized to the OH reaction rate and mass concentration, i.e. the mass growth rate per OH reacted per aerosol mass concentration (as shown in Eq. 23). It is a metric of how effectively the reaction with OH changes the mass growth rate at a given mass concentration in a reaction system. GEOH(t) has a unit of cm3molecules−1
(re-ciprocal of the unit of the concentration). It relates to the change of overall saturated 15
concentration of reaction products upon reaction with OH as shown in Eq. (21). In our case, where we measured OH andkOH,ROHis directly accessible. The reaction rate of OH with all organics was calculated using the measuredkOH and subtracting the OH reactivity of inorganic species (NO, NO2, CO).
4 Results and discussion 20
4.1 Multi-generation reaction process and particle growth
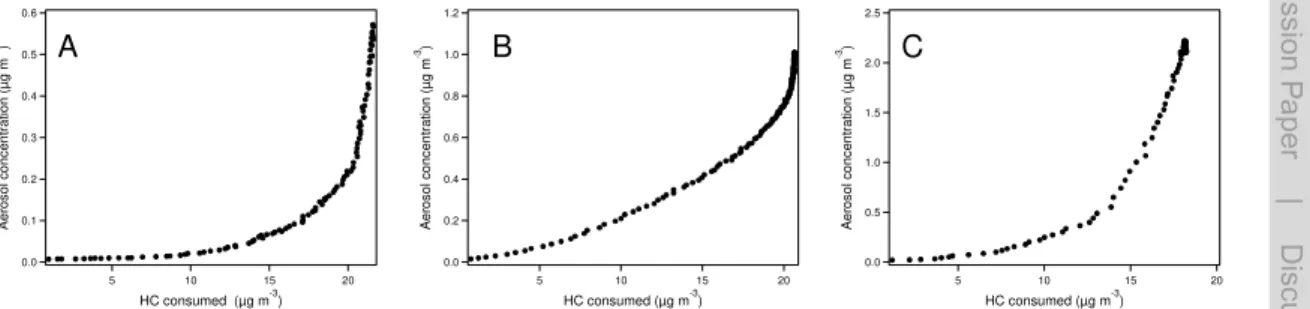
Figure 1 shows the time dependent particle “growth curve” (particle mass concentration as a function of monoterpene consumed) from the OH oxidation ofα-pinene,β-pinene
ACPD
14, 12591–12634, 2014Secondary Organic Aerosol
D. F. Zhao et al.
Title Page
Abstract Introduction
Conclusions References
Tables Figures
◭ ◮
◭ ◮
Back Close
Full Screen / Esc
Printer-friendly Version Interactive Discussion
Discussion
P
a
per
|
D
iscussion
P
a
per
|
Discussion
P
a
per
|
Discuss
ion
P
a
per
|
and limonene. After one monoterpene life time (when the monoterpene concentration decreased to 1/e of the initial concentration), only 13 %, 33 %, and 25 % of the total mass was reached for the OH oxidation ofα-pinene,β-pinene and limonene, respec-tively. This indicates the importance of higher generation products in the SOA formation from OH oxidation of each monoterpene (Ng et al., 2006). Our results differ from several 5
previous studies carried out at much higher VOC and SOA concentrations (Ng et al., 2006, 2007). Ng et al. (2006) showed that the time dependent growth curve is almost linear for terpenes with one double bond such asα-pinene and β-pinene. The diff er-ence can be attributed to the difference of VOC and the particle concentration. At high particle mass loading, the species with relatively high volatility such as first generation 10
products significantly condense. At low particle loading, only the species with relatively low volatility which require more oxidation steps (by OH) can significantly condense onto the particle phase. Consequently, the later generation products play important roles in the particle formation in this study. The importance of multi-generation prod-ucts agrees with Eddingsaas et al. (2012), who showed that particle growth continues 15
well after two lifetimes ofα-pinene with respect to OH oxidation at low NOxcondition. In contrast to OH oxidation, the total mass concentration increased roughly linearly with the consumed monoterpene concentration for the ozonolysis of each monoterpene (Fig. A1). The time-dependent growth curves of three monopterpenes in the ozonolysis experiments agree with previous studies (Ng et al., 2006; Zhang et al., 2006) and a re-20
cent study of Ehn et al. (2014) showing the formation of first generation products as the rate-limiting step. There was an apparent positive offset on the hydrocarbon consumed forα-pinene andβ-pinene, and barely an offset for limonene, since the reaction prod-ucts needed to reach their saturation concentration to condense on the particle phase. For limonene, within the time resolution of our measurement they reached the satu-25
ACPD
14, 12591–12634, 2014Secondary Organic Aerosol
D. F. Zhao et al.
Title Page
Abstract Introduction
Conclusions References
Tables Figures
◭ ◮
◭ ◮
Back Close
Full Screen / Esc
Printer-friendly Version Interactive Discussion
Discussion
P
a
per
|
D
iscussion
P
a
per
|
Discussion
P
a
per
|
Discuss
ion
P
a
per
|
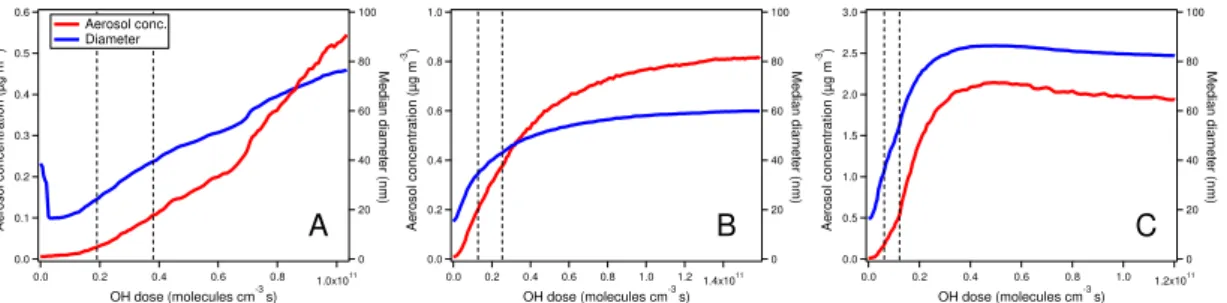
To further investigate the role of multi-generation oxidation by OH, the particle mass concentration and the median size as a function of OH dose are shown in Fig. 2. For all three monoterpenes, the particle mass concentration increased and size grew as the reaction proceeded and monoterpene reacted with OH (increasing OH dose). Then the increase of the mass concentration and growth of size with respect to OH dose started 5
to slow down gradually and subsequently leveled off. Particle size even decreased after leveling offin the case of limonene. Forα-pinene, the photooxidation reaction stopped in the dark after the louvre system of the chamber had been closed before the particle mass could level off.
In the beginning of the reaction, monoterpene reacted with OH generating low volatil-10
ity compounds by the functionalization process, which condensed on the particle and resulted in the particle mass increase and size growth. These condensing compounds still continued reacting with OH which could lead to functionalization as well as frag-mentation. Fragmentation can generate high volatility species thus promote evapo-ration. Since fragmentation increased with O/C and the role of functionalization de-15
creased (Kroll et al., 2009; Chacon-Madrid and Donahue, 2011; Chacon-Madrid et al., 2010), the role of fragmentation became more and more significant as the reaction pro-ceeded. When the fragmentation dominated over functionalization, the overall volatility of the products increased, i.e., the saturated vapor pressures decreased. When the overall concentration of condensing species dropped below the overall saturation con-20
centration due to the reaction and dilution, a net negative flux of condensable com-pounds occurred and these comcom-pounds started to evaporate from the particles. There-fore, the particle size first reached a plateau and even diminished as observed in the limonene oxidation experiment.
Moreover, time series of GEOH(t), the metric of particle growth efficiency due to reac-25
tion with OH, shed light on the role of functionalization and fragmentation in the reaction process. Figure 3 shows that the GEOH(t) time series and the particle mass concentra-tion as well as total OH reactivity of organics for comparison. GEOH(t) increased fast at the beginning of the reaction and then gradually decreased. The change of GEOH(t)
ACPD
14, 12591–12634, 2014Secondary Organic Aerosol
D. F. Zhao et al.
Title Page
Abstract Introduction
Conclusions References
Tables Figures
◭ ◮
◭ ◮
Back Close
Full Screen / Esc
Printer-friendly Version Interactive Discussion
Discussion
P
a
per
|
D
iscussion
P
a
per
|
Discussion
P
a
per
|
Discuss
ion
P
a
per
|
reflects the evolution of the overall volatility of organics undergoing reaction with OH and the relative role of functionalization and fragmentation.
In the beginning, functionalization played a dominant role. The reaction product had a lower volatility than the reactant, i.e., lower saturated concentration, therefore GEOH(t) is positive (refer to Eq. 21). As the volatility became lower, GEOH(t) increased. 5
In the subsequent reaction, as the products got more oxidized and O/C ratio of prod-ucts increased, the fragmentation of the compounds became more and more signifi-cant. The fragmentation cleaved the carbon frame and formed some smaller molecules with higher volatility. This caused the increase of overall volatility of the organics to slow down until it stopped and volatility even increased after the reaction with OH, that is, 10
GEOH(t) decreased. When the overall volatility of the reactants is equal to that of the products, GEOH(t) is equal to zero. GEOH(t) was observed to decrease to almost zero or even negative (Fig. 3c). From Fig. 3 one can recognize that the fragmentation started to play an important role in the relatively early period of the reaction (within approximate two lifetimes) when the mass concentration was still low. For comparison, the H/C and 15
O/C time series of SOA are also shown in Fig. 3. The change of H/C and O/C ratio supports our analysis of the role of functionalization and fragmentation. GEOH(t) de-creased dramatically at the same time when O/C ratio increased to around 0.4 and leveled off. Accordingly, H/C started to decrease from the beginning of the reaction and then leveled offat the same time as O/C. For reference, Kroll et al. (2009) showed 20
that for the reaction of squalane with OH fragmentation dominates when the organics are moderately oxidized (O/C≈0.4). The branching ratio of fragmentation and
func-tionalization has been parameterized as the power law of O/C (Donahue et al., 2012; Jimenez et al., 2009). Based on the GEOH(t) time series, the particle formation effi -ciency in respect to the reaction with OH was high in the beginning of the reaction 25
ACPD
14, 12591–12634, 2014Secondary Organic Aerosol
D. F. Zhao et al.
Title Page
Abstract Introduction
Conclusions References
Tables Figures
◭ ◮
◭ ◮
Back Close
Full Screen / Esc
Printer-friendly Version Interactive Discussion
Discussion
P
a
per
|
D
iscussion
P
a
per
|
Discussion
P
a
per
|
Discuss
ion
P
a
per
|
In addition, GEOH(t) can shed some light on the vapor pressure of the reaction prod-ucts. Since the volatility of products decreases around one to two order of magnitude in functionalization (Ziemann and Atkinson, 2012), in the beginning of the reaction when functionalization dominated,Cn0,i+≪C0
n,i. Then, based on Eq. (21), the following
equa-tion is tenable: 5
GEOH(t)= 1
C0n,i+
(24)
Since C0i+ is an average saturation pressure weighed in a certain way as shown in
Eq. (18). Equation (24) provides a rough estimate of the overall vapor pressure of the organics from experimentally obtained GEOH(t). In the case ofβ-pinene OH oxidation, 10
the overall vapor pressure varied from around 6×10⁻⁵to 1×10⁻³Pa. As a reference,
the lower value is of the same order of magnitude as the estimated vapor pressure of norpinonic acid based on the structure-activity relationship (Compernolle et al., 2011). We established the relationship of particle mass growth rate with the reaction rate of OH with organics. The relationship of the particle size growth rate with the reaction 15
rate is not straightforward. The size growth rate is proportional to the deviation of the concentrations of condensing species from their equilibrium concentrations, while the reaction rate of monoterpene with OH and O3is proportional to the rate of the increase of condensing species concentrations, i.e., the derivative of the concentrations. Addi-tionally, the equilibrium concentrations of the each species changes continuously with 20
their varying molar fractions in the particle phase during the reaction. Therefore, the reaction rate is only indirectly related to the size growth rate and should not necessar-ily correlate with size growth rate as observed in Fig. 4a and c. Still some variations in the size growth rate and mass growth rate follow the variations of the reaction rate of OH with organics and/or reaction rate of OH with monoterpenes (such as Fig. 4a–c). 25
These variations in the reaction rates were mostly caused by sudden changes of the OH concentration due to variations of solar radiation affected by clouds.
ACPD
14, 12591–12634, 2014Secondary Organic Aerosol
D. F. Zhao et al.
Title Page
Abstract Introduction
Conclusions References
Tables Figures
◭ ◮
◭ ◮
Back Close
Full Screen / Esc
Printer-friendly Version Interactive Discussion
Discussion
P
a
per
|
D
iscussion
P
a
per
|
Discussion
P
a
per
|
Discuss
ion
P
a
per
|
Comparing the particle growth of OH oxidation and ozonolysis, the ratios of the peak OH reaction rate to the O3 reaction rate for α-pinene, β-pinene and limonene were around 1.0, 1.2 and 0.5, respectively. The corresponding ratios of peak size growth rates for OH oxidation to that for ozonolysis were around 1.0, 1.5 and 1.1. At the similar monoterpene concentration and similar reaction rate of OH or O3 with monoterpene, 5
the size growth rates were comparable. This comparison indicates that generally OH oxidation and ozonolysis have similar efficiency in the particle growth ofα-pinene, β -pinene and limonene. This result is in contrast with the study of Hao et al. (2009), who found a much more efficient role of ozonolysis in particle growth from plant emis-sons than that of OH oxidation. Yet, our study agrees with Burkholder et al. (2007), 10
reporting the nearly indistinguishable particle size growth rate for different oxidation sources. Nevertheless, our experiments differ from both of these studies in terms of OH scavenger used (CO used in this study, cyclohexane and butanol in Burkholder et al., 2007; Hao et al., 2009, respectively). Since CO can cause a higher HO2/ RO2 ratio than cyclohexane and butanol, different OH scavengers could result in different 15
radical chemistry which could further alter the reaction pathways and products and finally could affect particle growth.
4.2 New particle formation and SOA yield
Figure 5 shows the particle number concentration, mass concentration, surface con-centration and median diameter of aerosol from each monoterpene by OH oxidation 20
and ozonolysis. The particle number concentrations of OH oxidation experiments were around 2000–6000 # cm−3
. The particle number concentrations from the ozonolysis of monoterpene were around 0.4×10⁵–1.6×10⁵# cm−3, which were much higher than
that generated by OH oxidation of the respective monoterpene. However, we have no indications what compounds eventually initiated the new particle formation (NPF) 25
ACPD
14, 12591–12634, 2014Secondary Organic Aerosol
D. F. Zhao et al.
Title Page
Abstract Introduction
Conclusions References
Tables Figures
◭ ◮
◭ ◮
Back Close
Full Screen / Esc
Printer-friendly Version Interactive Discussion
Discussion
P
a
per
|
D
iscussion
P
a
per
|
Discussion
P
a
per
|
Discuss
ion
P
a
per
|
Burkholder et al., 2007; Hao et al., 2009; Mentel et al., 2009), however experiments were performed often at higher VOC and aerosol concentrations. In addition, the role of monoterpene ozonolysis in nucleation in the presence of SO2(without OH scavenger) was shown by Ortega et al. (2012). In our JPAC glass chamber (Mentel et al., 2009), OH and H2SO4are needed to initiate NPF (Mentel et al., 2009; Kiendler-Scharr et al., 5
2009a, 2012; Ehn et al., 2014); it is possible that in Teflon chambers in absence of OH and significant H2SO4formation, other unknown compounds (perfluorinated acids) may play a role.
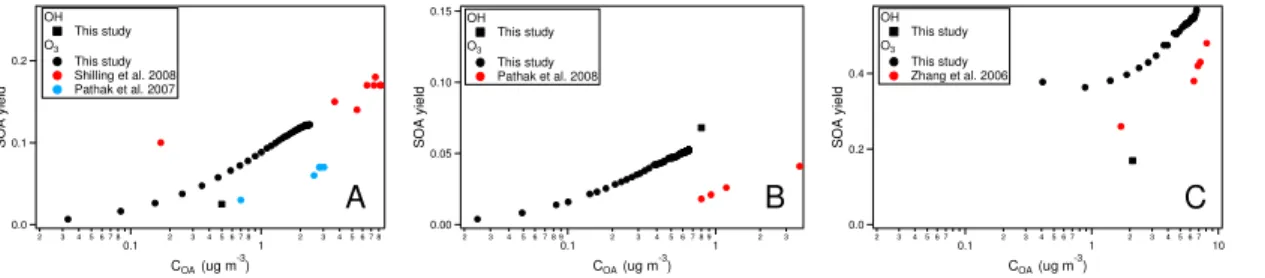
SOA yields observed in this study are similar to those observed before. SOA yield ofα-pinene,β-pinene, and limonene by OH oxidation was 2.5 %, 6.8 % and 16.9 % at 10
the aerosol loading of 0.5, 0.8 and 2.1 µg m−3
, respectively (Fig. A2). Since the multi-generation oxidation was the rate-limiting step, the “dynamic” yield from OH oxidation was not used (Presto and Donahue, 2006; Ng et al., 2006) and only final yield was derived. The aerosol yield ofα-pinene OH oxidation is roughly consistent with a study (Henry et al., 2012), although there were only few data points in that study overlapping 15
the range of our study (<1 µg m−3
, exact data not available from Henry et al., 2012, thus not shown in the figure). For β-pinene and limonene, there are few data of the aerosol yield of OH oxidation available especially at the aerosol loading similarly low to this study in the literature (Griffin et al., 1999; Hoffmann et al., 1997; Kim et al., 2012).
The particle yields for the ozonolysis experiments for α-pinene, β-pinene and 20
limonene (shown in Fig. A2, together with selected literature data at similar mass load-ings) are approximately in the range of or slightly higher than literature values (Pathak et al., 2007, 2008; Shilling et al., 2009; Saathoffet al., 2009; Zhang et al., 2006). The difference can be attributed to the difference in experimental conditions such as OH scavenger type, the temperature and RH etc. The aerosol yields of ozonolysis forα -25
pinene and limonene were higher than that of OH oxidation, while similar between both oxidation cases for β-pinene. The difference in the aerosol yield could be due to the difference in reaction pathways and products composition between the OH oxi-dation and ozonolysis. Also the temperature of the ozonolysis was lower than the OH
ACPD
14, 12591–12634, 2014Secondary Organic Aerosol
D. F. Zhao et al.
Title Page
Abstract Introduction
Conclusions References
Tables Figures
◭ ◮
◭ ◮
Back Close
Full Screen / Esc
Printer-friendly Version Interactive Discussion
Discussion
P
a
per
|
D
iscussion
P
a
per
|
Discussion
P
a
per
|
Discuss
ion
P
a
per
|
oxidation, which may affect the SOA yield. However, Pathak et al. (2007) only observed weak dependence of SOA yield fromα-pinene ozonolysis on temperature from 288 to 303 K, and especially for at low α-pinene reacted there is little temperature depen-dence. Therefore, temperature is likely to have only minor effect on the SOA yield of ozonolysis here.
5
4.3 Chemical composition
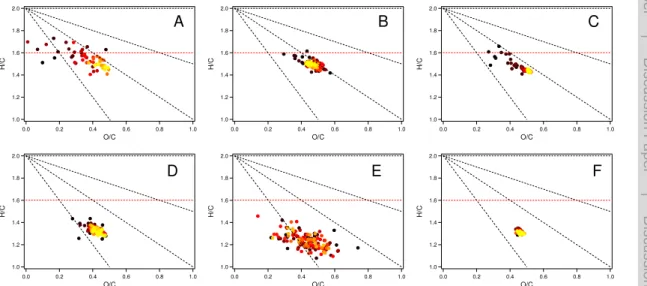
The H/C ratio vs. the O/C ratio plot known as Van Krevelen diagram for the aerosol from OH oxidation and ozonolysis is shown in Fig. 6. The O/C ranges for both oxidation cases were similar, around 0.3–0.6. The O/C ranges are consistent with the O/C range fromα-pinene photooxidaton and ozonolysis (Chhabra et al., 2011; Ng et al., 2011; 10
Pfaffenberger et al., 2013). They also agree with the O/C value (0.33–0.68) in a plant chamber observations for monoterpene-dominated emission mixtures (Kiendler-Scharr et al., 2009b) when one calculates O/C from f44 (the ratio of signal atm/z44 (CO+2) to total organics) (Ng et al., 2010).
The H/C ratio of SOA from OH oxidation was around 1.4–1.6, slightly lower than 15
that of the precursor monoterpene (H/C=1.6). This indicates that during the reac-tion oxygen was added to the monoterpene without significant loss of hydrogen espe-cially in the initial period of the reaction. SOA from OH oxidation of all three monoter-penes tended to follow a slope of shallower than −1 starting from monoterpene in
the Van Krevelen diagram (Fig. 6a–c). This is in contrast to the findings by Heald 20
et al. (2010), but consistent with those of Chhabra et al. (2011) and Ng et al. (2011). Heald et al. (2010) found atmospheric OA follows a slope of−1 in the Van Krevelen
dia-gram based on a variety of ambient and laboratory studies, which indicates the addition of carboxylic group or equal addition of carbonyl and hydroxyl group to average satu-rated hydrocarbon. However, in this study, monoterpenes are unsatusatu-rated hydrocar-25
ACPD
14, 12591–12634, 2014Secondary Organic Aerosol
D. F. Zhao et al.
Title Page
Abstract Introduction
Conclusions References
Tables Figures
◭ ◮
◭ ◮
Back Close
Full Screen / Esc
Printer-friendly Version Interactive Discussion
Discussion
P
a
per
|
D
iscussion
P
a
per
|
Discussion
P
a
per
|
Discuss
ion
P
a
per
|
of unsaturated hydrocarbons. Oxidation without significant loss of hydrogen can be also achieved by a “non-classsical” path, inserting O (O–O) into C–H (C–C) bonds (Ehn et al., 2012, 2014). In the classical path, increasing carbonylization/carboxylization in saturated parts of the condensable molecules leads to increase of O/C at simultane-ous decrease of H/C. After the initial period of particle formation (around one lifetime 5
of monoterpene), elemental composition of SOA from OH oxidation seemed to follow a slope of more close to−1. This indicates that the condensable species forming SOA
underwent more efficient hydrogen loss upon oxidation. Since the double bond is more reactive and reacted first, the carbon chain in the initial products became more satu-rated. Further “classical” oxidation of these products required hydrogen loss as ambient 10
organic aerosols (Heald et al., 2010). For the SOA from OH oxidation, H/C decreased and O/C increased generally during the reaction. Forβ-pinene, O/C even decreased again at the later period of the reaction (Fig. 6b). This could be due to oligomerisation after condensation forming larger units while releasing of water (formation of esters) or O2(dimerization of hydroperoxides) or be due to fragmentation of the products leading 15
to more volatile products.
For SOA from ozonolysis, the H/C was around 1.2–1.4, which was distinctively lower than that of the OH oxidation. The lower H/C in the ozonolysis compared to photooxi-dation was reported by Chhabra et al. (2011). It seemed that a process with significant hydrogen loss such as addition of carbonyl plays a more important role in the SOA 20
formation from ozonolysis compared to OH oxidation.
In the individual ozonolysis experiments, the O/C and H/C reached a stable value shortly (<1 h) after the reaction started and then did not show significant change. The different trend with time between the OH oxidation and ozonolysis was caused by the different reaction process. In the OH oxidation, after the particle formed, the reaction 25
products were subject to further reaction with OH. Hence the reaction products, H/C and O/C kept evolving. In contrast, in the ozonolysis the reaction ceased once O3 reacted with monoterpene. Therefore, there was no further significant change in the O/C and H/C in the ozonolysis.
ACPD
14, 12591–12634, 2014Secondary Organic Aerosol
D. F. Zhao et al.
Title Page
Abstract Introduction
Conclusions References
Tables Figures
◭ ◮
◭ ◮
Back Close
Full Screen / Esc
Printer-friendly Version Interactive Discussion
Discussion
P
a
per
|
D
iscussion
P
a
per
|
Discussion
P
a
per
|
Discuss
ion
P
a
per
|
5 Conclusions
In this study, the SOA formation from OH oxidation of several monoterpenes,α-pinene,
β-pinene and limonene was investigated at ambient relevant conditions (low OA con-centration, low VOC and NOx concentrations) and was compared with the SOA for-mation from ozonolysis (CO as the OH scavenger). The OH dominant oxidation was 5
achieved at low O3 concentration. Multi-generation reaction process, particle growth, new particle formation, particle yield, and chemical composition were analyzed.
The aerosol “growth curve” reflected the importance of multi-generation products in the OH oxidation of three monoterpenes. In the OH oxidation, we found the transition of functionalization and fragmentation through the analysis of the evolution of particle 10
size and particle mass as a function of OH dose. A novel method was developed which quantitatively linked the particle mass growth rate to the reaction rate of OH with or-ganics via a metric of particle growth efficiency of OH reaction. This method was also used to examine the role of functionalization and fragmentation during the particle for-mation of monoterpenes by OH oxidation. Functionalization was found dominant in the 15
beginning of the reaction (within approximately two lifetimes of the monoterpene) and fragmentation started to be dominant after that. The particle growth efficiency of the OH reaction was high in the beginning of the experiment, although the mass growth rate was low due to the low particle mass. This new method also provided an estima-tion of overall vapor pressure of the products when funcestima-tionalizaestima-tion was dominant. We 20
show that the overall vapor pressures vary from 10−5
to 10−3
Pa in the OH oxidation. The method of quantitatively linking particle mass growth rate to the OH reaction rate with organics will be used in other VOC systems and ambient measurements to further investigate the influence of OH oxidation on the particle growth.
The particle size growth rate did not necessarily correlate directly with the reaction 25
ACPD
14, 12591–12634, 2014Secondary Organic Aerosol
D. F. Zhao et al.
Title Page
Abstract Introduction
Conclusions References
Tables Figures
◭ ◮
◭ ◮
Back Close
Full Screen / Esc
Printer-friendly Version Interactive Discussion
Discussion
P
a
per
|
D
iscussion
P
a
per
|
Discussion
P
a
per
|
Discuss
ion
P
a
per
|
oxidation and ozonolysis have comparable efficiency in particle growth. The SOA yields of OH oxidation and ozonolysis in this study are generally consistent with the values in the literature. Ozonolysis ofα-pinene and limonene produced a higher aerosol yield than the respective OH oxidation.
SOA from monoterpene OH oxidation generally followed a slope of shallower than 5
−1 in the Van Krevelen diagrams, indicative of a process without significant loss of
hydrogen during the oxidation. In the later period of the reaction (after around one lifetime of monoterpene), SOA followed a slope of close to−1. SOA from OH oxidation
had a higher H/C than that from ozonolysis. In ozonolysis, a process with significant hydrogen loss such as addition of carbonyl seemed to play an important role in SOA 10
formation.
Appendix A
Additional equations for the relationship of particle mass growth and the reaction rate with OH
In the case of fragmentation, there could be more than one product,i+_1,i+_2,i+_p. 15
Equation (11) in the main text is in a slightly different form.
dm
dt
i
=dC
g
i
dt ·mt
p
X
k=1
1
C0i+_k
− 1
Ci0
(A1)
One can define
1
C0avg,i+ =
p
X
k=1
1
C0i+_k (A2)
20
ACPD
14, 12591–12634, 2014Secondary Organic Aerosol
D. F. Zhao et al.
Title Page
Abstract Introduction
Conclusions References
Tables Figures
◭ ◮
◭ ◮
Back Close
Full Screen / Esc
Printer-friendly Version Interactive Discussion
Discussion
P
a
per
|
D
iscussion
P
a
per
|
Discussion
P
a
per
|
Discuss
ion
P
a
per
|
Fragmentation usually generates one small volatile molecule and one less volatile molecule (assuming speciesPi+_1).
1
C0avg,i+
≈ 1
C0i+_1 (A3)
Thusi+_1 can directly correspond toi+in Eq. (11) in the main text and will not change 5
the format of Eq. (11).
Acknowledgements. M. J. Wang would like to thank China Scholarship Council for funding the
joint PhD program.
The service charges for this open access publication
10
have been covered by a Research Centre of the Helmholtz Association.
References
Aiken, A. C., DeCarlo, P. F., and Jimenez, J. L.: Elemental analysis of organic species with electron ionization high-resolution mass spectrometry, Anal. Chem., 79, 8350–8358,
15
doi:10.1021/ac071150w, 2007.
Aiken, A. C., Decarlo, P. F., Kroll, J. H., Worsnop, D. R., Huffman, J. A., Docherty, K. S., Ulbrich, I. M., Mohr, C., Kimmel, J. R., Sueper, D., Sun, Y., Zhang, Q., Trimborn, A., Northway, M., Ziemann, P. J., Canagaratna, M. R., Onasch, T. B., Alfarra, M. R., Pre-vot, A. S. H., Dommen, J., Duplissy, J., Metzger, A., Baltensperger, U., and Jimenez, J. L.:
20
O/C and OM/OC ratios of primary, secondary, and ambient organic aerosols with high-resolution time-of-flight aerosol mass spectrometry, Environ. Sci. Technol., 42, 4478–4485, doi:10.1021/es703009q, 2008.
Allan, J. D., Delia, A. E., Coe, H., Bower, K. N., Alfarra, M. R., Jimenez, J. L., Middlebrook, A. M., Drewnick, F., Onasch, T. B., Canagaratna, M. R., Jayne, J. T., and Worsnop, D. R.: A
gener-25
ACPD
14, 12591–12634, 2014Secondary Organic Aerosol
D. F. Zhao et al.
Title Page
Abstract Introduction
Conclusions References
Tables Figures
◭ ◮
◭ ◮
Back Close
Full Screen / Esc
Printer-friendly Version Interactive Discussion
Discussion
P
a
per
|
D
iscussion
P
a
per
|
Discussion
P
a
per
|
Discuss
ion
P
a
per
|
Andreae, M. O. and Rosenfeld, D.: Aerosol-cloud-precipitation interactions. Part 1. The nature and sources of cloud-active aerosols, Earth Sci. Rev., 89, 13–41, doi:10.1016/j.earscirev.2008.03.001, 2008.
Apel, E. C., Brauers, T., Koppmann, R., Bandowe, B., Bossmeyer, J., Holzke, C., Tillmann, R., Wahner, A., Wegener, R., Brunner, A., Jocher, M., Ruuskanen, T., Spirig, C., Steigner, D.,
5
Steinbrecher, R., Alvarez, E. G., Muller, K., Burrows, J. P., Schade, G., Solomon, S. J., Ladstatter-Weissenmayer, A., Simmonds, P., Young, D., Hopkins, J. R., Lewis, A. C., Legreid, G., Reimann, S., Hansel, A., Wisthaler, A., Blake, R. S., Ellis, A. M., Monks, P. S., and Wyche, K. P.: Intercomparison of oxygenated volatile organic compound measurements at the SAPHIR atmosphere simulation chamber, J. Geophys. Res.-Atmos., 113, D20307,
10
doi:10.1029/2008jd009865, 2008.
Atkinson, R. and Arey, J.: Atmospheric degradation of volatile organic compounds, Chem. Rev., 103, 4605–4638, doi:10.1021/cr0206420, 2003.
Bernard, F., Fedioun, I., Peyroux, F., Quilgars, A., Daele, V., and Mellouki, A.: Thresholds of secondary organic aerosol formation by ozonolysis of monoterpenes measured in a laminar
15
flow aerosol reactor, J. Aerosol Sci., 43, 14–30, doi:10.1016/j.jaerosci.2011.08.005, 2012. Bohn, B., Rohrer, F., Brauers, T., and Wahner, A.: Actinometric measurements of NO2
photol-ysis frequencies in the atmosphere simulation chamber SAPHIR, Atmos. Chem. Phys., 5, 493–503, doi:10.5194/acp-5-493-2005, 2005.
Bonn, B. and Moorgat, G. K.: New particle formation duringα- andβ-pinene oxidation by O3,
20
OH and NO3, and the influence of water vapour: particle size distribution studies, Atmos.
Chem. Phys., 2, 183–196, doi:10.5194/acp-2-183-2002, 2002.
Burkholder, J. B., Baynard, T., Ravishankara, A. R., and Lovejoy, E. R.: Particle nucleation following the O3 and OH initiated oxidation of alpha-pinene and beta-pinene between 278 and 320 K, J. Geophys. Res.-Atmos., 112, D10216, doi:10.1029/2006jd007783, 2007.
25
Canagaratna, M., Massoli, P., Jimenez, J. L., Kessler, S. H., Chen, Q., Hildebrandt, L., Fortner, E., Williams, L. R., Wilson, K. R., Surratt, J. D., Donahue, N. M., Kroll, J., Jayne, J. T., and Worsnop, D. R.: Improved calibration of O / C and H / C Ratios obtained by Aerosol Mass Spectrometry of organic species, in preparation, 2014.
Chacon-Madrid, H. J. and Donahue, N. M.: Fragmentation vs. functionalization: chemical aging
30
and organic aerosol formation, Atmos. Chem. Phys., 11, 10553–10563, doi:10.5194/acp-11-10553-2011, 2011.