Studies on hematological parameters in broiler chicken treated
with Amoxidem 50%
Studii privind parametri hematologici la pui broiler trata i cu
Amoxidem 50%
D. Turcu1, Mariana Oporanu1P. Grigorescu1, M. Roman2
,
1
Faculty of Veterinary Medicine, Spiru Haret university, Bucharest2S.C. Delos Impex 96 S.R.L. Abstract
Hematological response was studied in broiler chicken body as a consequence of treatment with Amoxidem 50% soluble powder. Under investigation were two batches of broiler chicken: control batch A and experimental batch B that received Amoxidem 50% soluble powder 46mg/Kg weight/day. Blood sampling was performed 7 days after treatment. The data were statistically analyzed using Student:Fisher method. The number of red blood cells showed no changes in statistical terms, the difference between batches being insignificant (p <0.5). Hemoglobin concentration in batch B increased significantly distinct (p <0.01) compared with batch A. Haematocrit showed similar values in both batches, the difference between them being insignificant (p <0.5). Constant erythrocyte MCV and MCHC values were statistically insignificant in the two batches (p <0.5). HEM concentration increased statistically significantly in batch B compared with batch A (p <0.05). The number of leukocytes in batch B showed an increase from batch A, the difference between them being statistically significant (p <0.05). The statistical difference between the two batches regarding the mean percentage of monocites is insignificant (p <0.5). In batch B there were changes that increase (p<0,001) of neutrophils (heterophils) and highly significant decrease (p<0,001) of eosinophils.
Key words: Amoxidem 50%, hematological parameters, broiler chicken
Rezumat
S:a studiat reac?ia hematologică a organismului la pui broiler ca urmare a aplicării tratamentului cu Amoxidem 50% pulbere hidrosolubilă. Au fost supuse investigării două loturi de pui broiler: lotul A de control Ai lotul B experimental la care s:a administrat Amoxidem 50% pulbere hidrosolubilă 46mg/Kg greutate vie/zi. Prelevarea probelor de sânge s:a efectuat la 7 zile după tratament. Datele ob?inute au fost prelucrate statistic prin metoda Student–Fisher. Numărul de eritrocite nu a prezentat modificări din punct de vedere statistic, diferen?a dintre loturi fiind nesemnificativă (p<0,5). Concentra?ia de hemoglobină la lotul B a crescut distinct semnificativ (p<0,01) comparativ cu lotul A. Hematocritul a prezentat valori similare la ambele loturi diferen?a dintre ele fiind nesemnificativă (p<0,5). Valorile constantelor eritrocitare VEM Ai CHEM au fost statistic nesemnificative la cele două loturi (p<0,5). Concentra?ia HEM a crescut statistic semnificativ la lotul B comparativ cu lotul A (p< 0,05). Numărul de leucocite a prezentat la lotul B o creAtere fa?ă de lotul A diferen?a dintre ele fiind statistic semnificativă (p<0,05). Diferen?a statistică între cele două loturi în ceea ce priveAte valorile medii procentuale ale monocitelor este nesemnificativ (p<0,5). La lotul B s:au produs modificări în sensul creAterii înalt semnificative (p<0,001) Ai a scăderii înalt semnificative (p<0,001) a eozinofilelor.
Amoxidem 50%, parametri hematologici, pui broiler
Introduction
In modern chicken growing industry the antibiotics were used not only in therapy and prevention of microbial diseases, but also as growthing promoters in feed add (1).
In some countries antibiotics were used in broilers annually administering the antibiotic 430 mg/kg (2).
Though antibiotics are recommended to
be prescribed only to treat bacterial
infections, researchers have studied also the effect on hematological and immunological parameters of the body (4, 8, 9).
Hematological profile in animals is an
important indicator of physiological or
pathophysiological status of the body (5).
The values of blood parameters vary by race, age, gender, stress, bacterial and viral infections, poisoning (3, 5, 6).
Studies on the evaluation of hematologic response after inoculation in broiler chicken with estradiol revealed a highly significant difference between control and experimental
group as decline in the number of
erythrocytes and hemoglobin.
chickens whose diet was supplemented with
Flavomycin, while lower values were
recorded in chickens receiving Primalac (1). Mayah et al (2005) have managed to place for chicken, 1:5 days old, in drinking
water, ampicillin, and amoxicillin and
enrofloxacin for 5 consecutive days. They noticed that there have been changes to the amount of hemoglobin, white blood cell count, erythrocyte and erythrocyte constants. The results showed a decrease in hematological values in chicks aged 1:5 days while in chickens aged 22 to 27 days these values were within normal physiological limits (2).
The literature presents reference values of hematological and biochemical profile for
the bird breeds ,
, etc. as
well as for wild birds (Falco peregrinus, U.S. , etc.) in order to define the physiological status and disease (6, 7, 8, 10).
Study objectives
In this paper we wanted to study the extent to which antimicrobial therapy using amoxicillin soluble powder 50% (Amoxidem)
influences hematological parameters in
broiler chickens bred in intensive system.
Material and methods
Birds
The research was conducted in a broiler farm, on 3:4 months old chickens bred intensively. The chicks were divided into two groups: batch A (n=10) used as a control batch and batch B (n=10) treated with experimental Amoxidem 50% soluble powder at a dose of 46mg/kg body weight/day for 5 days consecutively.
Sampling
Blood samples were collected in
anticoagulant solution (EDTANa) from the
crest in 7 days after the last administration.
Hematological parameters
We determined the total number of: : erythrocytes (E),
: the total number of leukocytes (L), : hemoglobin concentration (Hb), : haematocrit (Ht),
: average cell volume (MCV),
: mean erythrocyte hemoglobin (HEM), : the average amount of hemoglobin in
red blood cells (MCHC) in an automatic analyzertype BC Dray 2800 Vet Min. Leukocyte formula for expressing the
percentage of lymphocytes, monocites,
neutrophils (heterofiles) eosinophils and
basophiles was performed by staining slides with May:Grumwald Giemsa solution.
Statistical analysis
It was performed by averaging (x) and standard deviation (SD). The values obtained for the two batches were compared using: Student T:test. Level of significance was reported to the p values.
Results and discussion
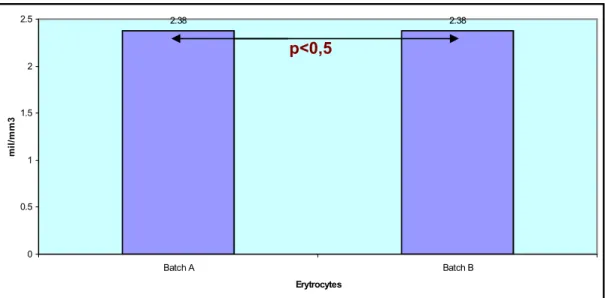
Tables 1 and 2 reveal individual and average values of erythrocytes, hemoglobin, haematocrit and erythrocyte constants MCV, MCHC HEM and in chicken batches A and B. In these batches the number of red blood cells showed no changes in statistical terms,
the difference between batches being
insignificant (p <0.5) as follows: in batch A, x ± SD = 2.38 ± 0.12 and in batch B, x ± SD = 2.38 ± 0.19 mil/m3(figure 1).
Figure 1. Mean total number of erythrocytes (mil/mm3) in the two batches of chickens investigated
2.38 2.38
0 0.5 1 1.5 2 2.5
Batch A Batch B
Erytrocytes
m
il
/m
m
3
Hemoglobin concentration in batch B (x ± SD = 11.36 ± 0.71 g/dl) increased significantly
distinct (p <0.01) compared with batch A (x ± SD = 9.09 ± 0.75 g dl) (figure 2).
Figure 2. Average concentration of hemoglobin values (g/dl) in batches A and B
Haematocrit in both batches showed similar levels (batch A: x ± SD = 37.9 ± 3.28%, batch B x ± SD = 37.8 ± 3.72%), the statistical difference between batches being insignificant (p <0,5).
Mean corpuscular volume (MCV) was
statistically insignificant (p <0.5) in samples from batch A (x ± SD = 164.8 K3 ± 9.05) in
comparison with batch B (x ± SD = 164.7 ± 13.9K3).
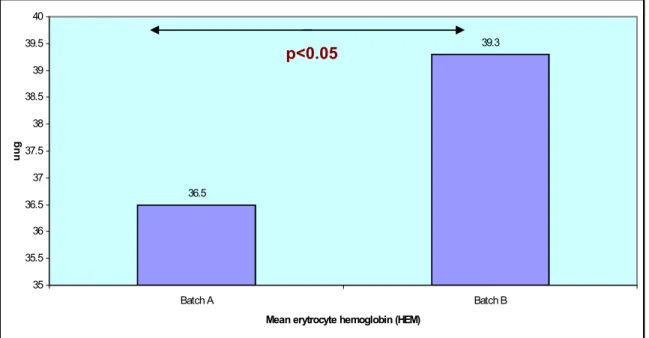
In batch B, treated with 50% Amoxidem, the mean values of erythrocyte hemoglobin (HEM) (x ± SD = 39.3 ± 7.68 Kg) increased statistically significantly (p<0.05) compared with levels in batch A (x ± SD = 36.5 ± 6.11 Kg) (figure 3).
Figure 3. Mean values of erythrocyte hemoglobin (HEM) in the investigated batch
The average amount of hemoglobin in red blood cell (MCHC) in batch A (x ± SD = 23.8 ± 2.17 g / dl) was statistically insignificant (p <
0.5) compared to batch B (x ± SD = 24.5 ± 3.34 g / dl).
9.09
11.36
0 2 4 6 8 10 12
Batch A Batch B
Hemoglobin
g
/d
l
36.5
39.3
35 35.5 36 36.5 37 37.5 38 38.5 39 39.5 40
Batch A Batch B
Mean erytrocyte hemoglobin (HEM)
u
u
g
p<0,01
Table 1. Individual values of erythrocytes (E), hemoglobin (Hb), haematocrit (Ht) and red blood cell constants (MCV, MCHC and HEM) in broiler chickens in control batch A and experimental batch
E mil/mm3
Hb g/dl
Ht %
MCV 73
HEM 77g
MCHC g/dl
Batch Batch Batch Batch Batch Batch
Sample No
A B A B A B A B A B A B
1 2,62 2,60 7,46 8,25 32,2 30,4 160 158 47 55 27 27
2 2,50 2,52 9,92 10,04 42,4 42,2 163 162 41 38 22 23
3 2,61 2,25 9,26 9,02 39,7 40,4 162 161 32 36 23 26
4 2,49 2,60 9,01 8,90 39,5 39,7 169 176 36 39 23 23
5 2,40 2,22 9,53 9,83 41,7 42,4 160 155 40 41 22 25
6 2,30 2,56 9,02 9,97 36,4 35,2 162 158 36 37 23 25
7 2,20 2,15 9,46 10,08 38,2 38,7 171 192 38 33 24 21
8 2,31 2,40 8,27 9,90 35,9 36,5 186 184 24 42 21 18
9 2,26 2,29 9,02 9,13 33,9 34,6 152 185 38 27 28 29
10 2,13 2,23 9,96 10,56 39,2 38,0 163 158 33 46 25 28
Table 2. Mean (x ± SD) values of hematological parameters in chicks of batches A and B and statistical
significance of differences between batches Batches (x±ds)
Parameter
A B
Statistic Significance (p)
Erythrocytes (mil/mm3) 2,38 ± 0,12 2,38 ± 0,19 (p< 0,5) Hemoglobin (g/dl) 9,09 ± 0,75 11,36 ± 0,71 (p<0,01)
Hematocrit (%) 37,9 ± 3,28 37,8 ± 3,72 (p< 0,5)
MCV (K3) 164,8 ± 9,05 164,7 ± 13,19 (p< 0,5)
HEM (KKg) 36,5 ± 6,11 39,3 ± 7,68 (p< 0,05)
MCHC (g/dl) 23,8 ± 2,17 24,5 ± 3,34 (p< 0,5)
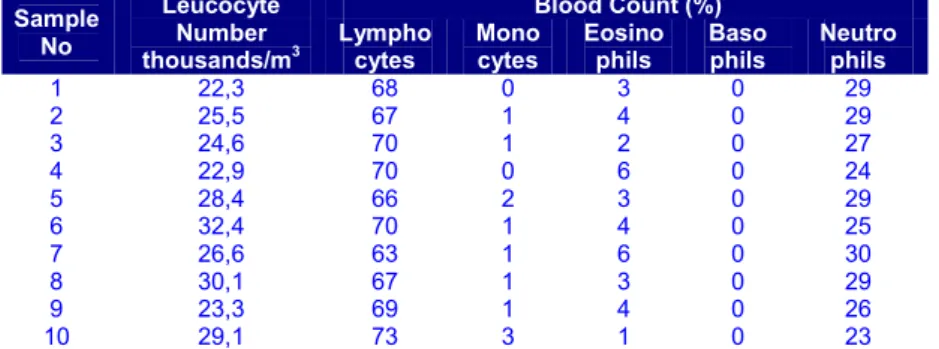
Individual values and average values of some leukocyte parameters (WBC, leukocyte
formula) in the studied batches were
summarized in tables 3, 4 and 5.
As is clear from these data there is an increase in the number of leukocytes in batch B treated with Amoxidem 50% (x ± SD =
31.18 ± 3.12 mii/m3) than in the control batch (x ± SD = 26, 52 ± 3.39 mii/m3).
The statistical difference between groups is significant (p <0.05). It is to note that the number of leukocytes in the two batches fall within the normal range for this species.
Table 3. Individual values of some leucocyte parameters in control batch A
Blood Count (%) Sample
No
Leucocyte Number
thousands/m3 Lymphocytes Monocytes Eosinophils Basophils Neutrophils
1 22,3 68 0 3 0 29
2 25,5 67 1 4 0 29
3 24,6 70 1 2 0 27
4 22,9 70 0 6 0 24
5 28,4 66 2 3 0 29
6 32,4 70 1 4 0 25
7 26,6 63 1 6 0 30
8 30,1 67 1 3 0 29
9 23,3 69 1 4 0 26
10 29,1 73 3 1 0 23
Studying the blood count in batches A
and B, lymphocytes were found to
predominate (batch A: x ± SD = 68.3 ± 1.63%
and batch B: x ± SD = 53.5 ± 6.94%), results confirmed by literature data as well ( N. Avram, 2004).
Table 4. Individual values of some leucocyte parameters of broiler in batch B treated with 50% Amoxidem
Blood Count (%) Sample
No
Leucocyte Number thousands/m3
Lympho cytes
Mono cytes
Eosino phils
Baso phils
Neutro phils
1 26,4 52 1 5 0 42
2 31,2 49 0 4 0 47
3 32,0 45 1 0 0 54
4 30,4 50 2 2 0 46
5 27,2 43 1 1 0 55
6 32,8 55 0 2 0 43
7 28,8 56 0 3 0 41
8 34,4 61 0 4 0 35
9 31,8 64 1 1 0 34
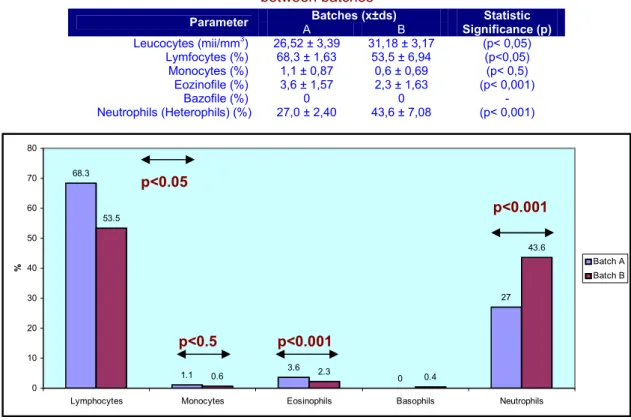
Table 5 shows the average percentage values of monocites (batch A: x ± SD = 1.1 ± 0.87, batch B: x ± SD = 0.6 ± 0.69%) statistical difference between groups was insignificant (p <0.5). Lower percentage of monocites from normal values (3:8%) is observed. Mean eosinophils is within normal limits (1:4%), statistical difference between
batch A x ± SD = 3.6 ± 1.5% and batch B x ± SD = 2.3 ± 1.63% was highly significant (p <0.001).
Compared with the control batch, the mean percentage of neutrophils (heterofiles) in batch B was significantly higher (p <0.001) (batch A: x ± SD = 27.0 ± 2.40%, batch B: x ± SD = 43.6 ± 7.0 (figure 4).
Table 5. Mean leukocyte profile of broiler chicken batch A and B and statistical significance of differences
between batches
Batches (x±ds) Parameter
A B
Statistic Significance (p)
Leucocytes (mii/mm3) 26,52 ± 3,39 31,18 ± 3,17 (p< 0,05)
Lymfocytes (%) 68,3 ± 1,63 53,5 ± 6,94 (p<0,05) Monocytes (%) 1,1 ± 0,87 0,6 ± 0,69 (p< 0,5) Eozinofile (%) 3,6 ± 1,57 2,3 ± 1,63 (p< 0,001)
Bazofile (%) 0 0 :
Neutrophils (Heterophils) (%) 27,0 ± 2,40 43,6 ± 7,08 (p< 0,001)
Figure 4. Mean leukocyte subpopulations (%) in broilers in batches A and B
Conclusions
1. Investigations were conducted on broiler
chickens raised in an intensive farm
enjoying appropriate microclimate
conditions;
2. There were changes in the experimental
batch which means higher average of neutrophils (heterofiles) and a highly significant decrease in the average values of eosinophils;
3. In the experimental batch the number of
leukocytes and HEM concentration
showed a significant increase compared to the control batch, the average mean were over the normal physiological limits;
4. Erythrocyte count, hemoglobin and
erythrocyte constants MCV and MCHC had a similar pattern in both batches during the experiment with Amoxidem 50% and the difference between them was insignificant.
5. At the investigated batches the monocites
showed small variations, the statistical
difference between them was
insignificant.
References
1. Ashayerizadeh O., B. Dasar, M. Shams Sharoh, A. Ashayerizadeh, M. Mamooee. (2009). Influence of Antibiotic, Prebiotic and probiotic suplimentation to Diets on Carcass Characteristics, Hematological Indices and Interval Organ Size of Young Broiler Chickens. 8, (9), 1772:1776.
2. Al@Mayah A. S., Jalaa A Al@Ahmed. (2005). Influence of Antibiotics Treatment on Hematological Aspect in Chickens.
, 4, (5), 323:325 3. Avram N., D. Cucă. (2004). Explorări
paraclinice. Lucrări aplicative. Editura Funda?iei România de Mâine, BucureAti.
4. Dumitru C., Spânu M., Brudaocă G. F., Dobrean V., Oprio A., Andru C. (2002). Parameters of the immunological Profile in
68.3
1.1 3.6 0
27 53.5
0.6 2.3 0.4
43.6
0 10 20 30 40 50 60 70 80
Lymphocytes Monocytes Eosinophils Basophils Neutrophils
% Batch A
Batch B p<0.05
p<0.5 p<0.001
Chickens treated with a
extraction. !
3, (2), 131:136.
5. Khan A. T., F. Zafar. (2005). Haematological Study in response of Varying Doses of Estrogen in Broiler Chicken.
4, (10), 748:751.
6. Lanzarot Maria del Pilar, A. Motesinos, M.I.San Andres, Casilda Rodriguez, Maria Victoria Barahona. (2001). Hematological, Protein Electrophoresis and Cholinesterase Values of Free Living Nestling Peregrine Falcon in Spain. " # , 37 (1), 172:177.
7. Pampori Z.A., S. Iqbal. (2007). Haematology, serum Chemistry and Electrocardiographic Evaluation in Native Chicken of Kashmir. , 6 (8); 578:582.
8. Simaraks S., O. Chinrasri, W. Aengwanich. (2004). Hematological, electrolyte and serum biochemical values of the Thai indigenous chickens (Gallus domesticus) in northeastern, Thailand. Song Klanakarin. $ $ $ 26 (3), 425:430
9. Turcu D., Mariana Oporanu, D. Condur, P. Grigorescu, M. Roman. (2010).Contributions to the humoral immunological profile in broiler chickens treated with 50% Amoxidem.%
# , 4 (2), 42:45.
10. West G.D., Vicky L. Haines. (2002). Hematology and serum biochemistry values of captiveAttwater's Prairie chickens (
). Journal of zoo and wildlife Medicine, 33, 2, 122:124