Relationship of Rainfall Distribution and Water Level on Major Flood 2014 in Pahang River
Basin, Malaysia
Nur Hishaam Sulaimana, Mohd Khairul Amri Kamarudina,b, Mohd Ekhwan Torimana,c, Haizan Juahira, Frankie Marcus Ataa, Azman Azida, Noor Jima Abd Wahaba, Roslan Umara, Saiful iskandar Khalita,
Mokhairi Makhtard, Amal Arfane & Uca Sidenge
a
East Coast Environmental Research Institute (ESERI), Universiti Sultan Zainal Abidin, Gong Badak Campus, 21300 Kuala Terengganu, Malaysia
b
Faculty of Innovative Design and Technology, Universiti Sultan Zainal Abidin, Gong Badak Campus, 21300 Kuala Terengganu, Malaysia
c
School of Social, Development and Environmental Studies, Faculty of Social Sciences and Humanities, National University of Malaysia, 43600, Bangi Selangor, Malaysia
d
Faculty of Informatics and Computing, Universiti Sultan Zainal Abidin, Gong Badak Campus, 21300 Kuala Terengganu, Malaysia
e
Fakulti Matematik dan Ilmu Pengetahuan Alam, Universitas Negeri Makassar, Parangtambung, Makassar, Indonesia
Abstract
Climate change gives impact on extreme hydrological events especially in extreme rainfall. This article discusses about
the relationship of rainfall distribution and water level on major lood 2014 in Pahang River Basin, Malaysia in helping decision makers to lood management system. Based on DID Malaysia rainfall station, 56 stations have being use as point in this research and it is including Pahang, Terengganu, Kelantan and Perak. Data set for this study were analysed with GIS analysis using interpolation method to develop Isohyet map and XLstat statistical software for PCA and SPC analyses. The results that were obtained from the Isohyet Map for three months was mid-November, rainfall started to increase about in range of 800mm-1200mm and the intensity keep increased to 2200mm at mid-December 2014. The high rainfall intensity sense at highland that is upstream of Pahang River. The PCA and SPC analysis also indicates the high relationship between rainfall and water level of few places at Pahang River. The Sg. Yap station and Kg. Serambi station obtained the high relationship of rainfall and water level with factor loading value at 0.9330 and 0.9051 for each station. Hydrological pattern
and trend are extremely affected by climate such as north east monsoon season that occurred in South China Sea and affected
Pahang during November to March. The indings of this study are important to local authorities by providing basic data as guidelines to the integrated river management at Pahang River Basin.
Keywords: Isohyet map; lood 2014; rainfall distribution; GIS; Pahang River
1. Introduction
Flood is one of the most common natural disasters across the globe, jeopardizing settlements along the lood plains and being considered a continued hazard for humanity. Malaysia is no exception due to its annual experience with flood during the monsoon season. According to Sulaiman et al., 2015, the lood
event is becoming an often disaster in Malaysia.
Pahang Basins are one of the areas that received highest total rainfall during north east monsoon period about 40 per cent of the total rainfall annually (Lun et al., 2011;
Gasim et al., 2013). According to Adnan and Atkinson
(2008), climate change and weather are important roles in various ields such as hydrology, epidemiology and environment sustainability.
Flood that occurred on December 2014 was one of the worst loods that ever hit the East Coast of The international journal published by the Thai Society of Higher Education Institutes on Environment
E
nvironment
A
sia
Rainfall distribution is very important in the study of lood disaster. According to Department of Drainage and Irrigation (DID, 2010), there are three main sources of looding such as heavy local rainfall, extreme river discharge and sea wave from South China Sea. Rainfall is the main sources of water input to the watersheds were is inluence by the water storage and discharge of a river especially during heavy rainfall event. Therefore, the study on the impact of rainfall and run-off is very important in order to elaborate the cause of lood event (Obled et al., 1994; Ogden and Julien, 1993; Yue and
Wang, 2004).
Besides that, rainfall also plays an important role during major lood event. In the case of rainfall distribution similar to the direction of the main stream, the lood peak is higher when it is moving in the opposite area or direction (Kamarudin et al., 2015b;
Vega et al., 1998).
Statistical tools are commonly used to detect the signiicant of trends in climate and hydrological ield by using non-parametric analysis such as Principle component analysis, Statistical process control, and the parametric analysis such as descriptive statistic and student’s t-test. In statistical tools, nonparametric test
is considered better and it displays much insensitivity to outlier unlike parametric test (Mann, 1945). The application of environ metric, a branch of environmental analytical chemistry and the use of multivariate statistical modeling and data treatment was reported to be the best method in analysing a large complex environmental monitoring data (Kamarudin et al., 2015c; Kendall, 1975; Liu et al., 2003).
The purpose of this study is to analyse the rainfall pattern and distribution throughout Pahang River Basin as to indicate the factors lead to lood 2014. Heavy rainfall that surge Pahang River Basin in late 2014 leaved a huge impact to the lood event that caused extraordinary lood water level in Pahang River Basin. The study of rainfall distribution during the lood event is crucial because it can provides numerous inluence to better understanding of rainfall in the basin and leads to better decision making in order to mitigate the factors of looding event. In addition, there is further investigation being carried out in order to examine the effects of south-west monsoon season on November to March for every year to the parameter that been studied in Pahang River.
2. Materials and Methods
2.1 Study area
Pahang River is one of the largest river basins in Peninsular Malaysia. Pahang River is located at longitude 101° 30’ 00” E to 103° 30’ 00” E and latitude 3° 00’ 00” N to 4° 45’ 00” N. Pahang River is the major river system in Pahang River basin that started from the Titiwangsa mountain range to the South China Sea.
This research involves the rainfall distribution of 56 stations that are located in Pahang, Terengganu, Kelantan and Perak states. All these stations are located at Pahang state and nearby states which are involved to obtained more accuracy on rainfall distribution.
2.2 Data
In this study, the secondary data that is being used are from four different stations that have been set up by DID Malaysia to monitor the rainfall data of Pahang River Basin and its border. According to Juahir et al., 2011, in hydrological procedure no. 4 in
DID Malaysia had mentioned some of the data that were obtained and recorded may not have quality secondary date that was due to the error of the gauge, inaccuracy in data collection and rain gauge recorders.
The records from prior to 1970 were operated by using a manual gauge and after that it is being upgraded with automatic gauge is whether it is an underestimation or improper reading of the parameter.
2.3 Isohyet method
According to Jayawardene et al. (2005), Isohyet
gauge stations on the map to differentiate the area of the precipitation focused. Whiles constructing Isohyets, it is assumed that the rainfall between two stations varies linearly, unless it is indicates otherwise due to changes in topography. The rainfall data of Pahang River Basin is obtained from the Department of Drainage and Irrigation (DID) Malaysia from upstream to the downstream of Pahang River that started at Gagau Mount and ended at Pekan, Pahang.
2.4 Statistical analysis
In this study, Principle Component Analysis (PCA) analysis was performed to the data set to exclude insigniicant data. This analysis is based on eigenvalue criteria where value >1 is considered as signiicant and a new group of variables built based on the resemblance of the entire data set (Juahir et al., 2011). The PCs
generated by PCA are sometimes not readily interpreted. It is advisable to rotate the PCs by varimax rotation to obtain new groups of variables called varimax factors (VFs). The correlation between the VFs and the original variables is given by the factor loading, while the individual transformed observations are called factor scores (Simeonov et al., 2000). The VF coeficients
having a correlation >0.75 are considered ‘strong’, 0.74 - 0.50 are considered ‘moderate’ and 0.49 - 0.30 are considered ‘weak’ signiicant factor loadings. For this study, factor loading >0.75 both positive and negative will be considered (Hamilton et al., 2001). Data were
statistically calculated and analysed using the Xlstat version 2014.
Statistical Process Control (SPC) is a method used for quality control of the data sets. SPC is used in this study to conform product or the data sets in order to ensure the data sets used is reliable and meet the speciication needed for further analysis such as Isohyet and PCA. The data sets that been used for SPC analysis were rainfall and water level data. In this case, rainfall and water level data from several stations is being test to provide support for the argument in PCAs and Isohyet method.
3. Results and Discussion
3.1 Isohyet map of rainfall intensity
Based on this study, GIS analysis using interpolation
been used to divide the area by its intensity of the rain and using contour as the dividing lines of the differences between the intensity of rainfall. Fig. 1 shows the rainfall intensity of Pahang River Basin in November 2014. Rainfall play an important role in life as a fresh water source but it is also a factor that leads to the most loods. Annually, Peninsular Malaysia will be hit by heavy rainfall during end of year. However, in 2014 the rain intensity is extraordinarily high due to the monsoon and a new moon phenomenon (Umar et al., 2015).
Base on Fig. 1, the rainfall intensity on November 2014 is high and focused on Kuantan, Pekan and a few districts of Pahang close to Selangor state. According to Jamaludin et al. (2010), during mid-November 2014,
the heavy rainfall that hit Pahang especially in Pahang River Basin caused a lash lood in several places including Pekan, Chini, Jerantut and Kuala Tahan in National Park of Malaysia. Heavy rainfall was also found to hit the Kuantan River Basin, i.e. the nearby river basin, in the capacity range about 250mm to 350 mm during mid-November 2014 (Fig. 1(a)), It can be concluded, the river basin that nearby Pekan area also affected the lood occurs in Pekan that located in Pahang River Basin. Besides that, the borders of Perak, Kelantan and Pahang that are located at highland such as Brinchang and Cameron Highland, the intensity of rainfall increased dramatically at the range of 1600mm to 1700mm.
During Pahang flood disaster in 2007, heavy rainfalls that started in December until mid-January is one of the factors that lead to lood. High rainfall intensity also suffered by area at the border with Perak at Brinchang and Cameron Highland. Rainfall intensity in capacity about 350mm to 450mm in November 2014 and 400mm to 600mm in December 2014 lead the high velocity of lood water low from Cameron highland in to Semantan River then met with the Pahang River in Temerloh area, that received high river low due to the heavy rainfall in Jerantut and National Park in Tembeling River. Pahang River in Temerloh lead to major lood occurred in Temerloh. The rainfall event in the same direction or area with the main stream will peak the lood alongside the stream.
During January 2015, the rainfall intensity in Pahang State focused in Pekan located in Pahang River Basin. However, the rainfall cumulative intensity still pouring down in few areas that heavily affected by flood such as National Park, Jerantut, Temerloh, Cameron Highland especially in Brinchang and Chini in capacity range about 60mm to 120mm (Fig. 1(c)). Pekan districts was hit by lood later after upstream and middle stream compared to lood in Kelantan that hit almost entire Kelantan areas in short time. For the other places such as central area of Pahang State and upstream area of Pahang River, the rainfall intensity has dropped to the range of 400mm to 120mm in the blue area in Fig. 1.
3.2 Rainfall and water level relationship analysis
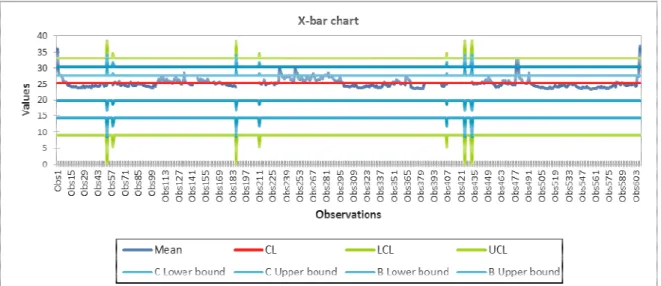
Fig. 2 and Table 1 shows the conirmation of the Isohyet analysis has been proved by using statistical analysis through Statistical Process Control (SPC) and Principle Component Analysis (PCA).
Based on Fig. 2, the results shows that the water level of Pahang River increased as the rainfall intensity
increased through SPC analysis. The p-value of the
analysis is 0.0001 less than 0.05 (Table 2). That means
have a signiicant correlation between water level and rainfall. The mean of the correlation was at 25 values show that the water level of 25 m is the optimum range of the rainfall intensity that raises the water level in Pahang River.
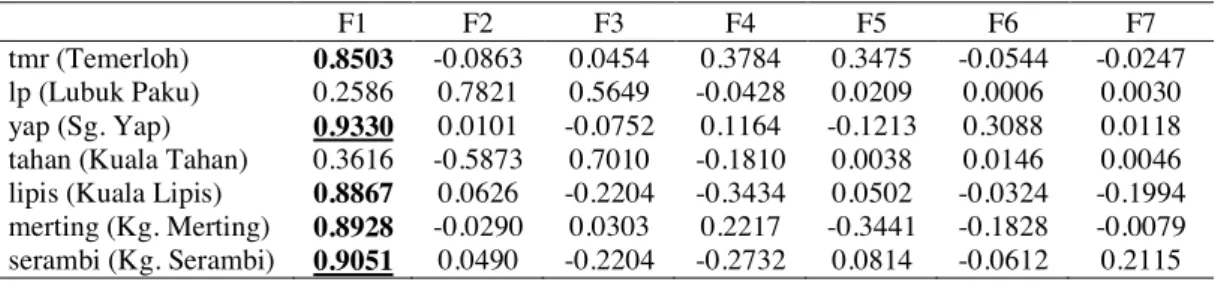
Based on the outcome of PCA analysis in Table 1, there were several changes of the value at the water level and rainfall data station in Temerloh, Kuala Lipis, Sg. Yap, Kg. Merting, and Kg. Serambi. The factor loading at the studied station indicates that there are relationship between water level and rainfall intensity at that particular area. The station that has the most closed relationship between water level and rainfall is Sg. Yap station that obtained 0.9330 for factor loading. Kg. Serambi station also the highest connection connection of rainfall and water level with factor loading value at 0.9051.
This result shows that the increase on rainfall intensity will affect the water level of Pahang River. This analysis also shows that irregular variation of water level and rainfall intensity. The peak value of maximum and minimum that always changing also shows the condition of local climate and river hydrology that always changes due to the natural process that cannot be controlled by human (Singh, 1998; Mohd Saudia et al., 2015). The peak value of
maximum is positive while minimum value is negative referred to water level and rainfall data.
For the data distribution in this analysis, Fig. 3 shows the data distribution of relationship between water level and rainfall of Pahang River. The distribution of the data shows that Kg Serambi, Kuala Lipis, Sg. Yap and Temerloh station was the most signiicant correlation of the two parameters (water level and rainfall data). The percentages of signiicant are 73.79% that is high due to the rainfall amounts that lead to the water level increased.
Table 1. Factor loading values of water level-rainfall from Principle Component Analysis (PCA)
F1 F2 F3 F4 F5 F6 F7 tmr (Temerloh) 0.8503 -0.0863 0.0454 0.3784 0.3475 -0.0544 -0.0247
lp (Lubuk Paku) 0.2586 0.7821 0.5649 -0.0428 0.0209 0.0006 0.0030 yap (Sg. Yap) 0.9330 0.0101 -0.0752 0.1164 -0.1213 0.3088 0.0118
(b)
(c) (a)
4. Conclusions
For overall, applications of the Geographical Information System (GIS) and statistical analysis in this study actually help in order to fulil the objective of this study. Major flood event that hit Pahang River Basin is caused by high rainfall intensity especially in highlands area. The met of water in high velocity from Semantan River and Pahang River also lead to the major lood event in Pahang. Using interpolation method in GIS to Isohyet map, the distribution and the intensity of rainfall in Pahang River Basin is easily indicated and analysed to have a clear picture of the factors that lead to the disaster event. Rainfall distribution in Pahang River Basin that focused in upstream area leads to the initial lood in Jerantut and Kuala Lipis. Rainfall distribution analysis is very important in order to identify the area that is hit by heavy rainfall that leads to lood. Non-parametric analysis such as PCA and SPC also play important features in this study. The statistical analysis is required to evaluate the hydrological data and present the best tools and information for decision making. This study is also performed in order to help in lood assessment and forecasting of lood event in the future.
Figure 2. Statistical Process Control (SPC) of water level-rainfall in Pahang River
Acknowledgements
The authors acknowledge the financial assistance from the Ministry of Education and UniSZA under FRGS,
RAGS & GOT Grant (Grant no.: FGRS/1/2015/STWN01/ UNISZA/02/1, RAGS/1/2015/WAB05/UNISZA/02/1 and UNISZA/2015/GOT/03), Department of Drainage and Irrigation Malaysia (DID) for data supply and University Sultan Zainal Abidin (UNISZA) for giving us permission to utilize the research facilities, advice, guidance, and support
for this study.
References
Adnan NA, Atkinson PM. Hydrometeorological trend
analysis in a monsoon catchment. 8th annual meeting
of the EMS 2008; 5: EMS2008-A-00368.
DID. Department of Drainage and Irrigation (DID, JPS) Flood Archive 2010; 75.
Gasim MB, Toriman ME, Idris M, Lun PI, Kamarudin MKA, Nor Azlina AA, Mokhtar M, Sharifah Mastura SA. River low conditions and dynamic state analysis of Pahang River. American Journal of Applied Sciences 2013; 10(1): 42-57.
Hamilton JP, Whitelaw GS, Fenech A. Mean annual
temperature and total annual precipitation trends at Canadian biosphere reserves. Environmental Monitoring
and Assessment 2001; 67(1-2): 239-75.
Table 2. Sphiro- Wilk test of water level- rainfall from SPC analysis Normality tests:
Shapiro-Wilk test:
Jamaludin S, Sayang MD, Wan ZWZ, Abdul Aziz J. Trend in Peninsular Malaysia rainfall data during the southwest monsoon and northeast monsoon season: 1975-2004. Sains Malaysiana 2010; 39(4): 533-42.
Jayawardene HKWI, Sonnadara DUJ, Jayewardene DR. Trends of rainfall in Sri Lanka over the last century. Sri Lankan Journal of Physics 2005; 6: 7-17.
Juahir H, Zain SM, Yusoff MK, Hanidza TIT, Armi ASM,
Toriman ME, Mokhtar M. Spatial water quality
assessment of Langat River Basin (Malaysia) using
environmetric techniques. Environment Monitoring and
Assessment, 2011; 173(1): 625-41.
Kamarudin MKA, Toriman ME, Rosli MH, Juahir H, Abdul Aziz NA, Azid A, Mohamed Zainuddin SF, Sulaiman WNA. Analysis of meander evolution studies on effect
from land use and climate change at upstream reach
of Pahang River, Malaysia. Mitigation and Adaptation Strategies for Global Change 2015a; 20(8): 1319-34. Kamarudin MKA, Toriman ME, Juahir H, Azid A, Gasim
MB, Saudi ASM, Umar R, Sulaiman NH, Ata FM, Mustafa AD, Amran MA, Yusoff WA, Azaman F. Assessment of river plan change using RS and GIS technique. Jurnal Teknologi 2015b; 76(1): 31-38.
Kamarudin MKA, Toriman ME, Sulaiman NH, Ata FM,
Gasim MB, Muhamad A, Yusoff WA, Mokhtar M, Amran MA, Abd Aziz NA. Classiication of tropical river using chemometrics technique: case study in Pahang River, Malaysia. Malaysian Journal of
Lun PI, Gasim MB, Toriman ME, Rahim SA, Kamarudin MKA. Hydrological pattern of Pahang River Basin and their relation to lood historical event. Jurnal e-Bangi 2011; 6(1): 29-37.
Mann HB. Nonparametric tests against trend. Econometrica 1945; 13(3): 245-59.
Mohd Saudia MS, Juahir H, Azid A, Kamarudin MKA, Kasim MF, Toriman ME, Abdul Aziz NA, Che Hasnam CN,
Samsudin MS. Flood risk pattern recognition using
chemometric technique: a case study in Kuantan River Basin. Jurnal Teknologi 2015; 72(1): 137-41.
Obled Ch, Wendling J, Beven K. The sensitivity of hydrological models to spatial rainfall patterns: an evaluation using observed data. Journal of Hydrology 1994; 159(1-4): 305-33.
Ogden LF, Julien PY. Runoff sensitivity to temporal and
spatial rainfall variability at runoff plane and small basin
scales. Water Resources Research 1993; 29(8): 2589-97.
Simeonov V, Stefanov S, Tsakovski S. Environmetrical
treatment of water quality survey data from Yantra River, Bulgaria. Microchimica Acta 2000; 134(1): 15-21. Singh VP. Effect of the direction of storm movement on
planar low. Hydrological Processes 1998; 12(1): 147-70.
Sulaiman NH, Kamarudin MKA, Mustafa AD, Amran MA, Azaman F, Zainal Abidin I, Hairoma N. Trend analysis of Pahang River using non-parametric analysis: mann kendall’s trend test. Malaysian Journal of Analytical
Figure 3. Biplot and variables distribution
Vega M, Pardo R, Barrado E, Debán L. Assessment of
seasonal and polluting effects on the quality of river
water by exploratory data analysis. Water Research 1998; 32(12): 3581-92.
Yue S, Wang CY. The mann-kendall test modified by effective sample size to detect trend in serially correlated hydrological series. Water Resources Management 2004; 18(3): 201-18.
Received 2 June 2016 Accepted 14 July 2016
Correspondence to
Dr. Mohd Khairul Amri Kamarudin
East Coast Environmental Research Institute (ESERI),
Universiti Sultan Zainal Abidin,
Gong Badak Campus, 21300
Kuala Terengganu, Malaysia
Tel: +60 9668 8698