www.ccarevista.ufc.br ISSN 1806-6690
Electrochemical attributes of water from Cerrado wetlands (Veredas),
Triângulo Mineiro region, Brazil
1Atributos eletroquímicos da água de veredas do Bioma Cerrado, região do Triângulo
Mineiro, Brasil
Diogo Costa Nascimento2*, Carolina Prado Berbert2 and Bruno Teixeira Ribeiro3
ABSTRACT - Veredas are wetlands typically found in the Brazilian Cerrado playing important environmental functions. The hydromorphic conditions control important processes and reactions occurring in these environments. The objective of this study was to assess the pH, redox potential (Eh), and electrolytic conductivity (EC) of water from five veredas located in the Triângulo Mineiro region, nearby Uberlândia and Uberaba, Minas Gerais State, Brazil. The pH and EC of water samples (in triplicate) collected in different positions (upper, middle and bottom) of the selected wetlands were monitored monthly from September 2014 to September 2015. Eh was monitored in an incubation experiment using soil samples from the superficial layer (0-20 cm) and subsurface layer (40-70 cm) of the middle position of two of the selected veredas. In general, pH ranged from 3.4 to 6.5 throughout the year. For EC, the values ranged from 1.0 to 67.0 μS cm-1. Most of the year, pH was between 4.2 and 5.1 and EC was around 9.0 μS cm-1. Under laboratory conditions, Eh decreased from oxidic conditions to suboxidic (reduced) conditions. There were no significant differences between the wetlands and soil layers regarding the variation of Eh.
Key words:Water pH. Redox potential. Hydromorphic environment.
RESUMO -Veredas são áreas úmidas típicas do Cerrado brasileiro que desempenham importantes funções ambientais. As condições de hidromorfismo controlam importantes processos e reações que ocorrem nas veredas. Objetivou-se com este trabalho, avaliar o pH, potencial redox (Eh) e condutividade eletrolítica (CE) da água de cinco veredas localizadas na região do Triângulo Mineiro, próximas dos municípios de Uberlândia e Uberaba, MG. No período de setembro de 2014 a setembro de 2015, mensalmente, foram determinados o pH e CE de amostras de água coletadas (em triplicata) em diferentes posições (terço superior, médio e inferior) das veredas selecionadas. O Eh foi monitorado em um experimento de incubação utilizando amostras de solo da camada superficial (0-20 cm) e subsuperficial (40-70 cm) do terço médio de duas das veredas selecionadas. Em geral, durante um ano, o pH variou de 3,4 a 6,5. A CE variou de 1,0 a 67,0 μS cm-1. Na maior parte do ano, o pH esteve entre 4,2 e 5,1 e, a CE, em torno de 9,0 μS cm-1. Em condições laboratoriais, o Eh decresceu de uma região oxidada para uma região suboxidada. Não houve diferenças significativas entre as veredas e camadas de solo avaliadas quanto à variação do Eh.
Palavra-chave:pH da água. Potencial redox. Ambiente hidromórfico.
DOI: 10.5935/1806-6690.20180002 *Autor para correspondência
Recebido para publicação em 24/05/2016; aprovado em 06/02/2017
1Pesquisa financiada pelo CNPq (Processo Nº 475922/2013-01) e parte da dissertação de mestrado do primeiro autor
2Instituto de Ciências Agrárias, Universidade Federal de Uberlândia, Av. Amazonas, s/n, bloco 2E, Umuarama, Caixa Postal 593, Uberlândia-MG,
Brasil, 38.400-902, diogo_mg1990@yahoo.com.br, carol_berbert@hotmail.com
3Laboratório de Química Ambiental, Departamento de Ciência do Solo, Universidade Federal de Lavras, Av. Doutor Sylvio Menicucci, 1001, Kennedy,
INTRODUCTION
Veredas are wetland environments typically found in the Cerrado, which play a great environmental
importance (JUNK et al., 2013). These wetlands are
mainly related to the existence and perenniality of watercourses, groundwater recharge, headwaters incidence (CARVALHO, 1991; FERREIRA, 2005), besides acting as source of food and shelter for fauna (GUAMARÃES; ARAÚJO; CORRÊA, 2002), and carbon stock and
greenhouse gas emissions (MITSCHet al., 2012; NEUE
et al., 1997). These environments are characterized by
hydromorphic soils (Gleysols and Organosols) commonly
associated with the presence of buriti palms (Mauritia
flexuosaL. f) (RAMOSet al., 2006).
Given its position in the landscape (depressions), the wetlands are subject to contamination by sediments of erosion and flood, and can act as a site of accumulation
of pollutant elements and molecules (BAI et al., 2010;
GRYBOSet al., 2007; GRYBOSet al., 2009; JACOBet al.,
2013; LOCKWOODet al., 2015; ROSOLENet al., 2015).
In this context, we can highlight the great transformation to which the Cerrado environment has undergone over the last 40 years, with the conversion of native vegetation into areas of grasslands, grain production and planted forests (LOPES; GUILHERME, 2016). Changes in land use can significantly influence the balance of tropical wetlands
(NEUEet al., 1997).
In hydromorphic environments, electrochemical properties such as pH and redox potential (Eh) are extremely important since they control various processes and reactions, such as: soil charge (organic and mineral)
(CAMARGO; SANTOS; ZONTA, 1999; SILVA et al.,
2015); decomposition and solubilization of organic matter
(OLIVIE-LAUQUETet al., 2001); form, availability and
mobility of elements (ESSINGTON, 2005; GUILHERME
et al., 2005); and greenhouse gas emissions (MITSCHet
al., 2012). Despite its importance, few studies regarding
electrochemical properties of the wetlands in Brazilian Cerrado have been found in the literature.
The objective of this study was monitoring monthly (from Sept. 2014 to Sept. 2015) the changes in water table depth, water pH and water electrolytic conductivity (EC) in Cerrado wetlands (Veredas) nearby Uberlândia and Uberaba, Minas Gerais State, Brazil. Also, to evaluate redox potential variation under laboratory conditions.
MATERIAL AND METHODS
Five patches of Cerrado wetlands (W1, W2, W3, W4, and W5) were selected nearby Uberlândia and
Uberaba, Minas Gerais State, Brazil. The geographic coordinates and altitudes are shown in Table 1. The local climate is classified as “Aw” (Köppen’s classification), with dry (beginning of April to end of August) and rainy (beginning of September to end of March) seasons well defined. The lowest historical mean daily rainfall occurs in mid-July, and the highest in the last and first 10-day period of December and January, respectively (RIBEIRO; COSTA JUNIOR; SILVA, 2013).
The local historical weather data related to temperature and rainfall from 1981 to 2013 (Figure 1) were gathered from the database of the Climatology and Water Resources Laboratory of the Federal University of Uberlândia (LACRH/UFU). Whereas the study period dataset (September 2014 to September 2015) was obtained from the Brazilian National Institute of Meteorology (INMET, 2016).
For each wetland patch, three transects were established (T1, T2, and T3), which consisted of imaginary lines towards the slope and perpendicular to the wetland flow, within the hydromorphic region spaced in nearly 50 m (Figure 2). Each transect was split into upper, middle, and bottom position. Then, PVC tubes (1.5 m long and 15 cm diameter) were stuck in the upper and middle positions at 1.0 m depth. These tubes functioned as piezometers for water table depth measuring and water sampling. We made 2-mm holes on the underground tube part for lateral water entry. As stated above, there were nine sampling points per wetland patch. In the bottom position, samples were taken from the surface water by immersing a collector pot to a 10-cm depth.
Monthly, from September 2014 to September 2015, the water table depth was recorded and water samples from tubes were carried out for laboratory determination of pH and electrolytic conductivity (EC). Water table depth variation curves were obtained as a function of time. Flooded layers were integrated through Image J software (version 1.5f3), allowing the estimative of the number of days that the layers 0-20 cm and 40-70 cm remained completely saturated between September 2014 and September 2015.
An incubation experiment was carried out under lab conditions to measure the redox potential (Eh) variation as function of waterlogged time. The samples were collected from layers 0-20 cm (organic layer) and 40-70 cm (gley layer) of W1 and W3. W1 is
representative of a geomorphic area, known asChapada,
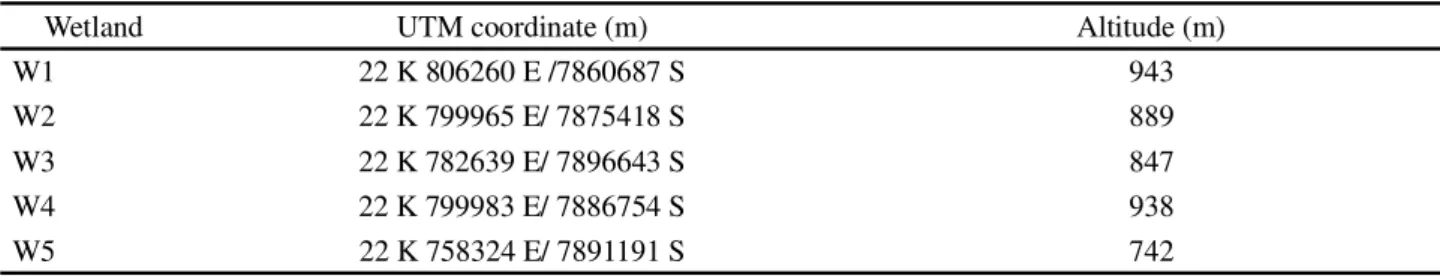
Table 1 - Geographical coordinates and altitudes of each selected wetland
Wetland UTM coordinate (m) Altitude (m)
W1 22 K 806260 E /7860687 S 943
W2 22 K 799965 E/ 7875418 S 889
W3 22 K 782639 E/ 7896643 S 847
W4 22 K 799983 E/ 7886754 S 938
W5 22 K 758324 E/ 7891191 S 742
Figure 1 -Mean monthly rainfall and temperatures (1981 to 2013) (a) and studied period dataset (from September 2014 to September 2015) (b) for Uberlândia region, Minas Gerais State, Brazil. Source: Climatology and Water Resources Laboratory, Federal University of Uberlândia (LACRH/UFU) (a), and National Institute of Meteorology (INMET, 2016) (b)
sieve. Then, they were packed into PVC tubes (10-cm height and 12-(10-cm diameter) filled to a height (h)
corresponding to the total soil volume (750 cm-3). Soil
bulk density of surface-layer samples from W1 and
W3 were 0.70 and 0.88 g cm-3, respectively. Yet, the
Figure 2 - Lateral view of one of the transects and PVC tube installation layout in the upper and middle positions within the hydromorphic region
and 1.50 g cm-3, respectively. The samples were fully
saturated with water from the wetlands, maintaining a water blade of about 1 cm above the sample surface. The volume of water required for complete sample saturation was determined based on the total porosity (TP) of each sample (Equation 1):
(1)
Where: TPis the total pore volume (cm3 cm-3);Ds is
soil bulk density (g cm-3), and Dp is particle density
(g cm-3). Dp was determined by the volumetric flask
method (BLACK; HARTGE, 1986).
By means of a hole made on the PVC buffer tubes, samples were measured for Eh and pH, on the following days: 1st, 2nd, 3rd, 4th, 5th, 6th, 7th, 8th, 11th, 15th, 20th, 22nd, 27th,
29th, and 32nd. Eh measurements were performed using a
HANNA portable meter (model HI991002) with an Ag/ AgCl electrode; the measures were corrected to a standard hydrogen electrode (JARDIM, 2014). Table 2 shows some of the soil properties used in the incubation test.
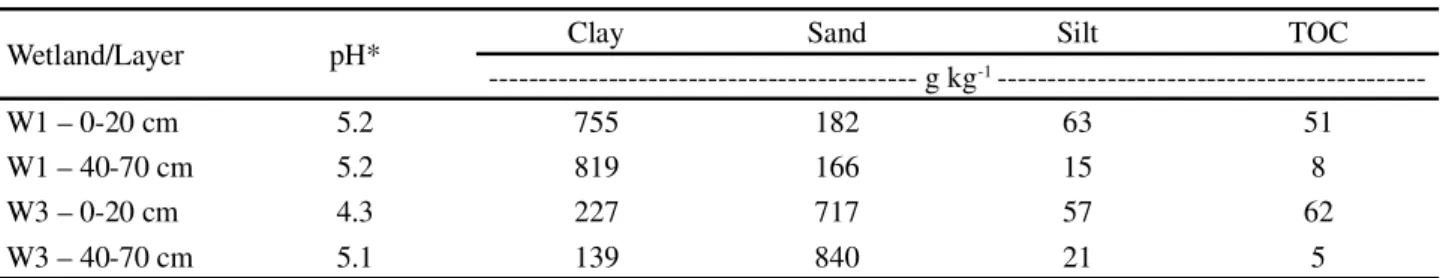
Table 2 - Some properties of soil samples from the 0-20 cm and 40-70 cm layers of W1 and W3 used in the Eh incubation experiment
*soil pH at the soil: water ratio of 1: 2.5. Clay, sand, and silt contents determined by the pipette method. TOC – total organic carbon. All the determinations were according to Embrapa (2011)
Wetland/Layer pH* Clay Sand Silt TOC
--- g kg-1
---W1 – 0-20 cm 5.2 755 182 63 51
W1 – 40-70 cm 5.2 819 166 15 8
W3 – 0-20 cm 4.3 227 717 57 62
RESULTS AND DISCUSSION
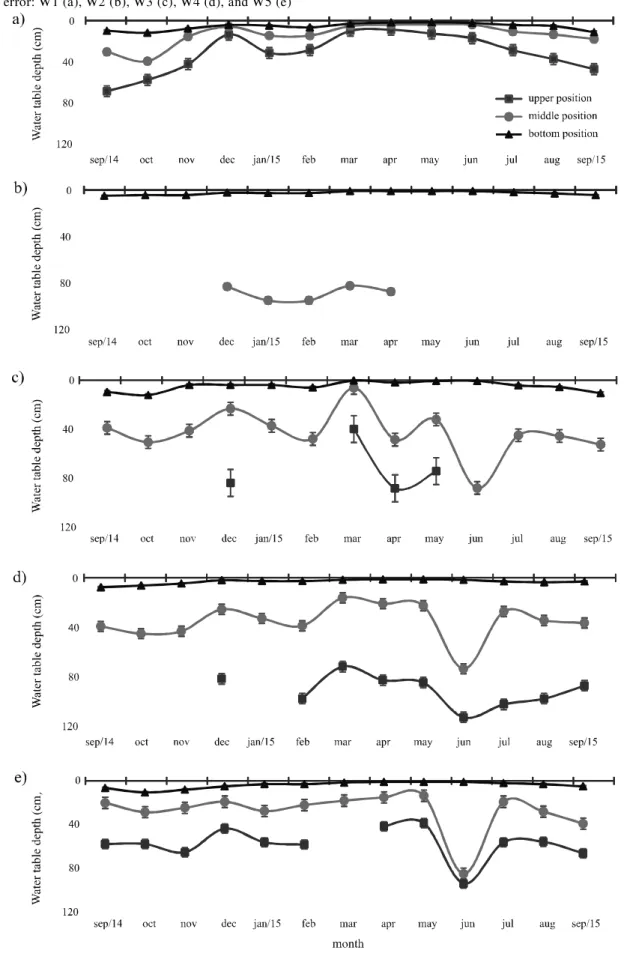
In the middle position of W1, the water table was initially at a 30-cm depth, emerging to the surface after the onset of rains (November 2014), and remained practically constant until September 2015. As for the upper position, the water table was initially at 70-cm depth (September 2014), and then, close to the surface in December 2014, dipping again from April 2015 on.
Although the sampling point of W2 had been placed in a hydromorphic region (indicated by gley coloring and mottling), the water table was below a depth of 100 cm in the upper position. In the middle position, the water table was identified at a depth of 80 to 100 cm, only from December 2014 to April 2015.
From September 2014 to February 2015, the water table was between 25 and 50 cm deep in the middle position of W3, being close to the surface in March 2015. The largest depth (90 cm) occurred in June 2015. With respect to the upper position of the same wetland, the water table was present in December 2014, and from March to May 2015. The middle position of W4 presented a similar behavior to W3. Regarding the upper position, the water table was detected at 80-cm depth in December 2014, remaining between 80 and 120 cm from February 2015 to September 2015.
As for the middle and upper positions of W5, the water table was within a depth range between 20 and 50 cm from September 2014 to May 2015. In June 2015, it reached a depth of 80 cm but rising again from July 2015 on.
Concerning the bottom position of the wetlands, the soil remained saturated with water close to the surface throughout the studied period. For the middle and upper positions, the floods were periodical (Figure 3). Waterlogging in wetlands is responsible for organic matter increase and the formation of Organosols, and redox conditions allowing the formation of Gleysols (RAMOS
et al., 2006). Seasonal flooding is typical of palm swamps,
influence oxy-reduction processes, and electrochemical behavior of soil solid-phase (CAMARGO; SANTOS; ZONTA, 1999). Based on the water table depth variations over time, as shown in Figure 3, we could estimate how long a given layer of the wetlands remained flooded (Table 3).
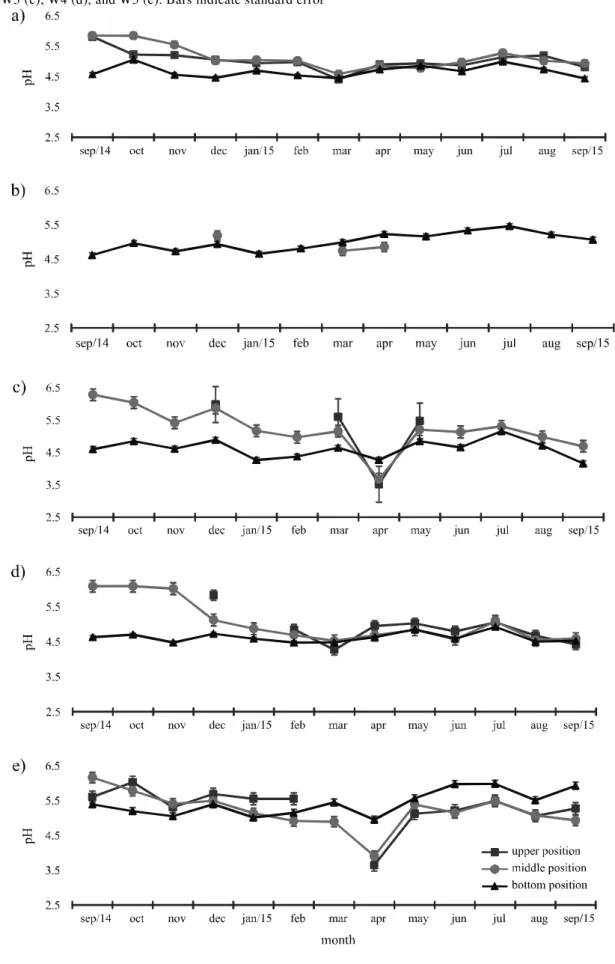
There was a pH variation in water samples over time (Figure 4). For all wetlands regardless the position, average pH was 5.0, with minimum and maximum values of 3.4 and 6.5, respectively. Overall, pH variation (maximum to minimum) decreased in all wetlands as follows: upper position > middle position > bottom position. The highest variation was observed for upper position of W3 (2.9 pH units), and the lowest for bottom position of W4 (0.9 pH units).
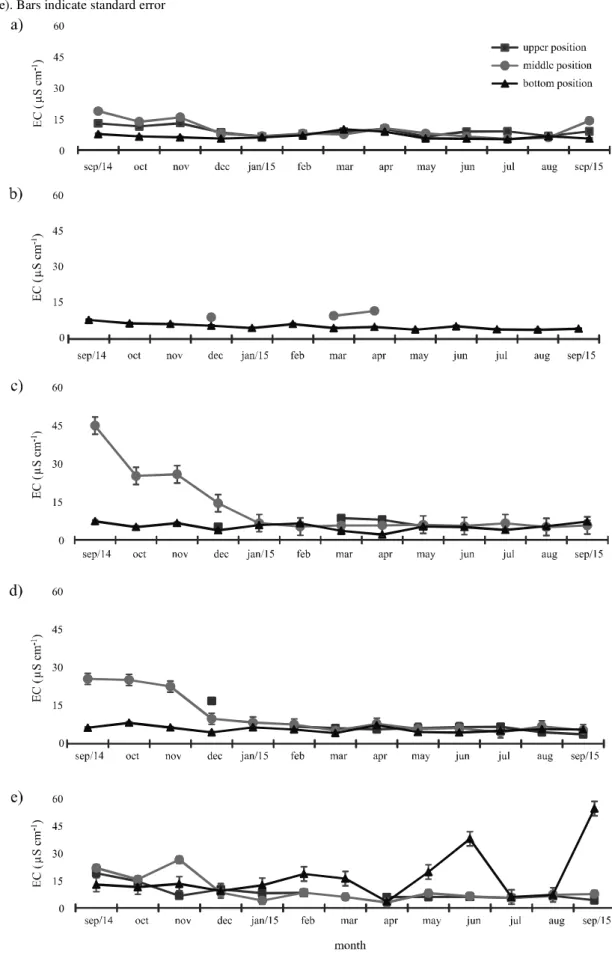
EC also varied throughout the year in all wetlands (Figure 5). During the studied period, all the wetlands showed greater variation in EC for the middle and upper positions (when the water was present). In the bottom position, EC remained constant over time. In September
2014, a maximum EC (~ 20 µS cm-1) occurred in the
middle position of W1 with no significant differences among the sampling positions from December 2014 to August 2015. A similar behavior was observed for W3 and W4. However, in September 2014, EC surpassed 40 µS
cm-1 in W3. In W5, it was below 30 µS cm-1 with peaks in
June and September 2015.
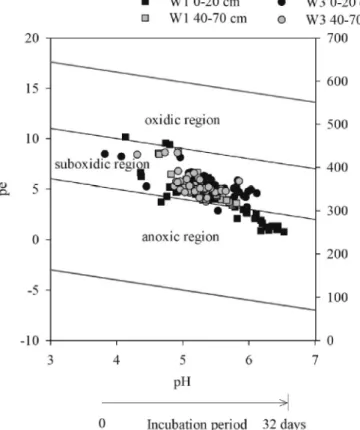
Figure 6 (a) and (b) show the variations in Eh, pE, and pH of the samples from 0-20 cm and 40-70 cm layers in W1 and W3. These results were obtained under lab conditions for a 32-day incubation period. According to Husson (2013), the redox potential in soils has high-amplitude fluctuations, being temporally influenced by daily cycles and strong seasonal influences. In general, Eh is rapidly reduced once the soil is saturated (flooding), restoring the normal level within a few days after soil drainage (HUSSON, 2013). While positive Eh values indicate oxidizing conditions, negative ones indicate electron availability or reducing conditions (JARDIM, 2014). Moreover, decreasing Eh values show a high consumption of soil organic matter
(SILVAet al., 2015).
No significant differences were observed among the samples (Figure 6a and 6b). As early as the first days of incubation, we noted the diffusion of samples from a zone considered oxidic to another with suboxidic conditions. In addition, the surface layer sample of W3 reached an anoxic
zone at the end of the incubation period. Since H+ ions
are consumed in reducing environments, after a time of flooding, the pH also increases (Figure 6). These changes in Eh and pH are determinant for the form, mobility, and availability of elements and substances (GUILHERME
et al., 2005). Furthermore, Silva et al. (2000) observed
increases in Fe, P, S, Mn, Cu, and Zn after soil flooding with consequent reduction of iron and manganese oxides, besides a concomitant production of organic complexing agents.
For low pH (<5), Rosolen et al. (2015) have
already reported the presence of more mobile and soluble metal complexes in the wetlands of Triângulo Mineiro, what might have promoted the migration of As, Cr, Mn and Ni towards deepest soil layers. Conversely, Martins
et al. (2011) reported higher cation exchange capacity
and a most effective complexation by soil organic matter under increasing pH values.
Table 3 - Estimation of days under total flooding of the 0-20 cm and 40-70 cm layers of five studied wetlands, Triângulo Mineiro region, from September 2014 to September 2015
Position Layer
wetland
W1 W2 W3 W4 W5
- Period of flooding (days)
---Bottom 0-20 cm 250 305 261 299 292
40-70 cm 365 365 365 365 365
Middle 0-20 cm 149 0 9 4 16
40-70 cm 341 0 205 240 294
Upper 0-20 cm 43 0 0 0 0
40-70 cm 253 0 192 3 78
(2005) observed the configuration of adsorption sites as a function of pH on a kaolinite surface (1:1 clay mineral present in the area under study). In this study,
the adsorption sequence found for pH50 values (the one
at which half of the available elements are adsorbed) was Cu <Zn <Pb <Cd. Adsorption at permanent sites predominated for values up to 5.7, 6.0, 7.3, and 8.0 for the elements Cu, Pb, Zn, and Cd, respectively.
On the 32nd day of incubation, Eh ranged from 574
to 51 mV (layer 0-20 cm) and from 508 to 237 mV (layer
40-70 cm) in W1 (very clayey soil in theChapada). The
superficial layer (more organic) showed a greater variation (reduction of 524 mV) if compared to the subsurface layer (gleyzed), which had a reduction of 271 mV. The pH varied from 4.5 to 6.3 (layer 0-20 cm) and from 4.8 to 5.5 (layer 40-70 cm).
Meanwhile, for wetland 3 (sandy soil in the Bauru surface) the variation was from 489 to 276 mV (layer 0-20 cm) (reduction of 213 mV) and from 505 to 283 mV (layer 40-70) (reduction of 222 mV). Furthermore, the pH increased from 4.2 to 5.7 and 4.6 to 5.5 (0-20 cm layer and 40-70 cm, respectively). While elements such as As, Se, Mn, and Fe are directly influenced by the oxidation conditions, Cd, Pb, Ni, Zn, and Cu are not directly affected by electron transfer. The following considerations about some elements of environmental relevance are based on the redox speciation diagrams presented by Essington (2005):
a) As: in the oxidic and suboxidic zone (Figure
6) will occur the forms H3AsO40, H
2AsO4-, and HAsO42-.
In the anoxic zone and between pH 4.0 and 6.5, As will
occur as As(OH)30. Under anoxic condition and very high
pH (> 9.0), the As (OH) 4- form will occur.
b) Se: depending on the redox conditions, different
forms of Se may occur (H2SeO30, SeO
42, HSeO3-, H2Se0,
SeO32- , and HSe-). Under anoxic conditions (Figure 6), Se
will occur as HSe-.
c) Mn: under reducing conditions, Mn4+ is
reduced to Mn2+. However, other forms may occur
depending on the combination of the pH value and
the Eh, such as MnO2, MnOOH, Mn3O4,and MnCO3.
Concerning the Eh incubation experiment (Figure 6),
the samples remained in a pH versus Eh range within
which determines the occurrence of Mn in its reduced
form (Mn2+).
d) Fe: under reducing conditions, Fe3+ [Fe(OH)
3;
Fe2O3; FeOOH] is reduced to Fe2+ (soluble form). Other
forms may occur under conditions of low Eh values and
high pH values, such as Fe3O4 and FeCO3. Within the
range of pH and Eh comprising the samples (Figure 6),
the predominant Fe form was Fe2+.
e) Cd, Pb, Ni, Zn e Cu: under oxidic conditions, the concentration of these elements in the soil solution is given by the soil reaction (ion exchange) and sorption in the solid phase. Such elements are also controlled by the solubility of their carbonates, hydroxy-carbonates, and phosphates. Under reducing conditions, precipitation of these elements may occur due to the pH increase. If the environment contains S, which will be in the reduced form
(S2-), stable forms of sulfides may occur CdS, PbS, NiS,
ZnS, and CuS.
When a similar flooding study was carried out under laboratory conditions, using samples of the 0-20 cm layer of a Haplic Gleysol from the Amazonia, the initial Eh of + 49 mV decreased to - 206 mV on the third day,
stabilizing at - 390 mV after the 39th day (SILVAet al.,
2015). The decrease in Eh was accompanied by an increase in pH (from 5.8 to 7.2). Additionally, changes in Eh and pH affected the availability of P, S, Fe, Mn, Cu, and Zn.
Likewise, Grybos et al. (2009) found an Eh
Figure 6 - Variation in pEversus pH (a), and Ehversus pH (b) of the samples from the layers 0-20 cm and 40-70 cm in the studied wetlands (W1 and W3), waterlogged under laboratory conditions for 32 day-period
dissolved organic carbon, total Fe, Mn, and a reduction
of NO3-. It is noteworthy that neither Gryboset al. (2009)
nor Silvaet al. (2015) mentioned whether the reported Eh
values were corrected to the standard hydrogen electrode. Jardim (2014) has already critically approached such need for correction.
Since Eh and pH stabilize after a flooding period and based on the number of days a year in which a layer was fully flooded (Table 3), we can infer how much a system remained under suboxic or anoxic conditions. As an example, after 32 days of incubation, W1 surface layer reached an anoxic condition (Figure 6). Under natural conditions, this soil material remained flooded for 149 days from September 2014 to September 2015. In addition, based on the variation curves of subsurface water depth, we may check the frequency of
oxidation and reduction cycles. Olivie-Lauquet et al.
(2001) studied seasonal changes in water table depth and their effects on the cycling and transfer of trace elements in wetlands of France. Finally, the dissolved concentrations of Fe, Mn, Al, La, U, Th, Cd, and As were strongly influenced by the changes in Eh, pH, and dissolved organic carbon.
CONCLUSION
During the evaluation period (September 2014 to September 2015), water pH in the studied wetlands ranged from 3.4 to 6.5, remaining most of the year between 4.2 and 5.1. The electrolytic conductivity ranged from 1.0 to
67.0 μS cm-1, and average of 9.0 μS cm-1. Under laboratory
conditions, Eh decreased from oxidic to suboxidic conditions, and no significant differences among the soil materials (surface or subsurface) for all studied wetlands were observed.
ACKNOWLEDGMENTS
REFERENCES
BAI, J.et al. Some heavy metals distribution in wetland soils under different land use types along a typical plateau lake, China.
Soil and Tillage Research, v. 106, n. 2, p. 344-348, 2010. BLACK, G. R.; HARTGE, K. H. Bulk density.In: KLUTE, A.
Methods of soil analysis. part 1: Physical and mineralogical methods. 2. ed. Madison: ASA-SSSA, 1986, p. 363-375. CAMARGO, F. A. O; SANTOS, G. A.; ZONTA, E. Alterações eletroquímicas em solos inundados.Ciência Rural, v. 29, n. 1, p. 171-180, 1999.
CARVALHO, P. G. S. As Veredas e sua importância no domínio dos cerrados.Informe Agropecuário, v. 15, n. 168, p. 54-56, 1991.
EMPRESA BRASILEIRA DE PESQUISA AGROPECUÁRIA.
Manual de métodos de análises de solos. 2. ed. Rio de Janeiro: Embrapa Solos, 2011. 230 p.
ESSINGTON, M. E.Soil and water chemistry: an integrative
approach. Boca Raton: CRC Press, 2005. 656 p.
FERREIRA, I. M. Bioma Cerrado: caracterização do subsistema de Vereda.Observatório Geográfico de Goiás, v. 1, p. 1-13,
2005.
GRYBOS, M. et al. Increasing pH drives the release of organic matter from wetlands soils under reducing conditions.
Geoderma, v. 154, n. 1/2, p. 13-19, 2009.
GRYBOS, M. et al. Is trace metal release in wetland soils controlled by organic matter mobility or Fe-oxyhydroxides reduction?Journal of Colloid and Interface Science, v. 314, n. 2, p. 490-501, 2007.
GUILHERME, L. R. G. et al. Elementos traço em solos e sistemas aquáticos.Tópicos em Ciências do Solo, v. 4, p. 385-382, 2005.
GUIMARÃES, A. J.; ARAÚJO, G. M.; CORRÊA, G. F. Estrutura fitossociológica em área natural e antropizada de uma vereda em Uberlândia, MG.Acta Botânica Brasílica, v. 16, n. 3, p. 317-329, 2002.
HUSSON, O. Redox potential (Eh) and pH as drivers of soil/ plant/microorganism systems: a transdisciplinary overview pointing to integrative opportunities for agronomy. Plant and Soil, v. 362, n. 1, p. 389-417, 2013.
INSTITUTO NACIONAL DE METEOROLOGIA. 2015. Disponível em: <http://www.inmet.gov.br/portal/index. php?r=estacoes/estacoesAutomaticas>. Acesso em: 01 maio. 2016.
JACOB, D. L. et al. Cadmium and associated metals in soils and sediments of wetlands across the Northern Plains, USA.
Environmental Pollution, v. 178, p. 211-219, 2013.
JARDIM, W. F. Medição e interpretação de valores do potencial redox (Eh) em matrizes ambientais. Química Nova, v. 37, n. 7, p. 1233-1235, 2014.
JUNK, W. J. et al. Brazilian wetlands: their definition, delineation, and classification for research, sustainable management, and protection.Aquatic Conservation: Marine and Freshwater Environments, v. 24, n. 1, p. 5-22, 2013. LOCKWOOD, C. L. et al. Leaching of copper and nickel in soil-water systems contaminated by bauxite residue (red mud) from Ajka, Hungary: the importance of soil organic matter.
Environmental Science and Pollution Research, v. 22, n. 14, p. 10800-10810, 2015.
LOPES, A. S.; GUILHERME, L. R. G. A career perspective on soil management in the Cerrado Region of Brazil.Advances in Agronomy, v. 137, p. 1-72, 2016.
MARTINS, C. A. S.et al. A dinâmica de metais traços no solo.
Revista Brasileira de Agrociência, v. 17, n. 3/4, p. 383-391, 2011.
MITSCH, W. J. et al. Wetlands, carbon, and climate change.
Landscape Ecology, v. 28, n. 4, p. 583-597, 2012.
NEUE, H. U.et al. Carbon in Tropical Wetlands.Geoderma, v. 79, n. 1/4, p. 163-185, 1997.
OLIVIE-LAUQUET, G. et al. Release of trace elements in wetlands: role of seasonal variability.Water Research, v. 35,
n. 4, p. 943-952, 2001.
RAMOS, M. V. V.et al. Veredas do Triângulo Mineiro: solos, água e uso.Ciência e Agrotecnologia, v. 30, n. 2, p. 283-293, 2006.
RIBEIRO, B. T.; COSTA JUNIOR, D. F.; SILVA, C. R. 10-day probable rainfall for Uberlandia, Minas Gerais State, Brazil.
Bioscience Journal, v. 29, n. 3, p. 536-542, 2013.
ROSOLEN, V. et al. Contamination of wetland soils and floodplain sediments from agricultural activities in the Cerrado Biome.Catena, v. 128, p. 203-210, 2015.
SILVA, G. R. et al. Eletrochemical changes in Gleysol of the Amazon estuary. Amazonian Journal of Agricultural and Environmental Sciences, v. 58, n. 2, p. 152-158, 2015. SRIVASTAVA, P.; SINGH, B.; ANGOVE, M. Competitive adsorption behavior of heavy metals on kaolinite. Journal of Colloid and Interface Science, v. 290, n. 1, p. 28-38, 2005.