Nitrogen management in wheat based on the normalized
difference vegetation index (NDVI)
Manejo do nitrogênio em trigo baseado no índice de vegetação por diferença normalizada (NDVI) André Luis Vian1 Christian Bredemeier1* Marcos Alexandre Turra1
Cecília Paz da Silva Giordano1 Elizandro Fochesatto2 Jhonatan Alves da Silva1 Maicon Andreo Drum1 ISSNe 1678-4596
INTRODUCTION
Nitrogen (N) availability in wheat is essential for obtaining high yield potential, as it
influences the numbers of tillers emitted and those surviving, the number of grains per spike, and the
grain weight and protein content (MANTAI et al.
2016). BREDEMEIER et al. (2016) defined the growth stage of six fully expanded leaves on the main stem as the ideal time for N topdressing application to wheat, while the N dose is defined based on soil
organic matter content, previous crop, and expected
grain yield (REUNIÃO..., 2017).
The use of these parameters is simple yet incomplete, since nitrogen is a dynamic element in soil, and undergoes several processes modifying its form, such as mineralization, immobilization, and denitrification. Additionally, N uptake by crop varies among years and among areas in the same field
(CHAVARRIA et al., 2015). Therefore, the application
of a uniform N rate in the field without considering
spatial differences in soil nutrient supply capability
1Departamento de Plantas de Lavoura, Programa de Pós-graduação em Fitotecnia, Universidade Federal do Rio Grande do Sul (UFRGS), Av.
Bento Gonçalves, 7712, Bairro Agronomia, 91501-970, Porto Alegre, RS, Brasil. E-mail: [email protected]. *Corresponding author.
2Departamento de Agronomia, Faculdades Integradas do Vale do Iguaçu (UNIGUAÇU), União da Vitória, PR, Brasil.
ABSTRACT: Biomass production and nitrogen (N) accumulated in wheat shoots may be used for quantifying optimal topdressing nitrogen doses. The objective of this study was to develop and validate models for estimating the amount of biomass and nitrogen accumulated in shoots and the N topdressing dose of maximum technical efficiency in wheat using the normalized difference vegetation index (NDVI) measured by an active optical canopy sensor. Field experiments were carried out in two years and treatments consisted of N doses applied at plant emergence and as topdressing. NDVI, shoot biomass and N accumulated in shoots at the growth stage of six fully expanded leaves and grain yield were evaluated, being determined the topdressing N dose of maximum technical efficiency (DMTE). The NDVI was positively correlated to shoot biomass and N content in shoots and models for the relationship between these variables were developed and validated. The DMTE was negatively correlated with the NDVI value evaluated at the moment of N topdressing application. Thus, NDVI evaluation by an active optical canopy sensor can be used for nitrogen fertilization in variable rate, allowing the adjustment of applied N doses in different areas within a field.
Key words: Triticum aestivum, vegetation sensor, variable rate, Greenseeker.
RESUMO: A produção de biomassa e o conteúdo de nitrogênio (N) acumulado na parte aérea de trigo podem ser utilizados na quantificação
da dose ótima de N em cobertura. O objetivo deste estudo foi desenvolver e validar modelos para a estimativa das quantidades de biomassa e nitrogênio acumulado na parte aérea e a dose de máxima eficiência técnica de N em cobertura em trigo utilizando o Índice de vegetação por diferença normalizada (NDVI) medido por sensor óptico ativo de dossel. Experimentos foram conduzidos a campo, em dois anos, e os tratamentos constaram de doses de N aplicadas na emergência das plantas e em cobertura. Foram avaliados o NDVI, a biomassa e a quantidade de N acumulada na parte aérea no estádio de seis folhas completamente expandidas e o rendimento de grãos, sendo determinada a dose de máxima eficiência técnica de N em cobertura (DMET). O NDVI apresentou correlação positiva com a biomassa e quantidade de N acumulada na parte aérea e modelos para as relações entre estas variáveis foram propostos e validados. A DMET correlacionou-se negativamente com o valor de NDVI avaliado no momento da aplicação de nitrogênio em cobertura. Assim, a avaliação do NDVI por sensor óptico ativo de dossel pode ser utilizada para a adubação nitrogenada em taxa variável, permitindo o ajuste da dose de N aplicada em diferentes locais da lavoura.
Palavras-chave: Triticum aestivum, sensor de vegetação, taxa variável, Greenseeker.
results in lower nitrogen use efficiency (INMAN et al., 2005). Thus, farmers tend to apply sufficient N at uniform rates to meet crop requirements in the most demanding areas in the field, resulting in greater risk of N losses in areas requiring lower amounts of this
nutrient (BASSO et al., 2011). Therefore, the actual needs of the crop are not supplied in certain places in
the field, leading to the application of N doses above or below the amount required.
The use of other variables for N fertilization recommendation, such as shoot biomass production and amount of accumulated N in the plant, is limited
because of the delay in the evaluation procedure,
and because this requires laboratory analyses
(BREDEMEIER et al., 2016); although, these variables are reliable indicators of the response to top dressed nitrogen application. Contrastingly, the evaluation of
canopy reflectance can help estimate the nutritional status of plants in relation to N, determining its spatial variability in a field (SINGH et al., 2017). Optical reflectance canopy sensors mounted on agricultural machines, such as Greenseeker®, N-Sensor®, and Crop
Circle®, enable real-time reflectance readings with high
spatial resolution, permitting variable rate nitrogen fertilization (COLAÇO & BRAMLEY, 2018). RAUN et al. (2002) showed that the use of the Greenseeker sensor for N fertilizer recommendation for wheat resulted in 15% increase in N use efficiency. However, the use of these sensors as a tool in N management involves the development of algorithms that estimate
the N dose to be applied at variable rates based on different vegetation indexes evaluated by the canopy
sensors, such as the normalized difference vegetation
index (NDVI).
The objective of this study was to develop
and validate models for estimating the amount of biomass and nitrogen accumulated in shoots and the N topdressing dose of maximum technical efficiency in
wheat at the growth stage of six fully expanded leaves,
using the Normalized difference vegetation index (NDVI) measured by an active optical canopy sensor.
MATERIALS AND METHODS
Field experiments were conducted in 2014 and 2015 at the Agronomic Experimental Station of the Universidade Federal do Rio Grande do Sul (Eldorado do Sul, Brazil), on an Ultisol (Rhodic Paleudult) exhibiting the following physical and chemical characteristics in the 0-20cm layer: clay=250g dm-3;
pH=5.2 (H2O); P=42mg dm
-3 (Mehlich-1); K=202mg
dm-3 (Mehlich-1); organic matter=18g dm-3 and soil
bulk density (0-5cm)=1350kg m-3. The methods
used for soil analyses are described in TEDESCO
(1995). The climate of the region is classified as Cfa (subtropical with wet and hot summer), according to Koeppen climate classification.
Treatments consisted of doses of N applied at plant emergence (base) (0, 20, 40, and 60kg ha−1)
and as topdressing (0, 20, 40, 60, and 80kg ha−1) in the
form of urea at the growth stage of six fully expanded leaves on the main stem. In 2014, the cultivars used were Quartzo and TBIO Sintonia. In 2015, TBIO Sintonia, TBIO Sinuelo, and TBIO Toruk were used, all of which recommended for cultivation in the
region in which the present study was carried out
(REUNIÃO…, 2017). Sowing on maize straw was performed on July 10, 2014 and July 15, 2015 at a density of 330seeds m−2.
The experiments were conducted in a randomized block experimental design with split-plots and four replicates, being the main split-plots constituted by the N doses applied at plant emergence
and the subplots by the topdressing N doses. Each
subplot comprised 10 rows of 3.5m in length, with row spacing of 0.18m, constituting 6.3m2. Fertilizer
doses at sowing were 60kg ha−1 of P2O5 and 90kg
ha−1 of K2O. The other crop management practices
were performed according to recommendations for
wheat (REUNIÃO..., 2017).
At the growth stage of six fully expanded
leaves, the normalized difference vegetation index
(NDVI) was evaluated using the Greenseeker® sensor
by the relation: (ρNIR-ρR)/(ρNIR+ρR), where ρNIR and ρR denote the near-infrared (780nm) and red (670nm) reflectance, respectively. The equipment was positioned at 1.0m above the canopy, and
readings were obtained for the entire plot, totaling
approximately 50 NDVI values in each experimental unit. Subsequently, plants were sampled in an area
of 0.27m2, and shoot biomass was determined after
drying the samples at 65°C until constant mass was reached. The amount of accumulated N in shoots was determined by multiplying shoot biomass by plant N concentration, which was determined using the semimicro-Kjeldahl method (TEDESCO et al., 1995), and expressed in “kg ha−1.” The above mentioned
analyses were conducted in the same way in the two years of the study. Immediately after these analyses, the top dressed application of N at the predetermined doses was performed.
In 2014, NDVI values were correlated
with shoot biomass and amount of accumulated N in
each wheat cultivar. The criteria used for choosing the
sum of squares (TOEBE et al., 2010). For comparison
between regressions adjusted for each cultivar, the
confidence interval (p=0.05) of each regression was determined with Sigma Plot 8.0 and Assistant 7.6 software. If the confidence intervals of the regressions
overlap, one can concluded that the regressions are
significantly similar at the significance level of p=0.05 (GOMES, 1990). This procedure aimed to compare
the regressions between the different cultivars, in
order to evaluate if there were significant differences between them or if a single regression model could be
developed for the cultivars used in the present study.
The models developed in 2014 for the relationship between NDVI, shoot biomass, and accumulated N were validated in 2015. For this, the relationship between measured (actual) biomass and accumulated N in 2015 and the respective values predicted by the NDVI, using the models developed in 2014, was determined.
The agreement between the actual and predicted values and adequacy of the models were evaluated using the following statistical performance indices: Coefficient of residual mass (CRM) – varies between −∞ and +∞, with an optimal value equal to zero. Values near zero indicate optimal adjustment,
while positive and negative values indicate
underestimation and overestimation of predicted values, respectively (BONFANTE et al., 2010); Coefficient of correlation (r) - varies between −1 and +1, with values close to zero indicating the absence of correlation (ADDISCOTT & WHITMORE, 1987); Willmott’s index of agreement (d) - indicates model
accuracy and degree of discrepancy between actual
and predicted values, with values between zero and +1, where d=+1 indicates perfect agreement, and d=0 indicates total disagreement (WILLMOTT et al., 2012); Coefficient “c” – indicates the model confidence and is expressed by c=d*r, varying between <0.40 (“low”) and >0.85 (“optimum”) (CAMARGO & SENTELHAS, 1997).
Grain yield was evaluated by harvesting 4.05m² in each plot, and weighing the grains, and was expressed at 130g kg−1 of moisture. Based on
the adjustment of grain yield response curves to N
topdressing doses for each N dose applied at plant
emergence, the dose of maximum technical efficiency (DMTE) of top dressed N, defined as the N dose resulting in maximum grain yield, was determined. For linear adjustment (y=a+bx), DMTE was considered the maximum N dose applied as topdressing (80kg
ha−1), while for the quadratic model (y=c+bx+ax2) the
DMTE was calculated by the ratio=−b/2a (TISDALE et al., 1993). Subsequently, DMTE was related to
the NDVI evaluated at the time of top dressed N application. Grain yield and DMTE were determined
only in 2014.
RESULTS AND DISCUSSION
Models for estimation of shoot biomass and amount
of accumulated nitrogen in shoots as a function of
NDVI value
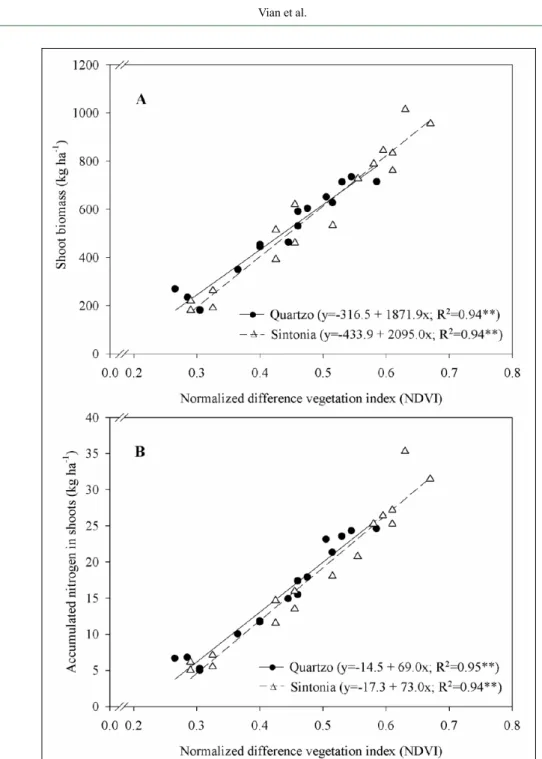
Application of N doses at plant
emergence was efficient in creating variability in biomass production (Figure 1A) and amount of accumulated N in shoots (Figure 1B) at the stage of six fully expanded leaves. For both cultivars, a high coefficient of determination (R2 = 0.94,
p<0.01) was observed between NDVI and shoot
biomass, and the increase in biomass production was reflected in linear increments in the NDVI value (Figure 1A). The increase in NDVI due to greater biomass accumulation was due to greater
N availability, resulting in increase in chlorophyll
content in the leaves. The greater the accumulation of photosynthetically active biomass, the higher the reflectance of near-infrared (NIR) radiation, and lower the reflectance of red radiation, resulting in an
increase in NDVI (SMITH et al., 2017). Therefore,
NDVI measured by a canopy sensor was exact to
differentiate different crop growing conditions at the stage of six expanded leaves provided by variation
in N availability at plant emergence. Values of the coefficient of determination between NDVI and wheat shoot biomass higher than 0.83 were reported by POVH et al. (2008). The cultivar Quartzo
exhibited lower NDVI values than the cultivar TBIO
Sintonia, considering the average of all treatments (NDVIQuartzo=0.42 and NDVISintonia=0.48, Figure 1A), because of its lower tillering capacity and
erect leaves. The cultivar TBIO Sintonia, conversely,
exhibits higher tillering capacity and more decumbent
leaves, resulting in greater soil coverage. This results in an increase in NDVI, especially in early growth
stages, when shoot biomass is small, and crop soil
coverage is still low. However, the differences in
morphological characteristics among cultivars were not sufficient to cause differences in the relationship between NDVI and shoot biomass at the growth stage of six fully expanded leaves (Figure 1A).
Additionally, a significant increase in NDVI was observed with increasing the amount of accumulated N in shoots, with high coefficients of determination (greater than R2=0.94, p<0.01)
that can be detected using remote sensors. Leaves with low N accumulation, and consequently lower chlorophyll content have higher reflectance in the visible region of the electromagnetic spectrum (400-700nm) and low reflectance in the near-infrared region (DIACONO et al., 2013; SINGH et al., 2017), causing a decrease in the Normalized difference vegetation index (NDVI). Increase in the amount of accumulated
N promotes an increase in chlorophyll content, and consequently higher absorption and lower reflectance of the red spectrum (SHANAHAN et al., 2008).
In order to determine whether a single model for the abovementioned relationships could be used for the cultivars Quartzo and TBIO Sintonia, the confidence interval (CI) was determined for the regressions shown in figure 1. The existence of overlap between the CIs
Figure 1 - Relationship between the Normalized difference vegetation index (NDVI) and the amounts of shoot biomass (A) and accumulated nitrogen in shoots (B) for two wheat
(data not shown) indicates that the behavior of the
cultivars was similar for the relationship between NDVI, shoot biomass, and amount of accumulated N in shoots, indicating that a single regression model could be used
for these relationships, considering the data of both
cultivars [Biomass (kg ha−1)=−376.3+1992.9*NDVI
(R2=0.94, p<0.01); and Accumulated N (kg ha−1)
=−15.6+70.5*NDVI (R2=0.94, p<0.01)].
These models were validated in 2015 using
the cultivars TBIO Sintonia, TBIO Sinuelo, and TBIO
Toruk. For this, the NDVI values measured in 2015 at
the stage of six fully expanded leaves were applied in
the abovementioned models, generating the values of predicted shoot biomass and accumulated N, which were compared with the observed (actual) values determined by plant sampling (Figures 2A and 2B).
Figure 2 - Relationship between actual (observed) and predicted shoot biomass (A) and actual (observed) and predicted accumulated N in shoots (B) for three wheat cultivars at
the stage of six fully expanded leaves. **Significant at p=0.01; CRM=coefficient
Both relationships were close to the 1:1 line, indicating the suitability of the proposed
models. For shoot biomass (Figure 2A) and amount of accumulated N (Figure 2B), the values of the coefficient of residual mass (CRM=−0.16 and −0.07, close to zero, indicating optimal adjustment), coefficient of correlation (r=0.79 and 0.86, regarded as “high”), Willmott’s index of agreement (d=0.82
and 0.92, close to 1, indicating close correspondence
between predicted and actual values), and coefficient “c” (c=0.66 and 0.79, regarded as “good” and “very good”, respectively) indicate the adequacy and accuracy of the proposed models for predicting the amounts of shoot biomass and accumulated N as a function of NDVI. In relation to shoot biomass, there was a slightly overestimation of the proposed model when applied to the cultivars used in 2015 (Figure 2A). This can be related to the fact that two different cultivars were used for model validation in 2015, namely TBIO Sinuelo and TBIO Toruk. These cultivars present more erect leaves than the
cultivars used in 2014. Despite these differences,
statistical performance indices were satisfactory and indicated good reliability of the model. Furthermore, considering the amount of N accumulated in shoots, the proposed model presented better performance, which is indicated by the statistical indices (Figure 2B). Considering the use of these models for variable rate N fertilization, the amount of accumulated N in shoots is the most interesting variable, since it indicates the actual amount of this nutrient that was
absorbed, which is, in turn, directly related to the true
N demand at the stage of six fully expanded leaves. Considering the model shown in figure 1B, it can be affirmed that this can be used with high confidence and accuracy for predicting accumulated N in shoots
for the set of cultivars used in the present study, even
though these have morphological differences that can slightly affect NDVI readings. GROHS et al. (2009)
concluded that the Greenseeker® sensor can be used
in different wheat and barley cultivars using the same relationship between NDVI and shoot biomass, even if they present different morphological characteristics, without affecting the topdressing N dose estimated by
NDVI readings.
Nitrogen topdressing dose of maximum technical
efficiency (DMTE) as a function of NDVI
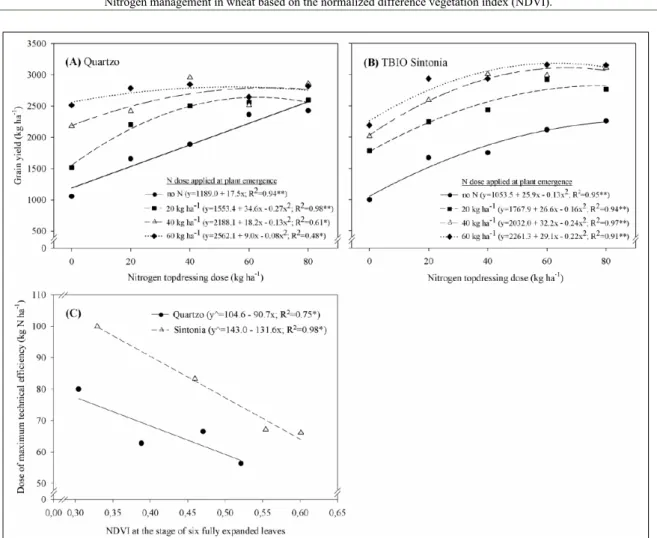
The grain yield of the cultivars Quartzo and TBIO Sintonia showed a quadratic response to
the increase in N topdressing doses when doses of 20,
40, or 60kg ha−1 of N fertilizer were applied at plant emergence (Figures 3A and 3B). When no N fertilizer
was applied at plant emergence, grain yield response
to topdressing N doses was linear for the cultivar
Quartzo (Figure 3A), and quadratic for the cultivar TBIO Sintonia (Figure 3B). For Quartzo and TBIO Sintonia, the adjusted models showed coefficients of determination greater than 0.48 and 0.91, respectively (Figures 3A and 3B).
Using the adjusted regressions, the N
topdressing doses of maximum technical efficiency
(DMTE) at the stage of six expanded leaves were
mathematically determined for each N dose applied at plant emergence, which were correlated with the NDVI value evaluated at the time of N topdressing application (Figure 3C). Lower NDVI values
corresponded to higher DMTE. Contrastingly,
the higher the NDVI at the time of N topdressing, indicating greater nitrogen accumulation in shoots, the smaller the response to the application of top dressed N and smaller the N dose to be applied.
At the end of tillering (around the growth stage of six fully expanded leaves) wheat plants
have absorbed approximately one third of the nitrogen used over the entire cycle (WIETHÖLTER, 2011). If a high amount of N is absorbed up to this
growth stage, plants will present low response to the
top dressed N application (LAMOTHE, 1994) and, in this case, the N dose should be reduced (SINGH et al., 2015). WELSH et al. (2003) concluded that the most effective strategies for variable rate N
application to barley and winter wheat were related to the application of higher N doses to areas with
low culm density and reduction of N fertilization dose to areas with high culm density. SINGH et al. (2015) showed that with the increase in Yara
N-sensor® values in wheat, as a consequence of
higher plant chlorophyll content and shoot biomass,
N topdressing doses should decrease. In corn, plants
with lower shoot biomass and N uptake at the stage
of eight fully expanded leaves were associated with a higher probability of response to nitrogen input
and, in consequence, with an increase in nitrogen
rate in relation to the reference N rate for this stage
(BRAGAGNOLO et al., 2016). Conversely, the response to N topdressing is less likely to occur when
plants are well supplied with nitrogen, justifying the
2018). Furthermore, these approaches may not be
applicable to all crops. In fact, for sugarcane an
algorithm to guide higher N rates to the areas with higher yield potential, estimated by canopy sensor readings, was proposed by AMARAL et al. (2015).
Thus, it is fundamental to evaluate the variability in shoot biomass and amount of accumulated N to optimize top dressed variable rate
N application at doses consistent with the actual
requirement of crops in different areas in the field. However, the relationships shown in figure 3C were specific to each cultivar; although, they showed the same tendency concerning the relationship between NDVI and N dose of maximum technical efficiency (DMTE). In this case, the models presented in figure
3C could be used for a group of wheat cultivars with
N response characteristics similar to those of the cultivars tested in this study, aiming the adjustment
of N topdressing doses using the NDVI value.
CONCLUSION
NDVI has a significant association with shoot biomass and the amount of accumulated nitrogen
in shoots at the growth stage of six fully expanded
leaves, which enables the estimation of these variables by NDVI using the proposed models for the wheat
cultivars used in the present study. The N topdressing
dose of maximum technical efficiency is negatively correlated to the NDVI value evaluated at the time of fertilizer application. This information can be used for variable rate N topdressing fertilization, allowing the adjustment of N dose in different areas in the field.
ACKNOWLEDGEMENTS
The authors are grateful to the Conselho Nacional
de Desenvolvimento Científico e Tecnológico (CNPq), for the doctoral scholarships of the first and fourth authors.
Figure 3 - Grain yield response to nitrogen topdressing doses for the cultivars Quartzo (A) and TBIO Sintonia (B) and relationship between N dose of maximum technical efficiency (DMTE) and Normalized difference vegetation index (NDVI) at the
CONFLICTS OF INTEREST
The authors declare no conflict of interest. The
founding sponsors had no role in the design of the study; in the collection, analyses, or interpretation of data; in the writing of the
manuscript, and in the decision to publish the results.
REFERENCES
ADDISCOTT, T. M.; WHITMORE, A. P. Computer simulation of changes in soil mineral nitrogen and crop nitrogen during autumn,
winter and spring. Journal of Agricultural Science, v.109, n.1,
p.141-157, 1987. Available from: <http://www.scielo.br/scielo. php?pid= S0006-87052000000200002&script=sci_arttext&tlng=in>. Accessed: Feb. 20, 2018. doi: 10. 1590/S0006-87052000000200002.
AMARAL, L. R. et al. Algorithm for variable-rate nitrogen
application in sugarcane based on active crop canopy sensor.
Agronomy Journal, v.107, n.4, p.1513-1523, 2015. Available
from: <http://dx.doi.org/10.2134/agronj14.0494>. Accessed: Feb.
05, 2018. doi: 10.2134/agronj14.0494.
BASSO, B. et al. A strategic and tactical management approach to select optimal N fertilizer rates for wheat in a spatially variable field. European Journal of Agronomy, v.35, p.215-222, 2011. Available
from: <https://doi.org/10.1016/j.eja.2011.06.004>. Accessed: Jul.
20, 2017. doi: 10.1016/j.eja.2011.06.004.
BONFANTE, A. et al. SWAP, CropSyst and MACRO comparison in two contrasting soils cropped with maize in Northern Italy. Agricultural Water Management, v.97, n.7, p. 1051–1062, 2010. Available from: <https://doi.org/10.1016/j.agwat.2010.02.010>. Accessed: Jun. 25, 2017. doi: 10.1590/S0006-8705200 0000200002.
BRAGAGNOLO, J. et al. Use efficiency of variable rate of
nitrogen prescribed by optical sensor in corn. Revista Ceres, v.63,
n.1, p.103-111, 2016. Available from: <http://www.scielo.br/pdf/ rceres/v63n1/2177-3491-rceres-63-01-00103.pdf>. Accessed: Feb.
10, 2018. doi: 10.1590/0034-737X201663010014.
BREDEMEIER, C. et al. Aplicação de nitrogênio em tempo real: modelos e aplicações. In: SANTI, A. L.; GIOTTO, E.; et al. Agricultura de Precisão no Rio Grande do Sul. Santa Maria:
CESPOL, 2016, p.138-158.
CAMARGO, A. P.; SENTELHAS, P. C. Performance evaluation of different potential evapotranspiration estimating methods in the state
of São Paulo, Brazil. Revista Brasileira de Agrometeorologia, v.5,
n.1, p. 89-97, 1997. Available from: <http://www.leb.esalq.usp.br/ agmfacil/artigos/artigos_sentelhas_1997/1997_RBAgro_5(1)_89-97_ ETPM%E9todosSP.pdf>. Accessed: Sept. 20, 2017.
CHAVARRIA, G. et al. Growth regulator in wheat plants: reflexes on
vegetative development, yield and grain quality. Revista Ceres, v.62,
n.6, p.583-588, 2015. Available from: <http://www.scielo.br/scielo. php?pid=S0034-737X2015000600583&script=sci_ abstract&tlng=pt>.
Accessed: Sept. 20, 2017. doi: 10.1590/004-737X201562060011.
COLAÇO, A. F.; BRAMLEY, R. G. V. Do crop sensors promote improved nitrogen management in grain crops? Field Crops Research, v.218, p.126– 140, 2018. Available from: <https://doi.org/10.1016/j.fcr.2018.01.007>. Accessed: Feb. 15, 2018. doi: 10.1016/j.fcr.2018.01.007.
DIACONO, M. et al. Precision nitrogen management of wheat. A
review. Agronomy for Sustainable Development, v.33, p.291-241,
2013. Available from: <https://link.springer.com/ article/10.1007/ s13593-012-0111-z>. Accessed: Feb. 17, 2018. doi: 10.1007/s13593-012-0111-z.
GOMES, F.P. Curso de estatística experimental. Piracicaba:
Livraria Nobel, 1990. 468p.
INMAN, D. et al. Nitrogen uptake across site specific management
zones in irrigated maize production systems. Agronomy Journal,
v.97, n.1, p.169-176, 2005. Available from: <https://dl.sciencesocieties.
org/publications/aj/abstracts/97/1/0169>. Accessed: Sept. 20, 2017. doi:10.2134/agronj2005.0169.
GROHS, D. S. et al. Model for yield potential estimation in wheat and
barley using the Greenseeker sensor. Engenharia Agrícola, v.29, n.1,
p.101-112, 2009. Available from: <http://dx.doi.org/69162009000100011>. Accessed: Feb. 25, 2018. doi:
10.1590/S0100-69162009000100011.
LAMOTHE, A.G. Manejo del nitrógeno para aumentar
productividad en trigo. Montevideo: INIA, 1994. 26p. (Série Técnica, 54).
MANTAI R. D. et al. The dynamics of relation oat panicle with
grain yield by nitrogen. American Journal of Plant Sciences, v.7,
n.1, p.17-27, 2016. Available from: <https://www.scirp.org/journal/ PaperInformation.aspx?PaperID=62618>. Accessed: Jan. 23, 2017.
doi: 10.4236/ajps.2016.71003.
POVH, F. P. et al. Behavior of NDVI obtained from an active optical
sensor in cereals. Pesquisa Agropecuária Brasileira, v.43, n.8,
p.1075-1083, 2008. Available from: <http:// www.scielo.br/pdf/
pab/v43n8/v43n8a18.pdf>. Accessed: Oct. 25, 2017. doi: 10.1590/ S0100-204X2008000800018.
RAUN, W. R. et al. Improving nitrogen use efficiency in cereal grain
production with optical sensing and variable rate application. Agronomy Journal, v.94, p.815820, 2002. Available from: <http://citeseerx.ist.psu. edu/viewdoc/download?doi=10.1.1.483.5917&rep=rep1&type=pdf>. Accessed: Jun. 20, 2017. doi: 10.2134/agronj2002.8150.
REUNIÃO DA COMISSÃO BRASILEIRA DE PESQUISA
DE TRIGO E TRITICALE. Informações técnicas para trigo e
triticale – Safra 2017. Brasília: Embrapa, 2017. 240p.
SHANAHAN, J. et al. Responsive in-season nitrogen management
for cereals. Computers and Electronics in Agriculture, v.61, p.51–
62, 2008. Available from: <https://www.sciencedirect.com/science/ article/pii/S0168169907001676>. Accessed: Feb. 20, 2018. doi: 10.1016/j.compag.2007.06.006.
SINGH, M. et al. Calibration and algorithm development for estimation of nitrogen in wheat crop using tractor mounted N-Sensor.
The Scientific World Journal, v.2015, p.1-12, 2015. Available from: <https://www.hindawi.com/journals/tswj/2015/163968/>. Accessed: Feb. 15, 2018. doi: 10.1155/2015/163968.
SINGH, S. K. et al. Assessment of growth, leaf N concentration and chlorophyll content of sweet sorghum using canopy reflectance. Field Crops Research, v.209, p.47–57, 2017. Available from: <https://doi. org/10.1016/j.fcr.2017.04.009>. Accessed: Jul. 23, 2017. doi: 10.1016/j.
fcr.2017.04.009.
SMITH, H. L. et al. Don’t ignore the green light: exploring diverse
roles in plant processes. Journal of Experimental Botany, v.68,
nih.gov/pubmed/28575474>. Accessed: Sept. 22, 2017. doi:
10.1093/jxb/ erx098.
TEDESCO, M. J. et al. Análise de solo, plantas e outros
materiais. Porto Alegre: Departamento de Solos da UFRGS, 1995.
176p. 2.ed.
TISDALE, S. L. et al. Soil fertility and fertilizers. New York:
Macmillan, 1993. 643p. 5.ed.
WELSH, J. P. et al. Developing strategies for spatially variable
nitrogen application in cereals, Part I: Winter barley. Biosystems
Engineering, v.84, n.4, p.481-494, 2003. Available from: <https://doi. org/10.1016/S1537-5110(03)00002-3>. Accessed: Jun. 20, 2017. doi:
10.1016/S1537-5110(03)00002-3.
TOEBE, M. et al. Estimate leaf area of Crambe abyssinica for leaf
discs and digital fotos. Ciência Rural, v.40, n.2, p.445-448, 2010.
Available from: <http://www.scielo.br/scielo.php?pid=S0103-84782010000200036&script=sci_abstract&tlng=pt>. Accessed:
Sept. 10, 2017. doi: 10.1590/S0103-84782010000200036.
WIETHÖLTER, S. Fertilidade do solo e a cultura do trigo no
Brasil. In: PIRES, J. L. F.; et al. Trigo no Brasil: bases para
produção competitiva e sustentável. Passo Fundo: Embrapa Trigo,
2011, p.135-184.