NHESSD
3, 6321–6349, 2015Approaches for delineating landslide
hazard areas using receiver operating
characteristic
P. T. Ghazvinei et al.
Title Page
Abstract Introduction
Conclusions References
Tables Figures
◭ ◮
◭ ◮
Back Close
Full Screen / Esc
Printer-friendly Version
Interactive Discussion
Discussion
P
a
per
|
Discussion
P
a
per
|
Discussion
P
a
per
|
Discussion
P
a
per
|
Nat. Hazards Earth Syst. Sci. Discuss., 3, 6321–6349, 2015 www.nat-hazards-earth-syst-sci-discuss.net/3/6321/2015/ doi:10.5194/nhessd-3-6321-2015
© Author(s) 2015. CC Attribution 3.0 License.
This discussion paper is/has been under review for the journal Natural Hazards and Earth System Sciences (NHESS). Please refer to the corresponding final paper in NHESS if available.
Approaches for delineating landslide
hazard areas using receiver operating
characteristic in an advanced calibrating
precision soil erosion model
P. T. Ghazvinei1,2, J. Zandi3, J. Ariffin4, R. B. Hashim1, S. Motamedi1, N. Aghamohammadi5, and D. A. Moghaddam6
1
Department of Civil Engineering, Faculty of Engineering, University of Malaya, 50603 Kuala Lumpur, Malaysia
2
Young Researchers and Elite Club, Parand Branch, Islamic Azad University, Parand, Iran
3
Department of Watershed Management, College of Natural Resources Sciences, Sari University, Mazandaran, Iran
4
Fluvial and River Engineering Dynamics Group, Institute of Infrastructure Engineering and Sustainability Management, Faculty of Civil Engineering, Universiti Teknologi MARA (UiTM), Shah Alam, Malaysia
5
Center for Occupational and Environmental Health, Department of Social and Preventive Medicine, University of Malaya, Kuala Lumpur, Malaysia
6
NHESSD
3, 6321–6349, 2015Approaches for delineating landslide
hazard areas using receiver operating
characteristic
P. T. Ghazvinei et al.
Title Page
Abstract Introduction
Conclusions References
Tables Figures
◭ ◮
◭ ◮
Back Close
Full Screen / Esc
Printer-friendly Version
Interactive Discussion
Discussion
P
a
per
|
Discussion
P
a
per
|
Discussion
P
a
per
|
Discussion
P
a
per
|
Received: 22 September 2015 – Accepted: 23 September 2015 – Published: 21 October 2015 Correspondence to: J. Ariffin ([email protected])
NHESSD
3, 6321–6349, 2015Approaches for delineating landslide
hazard areas using receiver operating
characteristic
P. T. Ghazvinei et al.
Title Page
Abstract Introduction
Conclusions References
Tables Figures
◭ ◮
◭ ◮
Back Close
Full Screen / Esc
Printer-friendly Version
Interactive Discussion
Discussion
P
a
per
|
Discussion
P
a
per
|
Discussion
P
a
per
|
Discussion
P
a
per
|
Abstract
Soil erosion is undesirable natural event that causes land degradation and desertifica-tion. Identify the erosion-prone areas is a major component of preventive measures. Recent landslide damages at different regions lead us to develop a model of the ero-sion susceptibility map using empirical method (RUSLE). A landslide-location map was
5
established by interpreting satellite image. Field observation data was used to validate the intensity of soil erosion. Further, a correlation analysis was conducted to investigate the “Receiver Operating Characteristic” and frequency ratio. Results showed a satis-factory correlation between the prepared RUSLE-based soil erosion map and actual landslide distribution. The proposed model can effectively predict the landslide events
10
in soil-erosion area. Such a reliable predictive model is an effective management facility for the regional landslide forecasting system.
1 Introduction
Pressure on ecosystem has increased due to residential and industrial development. Ecological imbalance leads to increase in the number of natural disasters (Taherei
15
Ghazvinei et al., 2015). Landslide is one such disaster, which occurs due to failure on slopes after heavy rainfall under the influence of liquefaction and gravity. Various envi-ronmental factors govern the slope failures (landslide) such as, soils, land use, slope, drainage, rainfall, intense storms, earthquakes, human activities, or a combination of these factors. Therefore, studies that tries to understand landslide need to consider the
20
factors, which trigger such disasters. Information on disaster risk, which is reliable, ac-cessible, timely and appropriately packaged, is a prerequisite to any disaster reduction effort.
Water erosion is regarded as a major issue as it affects socially and economically. It causes damage to structures, agriculture, and human lives. Water erosion over time
25
NHESSD
3, 6321–6349, 2015Approaches for delineating landslide
hazard areas using receiver operating
characteristic
P. T. Ghazvinei et al.
Title Page
Abstract Introduction
Conclusions References
Tables Figures
◭ ◮
◭ ◮
Back Close
Full Screen / Esc
Printer-friendly Version
Interactive Discussion
Discussion
P
a
per
|
Discussion
P
a
per
|
Discussion
P
a
per
|
Discussion
P
a
per
|
Taherei Ghazvinei et al., 2014; Reis et al., 2009; Conoscenti et al., 2008; Morgan, 2005).
The flooding on 20 July 2015 triggered by torrential rains, affected several counties provinces including Mazandaran in Iran. The flood has caused widespread damage and destroyed infrastructure in at least 37 villages. About 73 houses in Mazandaran
5
province have been reported as damaged due to after heavy rainfall as shown in Fig. 1a (“Flood damage”, 2015). Furthermore, several vehicles were damaged in the landslide induced by flood on the Chalus Road at the Alborz province in the neighbouring of the Mazandaran province as shown in Fig. 1b (“Landslides on Chalus roads”, 2015). Some criticized the Meteorological Agency said the agency has not properly informed
10
the public of the possible situation. Meteorological Organization of Iran has been a lot of criticism because it did not properly inform the public of the possible status. USGS survey recorded nine most disastrous landslides from the year 2005 to 2012 in which more than 3000 people lost their lives and faced enormous financial losses. Further-more, a geological survey showed that in the last four years, more than 10 landslides
15
have occurred with great loss of life and properties (USGS, 2014).
Mountainous region receives the most devastative kind of water erosion, where loose and unstable material results in mass movement of soil and rocks (e.g. Lee, 2004; Selby, 1982; Mukhlisin et al., 2014; Taherei Ghazvinei et al., 2012). Thus, investiga-tors need to make accurate maps showing the areas of water erosion and sediment
20
sources. It is particularly helpful to generate the maps in basin scale, which helps in the managing and preventing erosion (Begueria, 2006). Erosion susceptibility maps classify the land with similar erosion characteristics. Therefore, such maps are use-ful as they help in identifying the location with high-risk landslide occurrence. Many landslides occur in areas affected by soil erosion, although, previous research work
25
NHESSD
3, 6321–6349, 2015Approaches for delineating landslide
hazard areas using receiver operating
characteristic
P. T. Ghazvinei et al.
Title Page
Abstract Introduction
Conclusions References
Tables Figures
◭ ◮
◭ ◮
Back Close
Full Screen / Esc
Printer-friendly Version
Interactive Discussion
Discussion
P
a
per
|
Discussion
P
a
per
|
Discussion
P
a
per
|
Discussion
P
a
per
|
least a decade of the recorded data should be available for the soil erosion. Then, we randomly selected 2/3 of data for developing the primary predictive model for landslide. Model validation used the remaining data set.
Researchers use physical and empirical methods for preparing the soil erosion susceptibility map (e.g. Mueller et al., 2005; Begueria, 2006; Lesschen et al., 2008;
5
Conoscenti et al., 2008; Evrard et al., 2007; Zandi, 2012). The empirical method es-timates the soil erosion by relating known physical parameters such as the Universal Soil Loss Equation (USLE) (Wischmeier and Smith, 1965). Physical methods mathe-matically represent the soil erosion process such as the WEPP model (Nearing et al., 1989). Researchers apply the empirical methods for basin scale studies, while the
10
physical-based techniques are considered unsuitable as it requires detailed datasets. Recent research works have used complex empirical methods alongside Geograph-ical Information Systems (GIS) for preparing the erosion susceptibility map through (e.g. Qing et al., 2008; Park et al., 2011; Oliveira et al., 2011; Fernandez and Margarita, 2011; Singh et al., 2014). For example, a research work implemented the Revised
Uni-15
versal Soil Loss Equation (RUSLE) model in the humid and semi-humid regions of Iran, where landslides occur due to soil erosion (Asadi et al., 2011; Renard et al., 1997). Therefore, it is essential to control the erosion in order to prevent landslides (Zandi, 2012; Abraham and Shaji, 2013). Investigators and decision makers can reduce soil erosion by controlling the soil erosion factors such as, the land cover and usage. Thus,
20
present study needed to conduct a soil erosion spatial assessment. Investigators con-sider GIS as a useful tool for integrating various datasets and assessing soil erosion (Pradhan et al., 2012; Zandi, 2012).
This study proposes to assess the landslide by correlating it with other environmental threats such as soil erosion. A model is proposed and validated for predicting landslides
25
NHESSD
3, 6321–6349, 2015Approaches for delineating landslide
hazard areas using receiver operating
characteristic
P. T. Ghazvinei et al.
Title Page
Abstract Introduction
Conclusions References
Tables Figures
◭ ◮
◭ ◮
Back Close
Full Screen / Esc
Printer-friendly Version
Interactive Discussion
Discussion
P
a
per
|
Discussion
P
a
per
|
Discussion
P
a
per
|
Discussion
P
a
per
|
2 Materials and methods
This work’s main objective was to model soil erosion in correlation with landslide events locations. Large number of data was required to propose a model with a satisfactory ability to simulate the erosion consistent with natural conditions. Therefore, this work conducted the field surveys for collecting data from an area having direct or indirect
5
effect on the soil erosion such as, adaptation of forests for habitat and incorrect adap-tation of agricultural lands to housing, infrastructure, roads, and mining. These areas are usually at risk of landslide and soil erosion without any triggering alarm.
2.1 Data collection
This study required to collect and analyse the suitable data for reaching the
objec-10
tives. Field survey results showed that the Vazroud watershed suited for collecting the required data. This area was selected because frequent landslide and soil erosion problems occur in the upstream of watershed.
The Vazroud watershed is located in the central part of Mazandaran, Iran. It has an area of 14 123 ha, as shown in Fig. 2a. Erosion status study in Vazroud is inevitable
15
owing to provide information on urban water and promenade trait. In addition, this in-formation was helpful for identifying changes in land usage from forest to habitat, and on inappropriate adaptation of agricultural lands.
Altitudes of the area range from 270 to 3580 m (m.a.s.l.), slope gradients ranges from 0 to 66◦with an average of 26.74◦. Dense vegetation covers the lower altitude and low
20
gradient slopes, whereas the high altitude and steeper slopes have sparse vegetation. The mean annual precipitation and temperature are 600 mm and 10.6◦C, respectively. This study used the base statistical common data from the six meteorological stations located within and around the study area (Joorband, Vaz, Chamestan, Lavij, Takker and Razan) for the period 1987–2007. Figure 2b shows the location of these stations.
NHESSD
3, 6321–6349, 2015Approaches for delineating landslide
hazard areas using receiver operating
characteristic
P. T. Ghazvinei et al.
Title Page
Abstract Introduction
Conclusions References
Tables Figures
◭ ◮
◭ ◮
Back Close
Full Screen / Esc
Printer-friendly Version
Interactive Discussion
Discussion
P
a
per
|
Discussion
P
a
per
|
Discussion
P
a
per
|
Discussion
P
a
per
|
2.2 Procedures of methods
The first phase of this study mapped the soil erosion at the catchment using RUSLE model. Further, this study correlated landslide occurrences with the developed soil erosion map The RUSLE estimates the average annual soil loss. RUSLE govern-ing equation uses six independent input parameters. These factors are the
conser-5
vation practices (P), soil erodibility (K, t ha h MJ−1ha−1mm−1), rainfall erosivity (R, MJ mm ha−1h−1yr−1), cover and management practice (C) and the slope length (L) and slope steepness (S). This study applied the RUSLE using a GIS to investigate value and distribution of the average annual soil loss.
A=R×K×L×S×C×P (1)
10
whereAis the average soil loss per unit area by erosion (t ha−1yr−1). TheP,C,S, and Lare dimensionless.
Erosivity factor was obtained by using the equation given by Zandi (2012). The fac-tor was derived from a spatial regression analysis obtaining from synoptic stations of Mazandaran, based on the available mean annual rainfall (p in mm). Given by a
re-15
gression equation as,
R=−8.12+0.562p. (2)
Present study collected the average of annual historic rainfall event (1987–2007) from six meteorological stations located within and near the study area to determine the value of theR. Using spatial analyst extension in ArcGIS (Ver. 10, ESRI), Spline
20
interpolation was done to generate an estimated surface from these scattered set of point data (Fig. 3).
This study designed the interested network including nested-systematic by analyzing the soil sample that were collected from 10 cm depth for different types of soil distribu-tion. The value of theK was computed using Eqs. (3) and (4) (Renard et al., 1997):
NHESSD
3, 6321–6349, 2015Approaches for delineating landslide
hazard areas using receiver operating
characteristic
P. T. Ghazvinei et al.
Title Page Abstract Introduction Conclusions References Tables Figures ◭ ◮ ◭ ◮ Back Close
Full Screen / Esc
Printer-friendly Version Interactive Discussion Discussion P a per | Discussion P a per | Discussion P a per | Discussion P a per |
K=7.594
0.0034+0.0405 exp
−1/2 logDg+1.659
0.7101
!2 (3)
Dg=exp
0.01Xfilnmi (4)
wherefi is the particle size fraction in percent of class I; mi is the arithmetic mean of the particle size limits of class I; and Dg is the geometric mean diameters of soil
particle. Figure 3b shows distribution of the soil erodibility (K).
5
An available program written in C++, was used to calculate the topographic factors L and S, which automatically processed the DEM input (Hickey, 2000; van Remor-tel et al., 2004). The command for calculating the L factor is based on (Eq. 5). The C++ executable computed the cumulative slope lengths and substitutes this value as λ(Fig. 3c).
10 L= λ 22.13 m (5) β= sinθ 0.0896
3×(sinθ)0.8+0.56
, where: m= β
(β+1) (6)
The exponent (m) of Eq. (5) depends onβ which is a ratio of rill and interrill erosion. Rill erosion is caused by overland flow; and interrill erosion is increase due to rainfall. Equation (6) shows their relation for calculating the exponentm(McColl, 1987).
15
To estimate the cover and management practices factorC, sample values were col-lected from various land cover at 20 locations (GPS registered of watershed area ran-domly). The higher values ofCfactor ranges from 0.35 (approximately). Higher values occurred on the bare land with little vegetation and high erosion, whereas the lower value where found in the dense forest or grain cover with low erosion.
20
NHESSD
3, 6321–6349, 2015Approaches for delineating landslide
hazard areas using receiver operating
characteristic
P. T. Ghazvinei et al.
Title Page
Abstract Introduction
Conclusions References
Tables Figures
◭ ◮
◭ ◮
Back Close
Full Screen / Esc
Printer-friendly Version
Interactive Discussion
Discussion
P
a
per
|
Discussion
P
a
per
|
Discussion
P
a
per
|
Discussion
P
a
per
|
from the near infrared band and red band of the TM Landsat on 4 June 2014.
NDVI=
b4−b3 b4+b3
(7)
The value of conservation practices factorP, was taken using analogy practices (Asadi et al., 2011; Pradhan et al., 2012).
The maps show the properties and locations of previous landslides. Topography, soil
5
erodibility, and climatic conditions resulted in slope failures; therefore, these parame-ters can predict landslides. Landslide inventory maps systematically maps the existing landslides regions using various techniques such as, interpretation of the satellite im-age, survey, or field air photo. It also involves reviewing the historical landslide records. A comprehensive field survey determined the spatial-distribution of the existing
land-10
slides. In the current study, landslide inventory map were obtained through a previous inventory map, field studies, and analyses of IRS P5 satellite image (Fig. 6).
3 Results and discussion
3.1 Mapping of soil erosion
This study developed a diagram having grid size of 30 m×30 m, using GIS layers of
15
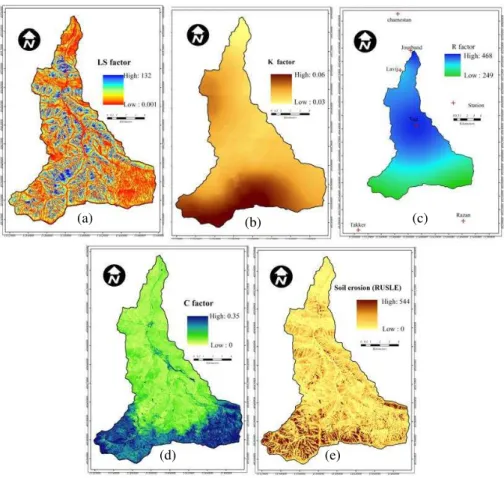
five parameters. Further, this work estimated the annual soil loss for each pixel by multiplying input layers according to the RUSLE. Figure 3e shows the different rates of soil-erosion in the catchment areaA(in t ha−1yr−1). Table 1 list values of the factor LS, C,R, andK.
Figure 3a show that the rainfall erosivity factor (R) ranges from 249 to
20
468 MJ mm ha−1h−1yr−1; with a mean value of 382 MJ mm ha−1h−1yr−1 and standard deviation of 58.73. According to the map, the watershed undergoes higher rainfall ero-sivity at middle and northern region than the southern part. The eroero-sivity factor is di-rectly proportional to decreasing rainfall. In the Vazroud watershed the R factor de-creases from the south to north.
NHESSD
3, 6321–6349, 2015Approaches for delineating landslide
hazard areas using receiver operating
characteristic
P. T. Ghazvinei et al.
Title Page
Abstract Introduction
Conclusions References
Tables Figures
◭ ◮
◭ ◮
Back Close
Full Screen / Esc
Printer-friendly Version
Interactive Discussion
Discussion
P
a
per
|
Discussion
P
a
per
|
Discussion
P
a
per
|
Discussion
P
a
per
|
The value forK ranges from 0.03 to 0.06 with a mean of 0.048 t ha h MJ−1ha−1mm−1 (Fig. 3) and standard deviation of 0.005. Based on the soil erodibility map. TheK value is higher in the southern and south-western parts, with a few exceptions (Fig. 3b).
The watershed of Vazroud is a mountainous catchment with high elevation variation. The elevation for this region increases from north to south, with a sudden maximum
5
drop of 3580 m. The southwest region has the greatest Land Side values (LS) due to presence of steepest slopes. Figure 3a shows that LS varies from 0.001 to 132 and has a mean of 15.03. Nevertheless, most of the part has LS less than 10. In some parts LS values are greater than 20, which indicates steep slopes (e.g. areas along the river in the middle of the watershed).The graphs of regression analysis andCfactor are given
10
in Fig. 4.R shows the correlation coefficient of regression analysis.
In Fig. 4 the distribution of the “cover and management practice” i.e. factorC was generated by using Eq. (8) and ArcGIS Special Analyst tool.
C=0.407−0.5953×NDVI (8)
NDVI map was derived from TM Landsat (Eq. 7). The value forCvaries from 0 to 0.35
15
with a mean value of 0.11. High values ofCfactor were found at the edge of valley, as larger area of bare land and rangeland are located in the hillside.
3.2 Annual soil loss
Analysis the data of the Sect. 3.1, revealed that the average annual soil loss of this region varies from 15 to 162 t ha−1yr−1with a mean of 26 t ha−1yr−1while, few specific
20
southwest parts have average annual soil loss more than 200 t ha−1yr−1. These parts are prone to erosion.
3.3 Assessment on soil erosion risk zone
This study used the standard deviation classifier after surveying the ground condition (Suzen and Doyuran, 2004; Ayalew et al., 2004). This study classified this region into
NHESSD
3, 6321–6349, 2015Approaches for delineating landslide
hazard areas using receiver operating
characteristic
P. T. Ghazvinei et al.
Title Page
Abstract Introduction
Conclusions References
Tables Figures
◭ ◮
◭ ◮
Back Close
Full Screen / Esc
Printer-friendly Version
Interactive Discussion
Discussion
P
a
per
|
Discussion
P
a
per
|
Discussion
P
a
per
|
Discussion
P
a
per
|
various groups based on selected scale. Most of the region fell in the minimum ero-sion group (27 %) i.e. the northern part and area near the outlet of watershed. High to extreme erosion risks areas were about 4 %, mostly in the western and south-ern region as shown in Fig. 5. Table 2 show that 70 % of the soil erosion occurs in parts which have high and extreme erosion conditions. Therefore, investigators and
5
management people should focus on the areas with high to extreme risk erosion.
3.4 Validation of the erosion susceptibility map
Soil erosion depends on regions topography, vegetation-cover, erodibility, rainfall, and land use (Beskow et al., 2009). Moreover, each type of erosion represents one phase of the other type of erosion. In another word, the occurrence of each type of erosion
10
facilitates the occurrence of other types (Refahi, 2008). This study utilised the previous inventory and extensive field survey, with landslides locations maps generated with P5 sensor of IRS satellite imagery 2.5 m spatial accuracy (Pradhan et al., 2011).
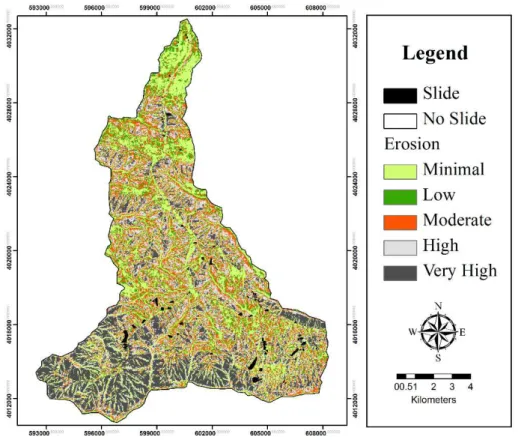
Landslide locations occurred during the past 20 years. 99 landslides polygons were digitized. The pixel size of the landslide inventory and all map parameters were 30 m.
15
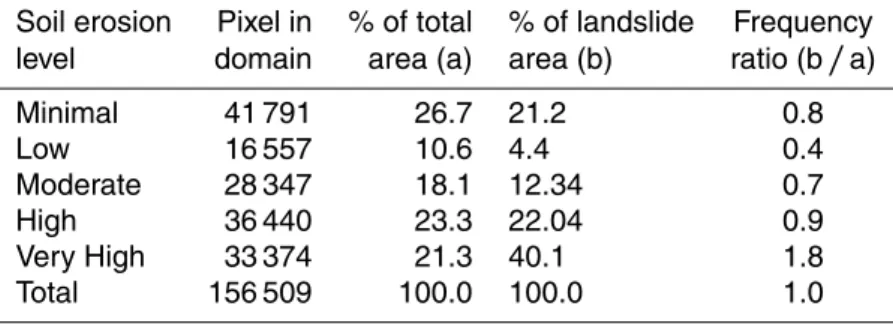
Landslides areas were overlapped with the soil erosion map of the year 2014, as shown in Fig. 6. Frequency ratio-based statistical analysis was used to correlate the soil ero-sion map. Frequency ratios show the relation between landslides and soil eroero-sion in-tensity.
Table 3 shows the frequency ratio for various range of soil erosion. Frequency ratio
20
less than 1 shows low association between soil erosion and landslide, while value greater than one shows high correlation between soil erosion and landslide (Pradhan et al., 2011).
Result for Vazroud watershed shows high probability of landslides in parts with “very high” soil erosion. Very high soil erosion zones have frequency ratio greater than 1.8.
25
NHESSD
3, 6321–6349, 2015Approaches for delineating landslide
hazard areas using receiver operating
characteristic
P. T. Ghazvinei et al.
Title Page
Abstract Introduction
Conclusions References
Tables Figures
◭ ◮
◭ ◮
Back Close
Full Screen / Esc
Printer-friendly Version
Interactive Discussion
Discussion
P
a
per
|
Discussion
P
a
per
|
Discussion
P
a
per
|
Discussion
P
a
per
|
3.5 Correlation of soil erosion map with landslides events
The final RUSLE map was verified by overlaying it with the landslide inventory map. This study considered the landslide predictions acceptable, only if some part of the predicted landslide fell within high probability zone. A cut off value of 0.5 was used for selecting the acceptable predictions (Dai and Lee, 2002), otherwise the predictions
5
were rejected. Table 4 shows 891 landslide pixels predicted by the model.
Result validation shows that the model correctly predicted 689 (77.33 %) landslides. Further, the model accuracy was evaluated by calculating the Relative Operating Char-acteristics (ROC). This study prepared a dataset consisting of equal number of (891) pixels from landslides and non-landslide areas. Area under the curve in Fig. 8 shows
10
the prediction capability of the model. The result was in line with prediction of Pradhan et al. (2012). The value for the area under the ROC curve varies from 0.5 to 1. Present model showed value of 0.76 for area under the curve. This shows the results have relatively fair agreement between the soil erosion intensity map and landslide events data.
15
4 Conclusions
Results showed that erosion occurs in several forms which the most visible form was landslide erosion. This study used RUSLE and GIS, to develop and apply a simple methodology for predicting landslides and determining distribution of the soil erosion in a large watershed. Results show that the average annual soil loss is between 15 and
20
162 t ha−1yr−1 with a mean value of 26 t ha−1yr−1. According to the gross amount of soil loss, about 6 % of the total soil loss occurs in the area with minimal to low erosion and nearly 70 % occurs in the area of high to extreme erosion. Study shows that 70 % of the soil erosion occur in area with extreme erosion, while 6 % occur in area with low erosion. Therefore, management needs to take preventive measures in high risk area
25
NHESSD
3, 6321–6349, 2015Approaches for delineating landslide
hazard areas using receiver operating
characteristic
P. T. Ghazvinei et al.
Title Page
Abstract Introduction
Conclusions References
Tables Figures
◭ ◮
◭ ◮
Back Close
Full Screen / Esc
Printer-friendly Version
Interactive Discussion
Discussion
P
a
per
|
Discussion
P
a
per
|
Discussion
P
a
per
|
Discussion
P
a
per
|
Furthermore, this study checked the accuracy of erosion susceptibility map by using the landslide locations areas mapped for the purpose of validation. Results show direct correlation between the soil erosion and landslide. The area with high erosion have higher risk of landslide occurrence. Further ROC analysis shows that the developed model gives acceptable prediction for a medium-scale erosion and landslide
suscep-5
tibility map. The developed method can be used for regional planning. The integrated approach presented is relatively easy, fast, and straightforward, showing good poten-tial for successful wider application. The proposed model can be used for the regional landslide forecasting system of the natural disaster reduction system in the Crisis man-agement organization.
10
Acknowledgements. The authors are thankful of supporting received from University of Malaya under grants no. UM.C/HIR/MOHE/ENG/47, UM.C/HIR/MOHE/ENG/34, and UMRG/RG190-12SUS.
References
Abraham, P. B. and Shaji, E.: Landslide hazard zonation in and around Thodupuzha-Idukki-15
Munnar road, Idukki district, Kerala: a geospatial approach, J. Geol. Soc. India, 82, 649–656, 2013.
Amini, A., Taherei Ghazvinei, P., Javan, M., and Saghafian, B.: Evaluating the impacts of wa-tershed management on runoffstorage and peak flow in Gav-Darreh watershed, Kurdistan, Iran, Arab. J. Geosci., 1866–7511, 2014.
20
Asadi, H., Vazifehdoost, M., Moussavi, A., and Honarmand, M.: Assessment and mapping of soil erosion hazard in Navrood watershed using revised universal soil loss equation (RUSLE), geographic information system (GIS) and remote sensing (RS), Report of Researches Guilan Regional Water Company, Guilan, Iran, 13 pp. 2011.
Ayalew, L., Yamagishi, H., and Ugawa, N.: Landslide susceptibility mapping using GIS-based 25
NHESSD
3, 6321–6349, 2015Approaches for delineating landslide
hazard areas using receiver operating
characteristic
P. T. Ghazvinei et al.
Title Page
Abstract Introduction
Conclusions References
Tables Figures
◭ ◮
◭ ◮
Back Close
Full Screen / Esc
Printer-friendly Version
Interactive Discussion
Discussion
P
a
per
|
Discussion
P
a
per
|
Discussion
P
a
per
|
Discussion
P
a
per
|
Begueria, S.: Identifying erosion areas at basin scale using remote sensing data and GIS: a case study in a geologically complex mountain basin in the Spanish Pyrenees, Int. J. Remote Sens., 27, 4585–4598, 2006.
Beskow, S., Mello, C. R., Norton, L. D., Curi, N., Viola, M. R., and Avanzi, J. C.: Soil erosion prediction in the Grande River Basin, Brazil using distributed modeling, Catena, 79, 49–59, 5
2009.
Conoscenti, C., Di Maggio, C., and Rotigliano, E.: Soil erosion susceptibility assessment and validation using a geostatistical multivariate approach: a test in Southern Sicily, Nat. Hazards, 46, 287–305, 2008.
De Jong, S. M.: Application of Reflective Remote Sensing for Land Degradation Studies in 10
a Mediterranean Environment, Netherlands Geographical Studies, University of Utrecht, Utrecht, 1994.
De Jong, S. M., Paracchini, M. L., Bertolo, F., Folving, S., Megier, J., and De Roo, A. P. J.: Regional assessment of soil erosion using the distributed model SEMMED and remotely sensed data, Catena, 37, 291–308, 1999.
15
Evrard, O., Bielders, C. L., Vandaele, K., and Van Wesemael, B.: Spatial and temporal variation of muddy floods in central Belgium, off-site impacts and potential control measures, Catena, 70, 443–454, 2007.
Fernandez, L. M. and Margarita, M.: An empirical approach to estimate soil erosion risk in Spain, Sci. Total Environ., 409, 3114–3123, doi:10.1016/j.scitotenv.2011.05.010, 2011. 20
Flood damage: http://khabaronline.ir/(X(1)S(1254ununf3vsi2vjlsrkviqc))/detail/437992/society/ event, last access: October 2015.
Hickey, R.: Slope angle and slope length solutions for GIS, Cartography, 29, 582–591, 2000. Landslides on Chalus roads: http://www.mashreghnews.ir/fa/news/443012, last access:
20 July 2015. 25
Lee, S.: Soil erosion assessment and its verification using the universal soil loss equation and geographic information system: a case study at Boun, Korea, Environ. Geol., 45, 457–465, 2004.
Lesschen, J. P., Cammeraat, L. H., and Nieman, T.: Erosion and terrace failure due to agricul-tural land abondonment in a semi-arid environment, Earth Surf. Proc. Land., 33, 1574–1584, 30
2008.
NHESSD
3, 6321–6349, 2015Approaches for delineating landslide
hazard areas using receiver operating
characteristic
P. T. Ghazvinei et al.
Title Page
Abstract Introduction
Conclusions References
Tables Figures
◭ ◮
◭ ◮
Back Close
Full Screen / Esc
Printer-friendly Version
Interactive Discussion
Discussion
P
a
per
|
Discussion
P
a
per
|
Discussion
P
a
per
|
Discussion
P
a
per
|
Meyer, A. and Martinez-Casasnovas, J. A.: Prediction of existing gully erosion in vineyard parcels of the NE Spain: a logistic regression modeling approach, Soil Till. Res., 50, 319– 331, 1999.
Minasny, B. and Hartemink, A. E.: Predicting soil properties in the tropics, Earth-Sci. Rev., 106, 52–62, doi:10.1016/j.earscirev.2011.01.005, 2011.
5
Morgan, R. P.C: Soil erosion & Conservation, 3rd Edn., Blackwell Publishing, LTD, USA, 2005. Mueller, T. G., Cetin, H., Fleming, R. A., Dillon, C. R., Karathanasis, A. D., and Shearer, S. A.:
Erosion probability maps: calibrating precision agriculture data with soil surveys using logistic regression, J. Soil Water Conserv., 60, 462–468, 2005.
Mukhlisin, M., Baidillah, M. R., Ibrahim, A., and Taha, M. R.: Effect of soil hydraulic properties 10
model on slope stability analysis based on strength reduction method, J. Geol. Soc. India, 83, 586–594, 2014.
Nearing, M. A., Foster, G. R., Lane, L. J., and Finkner, S. C.: A process-based soil erosion model for USDA-water erosion prediction project technology, T. Am. Soc. Agr. Biol. Eng., 32, 1587–1593, 1989.
15
Oliveira, P., Alves, T., Rodrigues, D. B., and Panachuki, E.: Erosion risk mapping applied to environmental zoning, Water Resour. Manage., 25, 1021–1036, doi:10.1007/s11269-010-9739-0, 2011.
Park, S., Oh, C., Jeon, S., Jung, H., and Choi, C.: Soil erosion risk in korean water-sheds, assessed using the revised universal soil loss equation, J. Hydrol., 399, 263–273, 20
doi:10.1016/j.jhydrol.2011.01.004, 2011.
Pradhan, B., Chaudhari, A., Adinarayana, J., Manfred, F., and Buchroithner, M. F.: Soil erosion assessment and its correlation with landslide events using remote sensing data and GIS, Environ. Monit. Assess., 184, 715–727, doi:10.1007/s10661-011-1996-8, 2012.
Qing, X. Y., Mei, S. X., Bin, K. X., Jian, P., and Yun-Long, C.: Adapting the RUSLE and GIS to 25
model soil erosion risk in a mountains karst watershed, Guizhou Province, China, Environ. Monit. Assess., 141, 275–286, doi:10.1007/s10661-007-9894-9, 2008.
Refahi, H. G.: Water Soil Erosion and Conservation, Tehran university Publishing, Tehran, 671 pp., 2008.
Renard, K. G., Foster, G. R., Weesies, G. A., McCool, D. K., and Yoder, D. C.: Predicting 30
NHESSD
3, 6321–6349, 2015Approaches for delineating landslide
hazard areas using receiver operating
characteristic
P. T. Ghazvinei et al.
Title Page
Abstract Introduction
Conclusions References
Tables Figures
◭ ◮
◭ ◮
Back Close
Full Screen / Esc
Printer-friendly Version
Interactive Discussion
Discussion
P
a
per
|
Discussion
P
a
per
|
Discussion
P
a
per
|
Discussion
P
a
per
|
Reis, S., Nisanci, R., and Yomralioglu, T.: Designing and developing a province-based spatial database for the analysis of potential environmental issues in Trabzon, Turkey, Environ. Eng. Sci., 26, 123–130, 2009.
Selby, M. J.: Rock mass strength and the form inselberg in the Central Namib Desert, Earth Surf. Proc. Land., 7, 489–497, 1982.
5
Singh, C., Kohli, A., and Kumar, P.: Comparison of results of BIS and GSI guidelines on macrolevel landslide hazard zonation – A case study along highway from Bhalukpong to Bomdila, West Kameng district, Arunachal Pradesh, J. Geol. Soc. India, 83, 688–696, 2014. Suzen, M. L. and Doyuran, V.: Data driven bivariate landslide susceptibility assessment using
geographical information systems: amethod and application to Asarsuyu catchment, Turkey, 10
Eng. Geol, 71, 303–321, 2004.
Taherei Ghazvinei, P., Mohamed, T. A., Ghazali, A. H., and Huat, B. K.: Scour Hazard Assess-ment and Bridge AbutAssess-ment Instability Analysis, Electro. J. Geotech. Eng., 17, 1089–3032, 2012.
Taherei Ghazvinei, P., Ariffin, J., Abdullah, J., and Mohamed, T. A.: Comparative analysis be-15
tween observed and predicted contraction scour at bridges abutments, Res. J. Appl. Sci. Eng. Technol., 8, 452–459, 2014.
Taherei Ghazvinei, P., Ariffin, J., Mohammad, T. A., Amini, S. A., Mir, M. A., Saheri, S., and Ansarimoghaddam, S.: Contraction scour analysis at protruding bridge abutments, Proceed-ings of the ICE – Bridge Engineering, 168, doi:10.1680/bren.14.00011, 2015.
20
Terranova, O., Antronico, R., Coscarelli, R., and Iaquinta, P.: Soil erosion risk scenarios in the Mediterranean environment using RUSLE and GIS: an application model for Calabria (southern Italy), Geomorphology, 112, 228–245, 2009.
USGS: Landslide Events, available at: http://landslides.usgs.gov/recent/ (last access: Octo-ber 2015), 2014.
25
Van Remortel, R., Maichle, R., and Hickey, R.: Computing the RUSLE LS factor based on array-based slope length processing of digital elevation data using a C++ executable, Comput. Geosci., 30, 1043–1053, doi:10.1016/j.cageo.2004.08.001, 2004.
Wang, G., Wente, S., Gertner, G. Z., and Anderson, A.: Improvement in mapping vegetation cover factor for the universal soil loss equation by geostatistical methods with Landsat The-30
matic Mapper images, Int. J. Remote Sens., 23, 3649–3667, 2002.
NHESSD
3, 6321–6349, 2015Approaches for delineating landslide
hazard areas using receiver operating
characteristic
P. T. Ghazvinei et al.
Title Page
Abstract Introduction
Conclusions References
Tables Figures
◭ ◮
◭ ◮
Back Close
Full Screen / Esc
Printer-friendly Version
Interactive Discussion
Discussion
P
a
per
|
Discussion
P
a
per
|
Discussion
P
a
per
|
Discussion
P
a
per
|
Table 1.Value ofR,K, LS,CandP.
Rfactor K factor LS factor Cfactor P factor
Maximum 468 0.06 132 0.35 1
Minimum 249 0.03 0.001 0 1
Mean 382 0.048 15.03 0.11 1
NHESSD
3, 6321–6349, 2015Approaches for delineating landslide
hazard areas using receiver operating
characteristic
P. T. Ghazvinei et al.
Title Page
Abstract Introduction
Conclusions References
Tables Figures
◭ ◮
◭ ◮
Back Close
Full Screen / Esc
Printer-friendly Version
Interactive Discussion
Discussion
P
a
per
|
Discussion
P
a
per
|
Discussion
P
a
per
|
Discussion
P
a
per
|
Table 2.Area and amount of soil loss of each soil erosion risk category.
Erosion Numeric range Area Area Soil loss Soil loss categories (t ha−1yr−1) (ha) percentage (%) (
×100 t yr−1) Percentage (%)
Minimal <5 3792 26.9 0.8 0.6
Low 5–10 1436 10.2 7.5 5.9
Moderate 10–20 2527 17.9 14.8 11.6
High 20–40 3275 23.2 28.1 22.1
NHESSD
3, 6321–6349, 2015Approaches for delineating landslide
hazard areas using receiver operating
characteristic
P. T. Ghazvinei et al.
Title Page
Abstract Introduction
Conclusions References
Tables Figures
◭ ◮
◭ ◮
Back Close
Full Screen / Esc
Printer-friendly Version
Interactive Discussion
Discussion
P
a
per
|
Discussion
P
a
per
|
Discussion
P
a
per
|
Discussion
P
a
per
|
Table 3.Frequency ratio values of landslide occurrences vs. soil erosion intensity map of 2010.
Soil erosion Pixel in % of total % of landslide Frequency level domain area (a) area (b) ratio (b/a)
Minimal 41 791 26.7 21.2 0.8
Low 16 557 10.6 4.4 0.4
Moderate 28 347 18.1 12.34 0.7
High 36 440 23.3 22.04 0.9
Very High 33 374 21.3 40.1 1.8
NHESSD
3, 6321–6349, 2015Approaches for delineating landslide
hazard areas using receiver operating
characteristic
P. T. Ghazvinei et al.
Title Page
Abstract Introduction
Conclusions References
Tables Figures
◭ ◮
◭ ◮
Back Close
Full Screen / Esc
Printer-friendly Version
Interactive Discussion
Discussion
P
a
per
|
Discussion
P
a
per
|
Discussion
P
a
per
|
Discussion
P
a
per
|
Table 4.Area under Curve Test Result Variable(s): Landslides and Erosion (RUSLE).
Area Std. Error Asymptotic Sig. Asymptotic 95 % Confidence Interval Lower Bound Upper Bound
NHESSD
3, 6321–6349, 2015Approaches for delineating landslide
hazard areas using receiver operating
characteristic
P. T. Ghazvinei et al.
Title Page
Abstract Introduction
Conclusions References
Tables Figures
◭ ◮
◭ ◮
Back Close
Full Screen / Esc
Printer-friendly Version
Interactive Discussion
Discussion
P
a
per
|
Discussion
P
a
per
|
Discussion
P
a
per
|
Discussion
P
a
per
|
(a) (b)
NHESSD
3, 6321–6349, 2015Approaches for delineating landslide
hazard areas using receiver operating
characteristic
P. T. Ghazvinei et al.
Title Page
Abstract Introduction
Conclusions References
Tables Figures
◭ ◮
◭ ◮
Back Close
Full Screen / Esc
Printer-friendly Version
Interactive Discussion
Discussion
P
a
per
|
Discussion
P
a
per
|
Discussion
P
a
per
|
Discussion
P
a
per
|
(a)
(b)
Figure 2. (a)Location of study area at the Mazandaran province in the north of the Iran and
NHESSD
3, 6321–6349, 2015Approaches for delineating landslide
hazard areas using receiver operating
characteristic
P. T. Ghazvinei et al.
Title Page
Abstract Introduction
Conclusions References
Tables Figures
◭ ◮
◭ ◮
Back Close
Full Screen / Esc
Printer-friendly Version
Interactive Discussion
Discussion
P
a
per
|
Discussion
P
a
per
|
Discussion
P
a
per
|
Discussion
P
a
per
|
(a) (b) (c)
(d) (e)
NHESSD
3, 6321–6349, 2015Approaches for delineating landslide
hazard areas using receiver operating
characteristic
P. T. Ghazvinei et al.
Title Page
Abstract Introduction
Conclusions References
Tables Figures
◭ ◮
◭ ◮
Back Close
Full Screen / Esc
Printer-friendly Version
Interactive Discussion
Discussion
P
a
per
|
Discussion
P
a
per
|
Discussion
P
a
per
|
Discussion
P
a
per
|