in Response to Salt Stress
Xiuping Fu1,2., Duochun Wang1,2., Xiling Yin3, Pengcheng Du1,2, Biao Kan1,2*
1State Key Laboratory for Infectious Disease Prevention and Control, National Institute for Communicable Disease Control and Prevention, Chinese Center for Disease Control and Prevention, Beijing, China,2Collaborative Innovation Center for Diagnosis and Treatment of Infectious Diseases, The University of Tokyo, Bunkyo-ku, Tokyo, Japan,3Department of Cell Biology and Anatomy, Graduate School of Medicine, The University of Tokyo, Bunkyo-ku, Tokyo, Japan
Abstract
Shewanella algae, which produces tetrodotoxin and exists in various seafoods, can cause human diseases, such as spondylodiscitis and bloody diarrhea. In the present study, we focused on the temporal, dynamic process in salt-stressedS. algaeby monitoring the gene transcript levels at different time points after high salt exposure. Transcript changes in amino acid metabolism, carbohydrate metabolism, energy metabolism, membrane transport, regulatory functions, and cellular signaling were found to be important for the high salt response inS. algae. The most common strategies used by bacteria to survive and grow in high salt environments, such as Na+efflux, K+uptake, glutamate transport and biosynthesis, and the
accumulation of compatible solutes, were also observed in S. algae. In particular, genes involved in peptidoglycan biosynthesis and DNA repair were highly and steadily up-regulated, accompanied by rapid and instantaneous enhancement of the transcription of large- and small-ribosome subunits, which suggested that the structural changes in the cell wall and some stressful responses occurred inS. algae. Furthermore, the transcription of genes involved in the tricarboxylic acid (TCA) cycle and the glycolytic pathway was decreased, whereas the transcription of genes involved in anaerobic respiration was increased. These results, demonstrating the multi-pathway reactions ofS. algaein response to salt stress, increase our understanding of the microbial stress response mechanisms.
Citation:Fu X, Wang D, Yin X, Du P, Kan B (2014) Time Course Transcriptome Changes inShewanella algaein Response to Salt Stress. PLoS ONE 9(5): e96001. doi:10.1371/journal.pone.0096001
Editor:Marie-Joelle Virolle, University Paris South, France
ReceivedJanuary 8, 2014;AcceptedApril 1, 2014;PublishedMay 1, 2014
Copyright:ß2014 Fu et al. This is an open-access article distributed under the terms of the Creative Commons Attribution License, which permits unrestricted use, distribution, and reproduction in any medium, provided the original author and source are credited.
Funding:This study was supported by the Priority Project on Infectious Disease Control and Prevention (2012ZX10004215). The funders had no role in study design, data collection and analysis, decision to publish, or preparation of the manuscript.
Competing Interests:The authors have declared that no competing interests exist. * E-mail: [email protected]
.These authors contributed equally to this work.
Introduction
Shewanellabelongs to the order Alteromonadales and the family Alteromonadceae, the latter of which is a member of the gamma subdivision of Proteobacteria [1]. It is a Gram-negative bacterium that is capable of both aerobic and anaerobic respiration. More than 50 species ofShewanellahave been recognized [2].Shewanellais able to survive in a wide range of environments, including spoiled food and deep-sea and freshwater lake sediment as well as animals’ and patients’ blood and intestines [3–11]. Therefore,Shewanellahas been suggested to be a good candidate model for studying how microorganisms respond to environmental stresses, such as osmolarity, temperature, and pH [12–16].
Shewanellahas been detected in environments ranging from fresh water to hypersaline environments, and it has demonstrated its tolerance to a wide range of salt concentrations. ManyShewanella
species are marine microorganisms and, therefore, are naturally tolerant to relatively high levels of salt. Common mechanisms that bacteria used to respond to high salinity include the exclusion of harmful ions via a variety of transport systems and the accumulation of compatible solutes through uptake or biosynthesis [17]. ForShewanella, a recent study ofS. oneidensisin elevated salt conditions suggested that the down-regulation of flagellar-related genes might be necessary to conserve energy for sodium transport [18].
S. algae, a member of theShewanella genus, can cause human diseases, such as spondylodiscitis and bloody diarrhea [19–21]; therefore, it has attracted much attention in microbiology.S. algae
strains that produce tetrodotoxin and exist in various seafood are recently obtained from anal swabs of patients with food poisoning [22,23], and the strains are able to grow in high salt levels. The ability to adapt to high salt can be applied to their survival in seafood and other foods that contain high salt levels. In this study, we explored the responses and the possible adaptive mechanisms of S. algae strain to elevated salt stress by analyzing the transcriptome profiles of high salt cultures at different time points.
Materials and Methods
The Strain
S. algae strain 2736 (named MAS2736 previously) was one of strains isolated from the anal swab sample of a food poisoning patient with diarrhea and weak nerval symptom [22,23]. It can produce tetrodotoxin.
Growth Conditions
1:100 and then cultivated in triplicate in LB broth (1% tryptone, 0.5% yeast extract) containing 0.5%, 3%, 6%, 8%, or 9% NaCl at 37uC and 200 rpm. The growth rates were measured spectro-photometrically (OD600) once every hour in triplicate.
Sample Preparation
S. algaestrain 2736 was cultivated in biological triplicate in LB broth (1% tryptone, 0.5% yeast extract, 0.5% NaCl) for 5 h until it reached mid-log phase (OD600= 1.6). Some of the cultures were fixed with a 2:1 volume of RNA protect Bacteria (Qiagen), harvested by centrifugation (5,500 rpm at 4uC for 10 min), and then were stored at 280uC. The time of culture harvest was defined as time zero. The remaining cultures were harvested by centrifugation (5,500 rpm at 4uC for 10 min) and were resus-pended in PBS twice; then, they were cultivated in LB broth containing 8% NaCl. The samples were harvested at four time points (0, 1, 4, and 14 h) in biological triplicate.
Total RNA Extraction
Total RNA was isolated from the pellet using the RNeasy Mini kit (Qiagen). Genomic DNA was removed by incubation with DNAse (Promega). RNA quality was determined using an Agilent 2100 Bioanalyzer. The extracted total RNA was sequenced.
RNA Sequencing
rRNA was removed using a kit (BGI Tech) after the total RNA was collected from the prokaryote. Fragmentation buffer was added to disrupt the mRNA into short fragments. Using these short fragments as templates, random hexamer primers were used to synthesize the first-strand cDNA. Second-strand cDNA was synthesized using buffer, dATPs, dGTPs, dCTPs, dUTPs, RNase H, and DNA polymerase I after removing the dNTPs. Short fragments were purified using the QiaQuick PCR extraction kit and were resolved in EB buffer; the ends were repaired, and a poly(A) tail was added. Then, the short fragments were connected to sequencing adapters. The UNG enzyme(BGI Tech) was used to degrade the second-strand cDNA, and the product was purified using the MiniElute PCR Purification Kit prior to PCR amplification. Finally, the library was sequenced using an Illumina HiSeq2000 system.
Real-time Quantitative PCR (qRT-PCR)
Superscript III first-strand synthesis system (Invitrogen) was used to generate cDNA using 1mg of RNA and oligo dT primer, according to the manufacturer’s instructions. The qRT-PCR amplifications were performed using the SYBR Green EX Taq mix (TaKaRa) on a Bio-Rad CFX96 Real-Time PCR system. The relative expression level of the specific genes were determined by calculating 22DDcq
compared with the expression level of 0 h time point using 16s rRNA gene as an internal control. The qRT-PCR reactions were performed in triplicate for two biological replica-tions. The specific primers for each gene see Table S1.
Standard curves were generated for each gene to evaluate primer efficiency and for data analysis. S. algae strain 2736 was cultivated in biological triplicate in LB broth (1% tryptone, 0.5% yeast extract, 0.5% NaCl) for 5 h (OD600= 1.6) then total RNA was extracted, digested and converted to cDNA. Using 10-fold serial dilutions of the cDNA templates, qRT-PCR amplifications were performed. The standard curve was generated by plotting the Ct values versus ten times serial dilutions of the RNA templates ranging from 2.56100–2.561024ng/ml.
Data Analysis
In our analysis, the expression of each gene at 1 h, 4 h and 14 h was compared with of 0 h, respectively. RPKM (Reads Per kb per Million reads) method [42] was used for the calculation of gene expression difference. False Discovery Rate (FDR) control is used in multiple hypothesis testing to correct for p-value [42]. The genes with FDR#0.001 and the ratio greater than 2 were defined as differentially expressed genes (DEGS) compared with 0 h. These DEGS were then used for GO term functional analysis and KEGG pathway analysis.
Results and Discussion
Growth Curves ofS. algaeStrain 2736 Under Different Salt Concentrations
To investigate the concentrations of salt that could sustain the growth ofS. algae, strain 2736 was cultivated in triplicate in LB broth containing different concentrations of NaCl, ranging from 0.5% to 9%. The growth curves indicated that the optimal growth of strain 2736 is obtained in the presence of 2 to 4% however it is able to grow in presence of 0.5 to 8%. A lag is observed as well as an increased generation time when 8% of NaCl is present in the growth medium. Interestingly, a tremendous decrease in growth was observed between the 8% and 9% NaCl concentrations. Strain 2736 barely grew in LB broth containing 9% NaCl (Fig. 1), suggesting a switch mechanism in the regulation of growth. Under conditions of 8% NaCl, the bacterial growth slowed at the beginning but did reach the stationary phase, similar to growth in lower NaCl concentrations (Fig. 1); therefore, this concentration was regarded as the turning point of the NaCl concentration for the growth ofS. algae2736. In our study, 8% NaCl was used for salt stress of theS. algaestrain 2736.
Global Transcriptional Changes ofS. algae2736 in Response to Salt Stress
We harvestedS. algaestrain 2736 cells exposed to salt stress, and the gene transcript levels were serially monitored at 0, 1, 4, and 14 h. The overall transcriptional profiles revealed that a consid-erable subset of genes was involved in the response ofS. algae2736 to salt stress. To validate the transcriptome data, five open reading frames (ORFs) for the four time points were selected for real-time quantitative PCR analysis. The relative transcript levels were normalized to the levels of 16S rRNA. The results showed that the transcriptome data were highly correlated with the qRT-PCR data (R2= 0.946/0.976/0.934) (Fig. S1). Standard curves were generated for each gene to evaluate primer efficiency and for data
Figure 1. Growth curves forS. algae2736 grown in LB broth.S. algae2736 cells were cultured in LB broth containing 0.5%, 3%, 6%, 8%, or 9% NaCl.
analysis. The observed linearity was good for the standard curve over a wide range of cDNA dilutions in triplicate tests (Fig. S2).
We determined that a total of 1808 genes were regulated by salt stress, which represented approximately 41.5% (1808/4354) of the ORFs in the genome of S. algae strain 2736 (Table S2). We sequenced the strain 2736 genome using the Illumina method and obtained 4354 predicted CDSs. The genome sequence of 2736 has submitted to GenBank, with the accession number of SRP039467. Compared to the transcriptional level at 0 h, 710 genes and 507 genes were up-regulated and down-regulated, respectively, after 1 h of salt stress. After 4 h of salt stress, 835 genes and 227 genes were up-regulated and down-regulated, respectively. Additionally, after 14 h of salt stress, 883 genes were up-regulated, whereas 180 genes were down-regulated (Fig. 2). At each time point, we identified a larger proportion of up-regulated genes than down-regulated genes, indicating thatS. algae2736 cells resisted high salt stress mainly through the up-regulation of genes. Based on the KEGG pathway analysis, the significantly changed genes were assigned to 19 functional classes. Almost 40.3% of the differentially expressed genes (DEGS) encoded hypothetical proteins, conserved hypothetical proteins, and proteins with unknown functions (499 ORFs or 27.6% of the genes assigned to these categories). The other DEGS were involved in cellular processes and signaling (9.7%), membrane transport (6.0%), carbohydrate metabolism (5.6%), and amino acid metabolism (5.1%), among others (Table 1). Together, almost 20.9% of the genes with significantly altered expression were involved in various metabolic processes. These data indicated that groups of genes involved in various metabolisms, membrane transport, replication and repair, signal transduction, transcription, cell motility, cellular processes and signaling, and translation could play important roles in modulating the cellular activities that allowedS. algae2736 to adapt to salt stress.
According to the dynamic changes, the transcriptional profiles were split into 19 clusters (Fig. 3). Clusters 1, 2, and 3 showed a stable up-regulation profile. Cluster 1 showed rapid up-regulation within 1 h, after which the gene profiles obtained stable up-regulation. However, clusters 2 and 3 reached stable up-regulation after a delay of 4 h or 14 h, respectively. Clusters 4, 5, 6, and 7 showed initial up-regulation, but transcriptional levels were restored to the 0 h levels or were down-regulated at the subsequent time points. Cluster 8 showed up-regulation after
1 h, followed by a decrease in transcription levels to the 0 h level at 4 h and a subsequent increase in transcription levels at 14 h. Clusters 9, 10, and 11 reached stable down-regulation at 1, 4, and 14 h, respectively. Clusters 11, 12, 13, 14, 15, 16, 17, and 18 showed initial down-regulation, but transcriptional levels were restored to the 0 h levels or were up-regulated at the subsequent time points. Cluster 19 showed down-regulation after 1 h, followed by an increase in transcription levels to the 0 h level at 4 h and a subsequent decrease in transcription levels at 14 h.
In summary, S. algae 2736 cells displayed a wide range of transcriptional alterations after exposure to elevated salt condi-tions, suggesting that S. algae resisted high salt stress through multiple strategies.
Alterations of High Salt-related Genes inS. algae2736
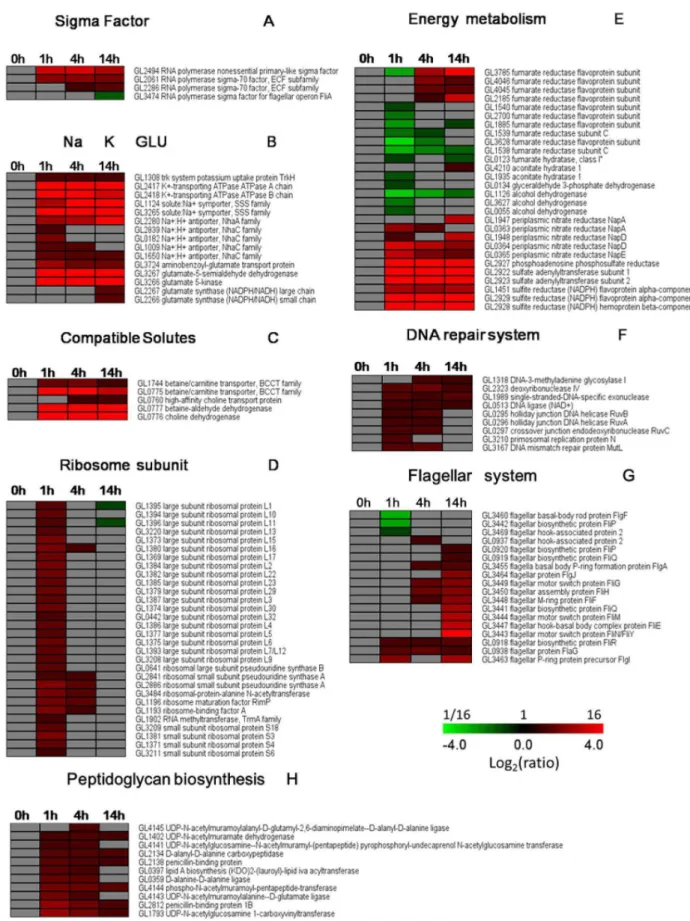
Sigma factor. In our study, four putative sigma factors were found to be regulated inS. algae2736 after exposure to elevated NaCl conditions, including GL2494, GL2061, GL2286, and GL3474 (Fig. 4A). GL2494, or the RNA polymerase nonessential primary-like sigma factor, which has 75% homology with RpoS, showed significantly sustained up-regulation beginning 1 h after salt stress. RpoS is a global regulatory factor that regulates genes that are mostly related to stress resistance. In E. coli, RpoS positively regulates approximately 10% of the genes in the whole genome when the bacterium encounters acute environmental stress, such as hyperosmosis, nutrient deficiency, low pH, and heat shock [24,25]. GL2061 and GL0228 are RNA polymerase sigma-70 factors that belong to the extracytoplasmic function (ECF) subfamily. ECF sigma factors play key roles during various stress responses and morphological development [26]. GL2061 was immediately up-regulated after salt stress, and it remained at a high level, whereas GL0228 displayed relatively delayed up-regulation, starting 4 h after salt exposure. GL3474, the RNA polymerase sigma factor for flagellar operon FliA, was highly down-regulated at 14 h after salt stress. Our data indicate that sigma factors contributed to the regulation of salt-inducible genes inS. algae2736.
Na+
efflux, K+
uptake, and glutamate accumulation. In
E. coli, Na+efflux commonly occurs upon exposure to high salt conditions, along with simultaneous activation of K+
uptake, thus resulting in high levels of K+
ions. Additionally, the cells accumulate glutamate to neutralize the large amounts of cation accumulation [27]. The primary response ofS. algae2736 to salt stress is similar to that ofE. coli. As expected, two genes encoding Na+
efflux transporters and five genes encoding Na+ /H+ antiporters were found to be highly up-regulated after 1 h of salt exposure (Fig. 4B). Bacterial cells have three diverse K+ transporter systems that maintain the desired concentration of internal K+
: Kup, Trk, and Kdp [28,29]. InS. algae2736, trkH,
KdpA,and KdpBwere significantly up-regulated at all three time points after salt stress (Fig. 4B), demonstrating their importance in the adaptation ofS. algaeto high salt. Additionally, genes encoding the aminobenzoyl-glutamate transporter showed dramatic and immediate up-regulation, especially after 1 h of salt stress. In contrast, the genes encoding the large and small chains of glutamate synthase, which are required for glutamate synthesis, displayed delayed up-regulation patterns and were up-regulated at 14 h after salt stress (Fig. 4B). These data indicate that, at an early stage, the importation of glutamate from the outside was the primary mechanism used to counter high salt stress in S. algae
2736. As a secondary response, glutamate synthesis was then activated, resulting in the continual adaption ofS. algaeto its high salinity environment. In contrast, we detected a dramatic and sustained increase in the transcription of genes encoding Figure 2. Statistical chart ofS. algae2736 DEGS in response to
salt stress.Compared to the transcriptional level at 0 h, 710 genes and 507 genes were up-regulated and down-regulated, respectively, at 1 h. At 4 h, 835 genes and 227 genes were up-regulated and down-regulated, respectively, whereas 883 genes were up-regulated and 180 genes were down-regulated at 14 h.
glutamate-5-semialdehyde dehydrogenase and glutamate 5-kinase (Fig. 4B), two critical enzymes needed to convert glutamate into proline [30]. Taking these data together, we conclude that the genes encoding K+
uptake proteins and Na+
efflux system components, as well as genes involved in glutamate and proline biosynthesis, were highly induced by NaCl stress inS. algae2736.
Accumulation of compatible solutes. The most common strategy used by bacteria to survive and grow in high salt environments is the accumulation of compatible solutes, either by uptake or by biosynthesis, including glycine betaine, choline, carnitine, and trehalose [31]. InS. algae2736, significant changes in compatible solutes were observed at the transcript level under high salt conditions (Fig. 4C). In particular, the expression of the glycine betaine/carnitine transporter was up-regulated at 1, 4, and 14 h after salt stress. The transcript level of the choline transporter was up-regulated beginning at 4 h after salt stress. Two putative genes for betaine synthesis, choline dehydrogenase (BetA) and glycine betaine aldehyde dehydrogenase (BetB), were significantly up-regulated at all three time points in the presence of high salt. These data indicate that S. algae 2736 first used betaine as an important compatible solute to protect against the high salt stress, whereas choline played a later role.
Large- and small-ribosome subunits. In the present study, we found that the transcript levels of the large- and small-ribosome subunits were significantly enhanced at 1 h after salt stress. However, the levels of most of the large- and small-ribosome subunits were restored to their initial levels at 4 h after salt stress (Fig. 4D), suggesting that S. algae entered an adaptive phase. Consistent with our results, a previous study suggested that the removal of a putative ribosome maturation factor conferred salt tolerance onE. colicells [32]. Moreover, the majority of the 70S ribosome was dissociated into subunits after the addition of high
concentrations of NaCl, and the dissociated subunits began to reassociate into the 70S ribosome after 4 or 6 h of salt stress. It has been suggested that the ribosome mediates a novel stress response pathway [33]. Taken together, the large- and small-ribosome subunits appeared to play roles in the adaption ofS. algaeto high salt stress.
Energy metabolism. It has been suggested that critical enzymes involved in both aerobic and anaerobic respiration were significantly up-regulated in salt-stressed bacterial cells [18,34–37]. Notably, in our study, the transcript levels of fumarate reductase and aconitate hydratase, two critical enzymes necessary for the tricarboxylic acid (TCA) cycle, were down-regulated in S. algae
2736 cells after 1 h of salt stress, and these levels increased again to the 0 h level or further increased at 4 h and 14 h. Similarly, glyceraldehyde 3-phosphate dehydrogenase and alcohol dehydro-genase, key enzymes involved in the glycolytic pathway, were down-regulated at the transcriptional level at 1 h after salt stress and returned to the 0 h level after 4 h of salt stress. However, enzymes critical for anaerobic respiration, such as periplasmic nitrate reductase, sulfite reductase, and sulfate reductase, were significantly enhanced at the transcriptional level inS. algae2736 cells at the three time points after high salt exposure (Fig. 4E). Based on these findings together, we conclude that, during the initial stage after exposure to high salt concentrations,S. algae2736 appears to utilize anaerobic respiration for energy production, instead of the tricarboxylic acid (TCA) cycle and the glycolytic pathway.
DNA repair system. The overall transcriptome profiles demonstrated that genes involved in DNA base excision repair, mismatch repair, and homologous recombination were dramati-cally up-regulated in the salt-stressedS. algae2736 cells, especially at 1 h and 4 h after salt exposure (Fig. 4F). Three DNA helicases Table 1.Time course distribution of up- and down- regulated genes within KEGG pathway.
KEGG class2 Total 1 h up(down) 4 h up(down) 14 h up(down)
Amino acid metabolism 93 51(17) 50(2) 33(3)
Carbohydrate metabolism 102 30(48) 36(14) 38(17)
Energy metabolism 69 32(20) 27(7) 40(6)
Lipid metabolism 28 10(2) 18(0) 16(4)
Nucleotide metabolism 32 14(6) 16(6) 9(8)
Glycan biosynthesis and metabolism 11 11(0) 8(0) 6(0)
Metabolism of cofactors and vitamins 34 64(51) 74(23) 76(21)
Xenobiotics biodegradation and metabolism 8 3(4) 3(2) 6(2)
Enzyme families 43 15(11) 22(3) 29(3)
Folding, sorting and degradation 32 15(8) 14(3) 9(5)
Genetic Information processing 68 28(21) 31(7) 29(6)
Cell growth and death 6 2(1) 2(0) 5(0)
Membrane transport 108 30(35) 53(17) 65(11)
Replication and repair 51 26(8) 35(5) 20(0)
Signal transduction 79 24(29) 30(13) 44(8)
Transcription 66 32(19) 30(12) 29(8)
Cell motility 14 4(2) 7(0) 9(0)
Cellular processes and signaling 172 78(43) 90(27) 98(15)
Translation 48 35(1) 10(5) 2(11)
Function unknown 499 177(150) 236(68) 268(42)
NA CLASS 230 78(68) 99(28) 106(29)
encoded by RuvABC were up-regulated at 1 h and 4 h after salt stress. RuvB might function at the Holliday junctions to overcome regions of DNA heterology and DNA lesions [38]. DNA helicases are known confer high salinity tolerance in tobacco [39]. These results indicate that salt stress might induce the impairment of nucleic acid synthesis, thereby triggering the corresponding repair systems.
Peptidoglycan biosynthesis. We observed that key genes related to peptidoglycan biosynthesis were up-regulated inS. algae
2736 cells by salt stress (Fig. 4H). It has been documented that several physical changes, such as dehydration and shrinkage of the cells, occur immediately inE. colicells after osmotic shock caused by an increase in salt concentration, in response to the changes in environmental osmolarity [40,41]. Therefore, our data also indicate that peptidoglycan, the dominant component of the Gram-negative bacterial cell wall, serves as an osmoprotectant
and, therefore, helpsS. algaeto combat the dehydration caused by high levels of salt.
Flagellar system. Among all of the flagellar-related genes, three genes were down-regulated, whereas another three genes were up-regulated at 1 h after salt exposure. Importantly, seven genes were up-regulated at 4 h after high salt exposure, and 14 genes were up-regulated at 14 h after salt administration. No genes were found to be down-regulated at either 4 h or 14 h after salt stress (Fig. 4G). Previous studies have documented in detail the transcriptional regulation of flagellar genes in bacterial species. For example,S. oneidensisMR-1 responded to elevated salt concentra-tions by down-regulating flagellar assembly genes, accompanied by a decrease in cell motility. A dynamic process was observed in
Desulfovibrio vulgaris Hildenborough. During early time points during salt stress, many chemotaxis-related genes were found to be up-regulated; at later time points during salt stress, only a few such genes were overexpressed, and the expression of most genes Figure 3. Classification of differentially expressed genes based on the dynamics of the transcript changes during the time course. The number of genes included within each cluster is reported in blue between parentheses.
Figure 4. Alterations in high salt-related genes inS. algae2736.The clusters were created using TMEW. (A) Sigma factor. (B) Na+efflux, K+
uptake, and glutamate accumulation. (C) Accumulation of compatible solutes. (D) Large- and small-ribosome subunits. (E) Energy metabolism. (F) DNA repair system. (G) Flagellar system. (H) Peptidoglycan biosynthesis. Specific colors represent the different regulation patterns. Gray, no change. Red, up-regulation. Green, down-regulation.
remained unchanged [18,34–36]. Our results were not consistent with the findings above, and one possible explanation could be that the up-regulation of flagellar genes at 14 h might not be related to the response to high salt but was instead related to the growth state of the bacteria.
In conclusion, in this study, we explored the possible mechanisms of the adaptation of S. algae to high salt conditions by performing transcriptome profiling combined with cell growth analyses. A broad set of differentially expressed genes was observed. Globally, genome-wide transcriptional analyses demon-strated that transcript changes, especially changes in amino acid metabolism, carbohydrate metabolism, energy metabolism, mem-brane transport, regulatory functions, and cellular signaling, seemed to be important forS. algaeto respond to salt stress.
Importantly, we elucidated a temporal, dynamic process in the salt-stressedS. algaestrain 2736 by monitoring gene transcription levels at 0, 1, 4, and 14 h. Exposure ofS. algaeto high salt could induce two different, but related, responses, which we defined here
as the initial and prolonged responses. Initially, in response to the high salt environment, theS. algaestrain quickly recruited central factors, such as K+, glutamate, and betaine, mainly through import, as represented by the apparent up-regulation of certain transport genes (e.g., K+
transporters, aminobenzoyl-glutamate transports, and glycine betaine/carnitine transporter) at 1 h. Na+ efflux, the accumulation of large2/small-ribosome subunits, and the induction of the DNA repair system appear to be other initial mechanisms of the response ofS. algaeto elevated salt stress. It is worth noting thatS. algaecan rely on anaerobic respiration but not the tricarboxylic acid (TCA) cycle or glycolytic pathway for energy production during the initial stage of high salt exposure. WhenS. algae was persistently exposed to high salt concentrations, as a prolonged response, corresponding biosynthesis systems were triggered to play vital roles, resulting in the adaption ofS. algae
to salt stress. For instance, the expression of choline transport protein was increased beginning at 4 h after salt stress. However, some prolonged regulated genes did not appear to be related to the Figure 5. Conceptual model ofS. algaeresponses to the exposure to high NaCl concentration.The protein elements involved in the changed pathways were showed and marked with different colors: Red indicates the transcription increase at all three time points (1 h, 4 h, 14 h); Orange indicates the increase at 1 h or 4 h, or both 1 h and 4 h; Yellow indicates the increase at 14 h; Green indicates the decreased transcription at any one time point, no increase was observed in all three time points. The names of the pathways and the transported substrates were shown as black fonts.
high salt response but were instead related to the growth state of the bacteria. For example, the expression of flagellar genes and glutamate synthase were increased beginning 14 h after high salt exposure (Fig. 5).
Taking all of our findings together, we present a temporal, dynamic response pattern ofS. algaestrain 2736 after exposure to high salt conditions, and our results elucidate the mechanisms that
Shewanellautilizes to survive and adapt to environmental stress.
Supporting Information
Figure S1 Correlation of real-time qRT-PCR and RNA sequencing analyses.
(TIF)
Figure S2 The standard curves for each gene.
(TIF)
Table S1 qRT-PCR Primers.
(DOCX)
Table S2 The raw data and the complete list of up and down regulated genes.
(XLS)
Author Contributions
Conceived and designed the experiments: BK XF DW. Performed the experiments: XF. Analyzed the data: BK XF PD. Contributed reagents/ materials/analysis tools: BK XF DW. Wrote the paper: BK XF XY DW.
References
1. Dikow RB (2011) Genome-level homology and phylogeny of Shewanella (Gammaproteobacteria: lteromonadales: Shewanellaceae). BMC Genomics 12: 237.
2. Verma P, Pandey PK, Gupta AK, Kim HJ, Baik KS, et al. (2011) Shewanella indica sp. nov., isolated from sediment of the Arabian Sea. Int J Syst Evol Microbiol 61: 2058–2064.
3. Pagani L, Lang A, Vedovelli C, Moling O, Rimenti G, et al. (2003) Soft tissue infection and bacteremia caused by Shewanella putrefaciens. J Clin Microbiol 41: 2240–2241.
4. Nath R, Saikia L, Choudhury G, Das PP (2011) Isolation of Shewanella algae from rectal swabs of patients with bloody diarrhoea. Indian J Med Microbiol 29: 422–425.
5. Zong Z (2011) Nosocomial peripancreatic infection associated with Shewanella xiamenensis. J Med Microbiol 60: 1387–1390.
6. Shrishrimal K (2011) Recurrent Ochrobactrum anthropi and Shewanella putrefaciens bloodstream infection complicating hemodialysis. Hemodial Int 16: 113–115.
7. Basir N, Yong AM, Chong VH (2011) Shewanella putrefaciens, a rare cause of splenic abscess. J Microbiol Immunol Infect 45: 151–153.
8. Myers CR, Nealson KH (1988) Bacterial manganese reduction and growth with manganese oxide as the sole electron acceptor. Science 240: 1319–1321. 9. Pinhassi J, Berman T (2003) Differential growth response of colony-forming
alpha- and gamma-proteobacteria in dilution culture and nutrient addition experiments from Lake Kinneret (Israel), the eastern Mediterranean Sea, and the Gulf of Eilat. Appl Environ Microbiol 69: 199–211.
10. Jiang H, Dong H, Yu B, Liu X, Li Y, et al. (2007) Microbial response to salinity change in Lake Chaka, a hypersaline lake on Tibetan plateau. Environ Microbiol 9: 2603–2621.
11. Skerratt JH, Bowman JP, Nichols PD (2002) Shewanella olleyana sp. nov., a marine species isolated from a temperate estuary which produces high levels of polyunsaturated fatty acids. Int J Syst Evol Microbiol 52: 2101–2106. 12. Yamada M, Nakasone K, Tamegai H, Kato C, Usami R, et al. (2000) Pressure
regulation of soluble cytochromes c in a deep-Sea piezophilic bacterium, Shewanella violacea. J Bacteriol 182: 2945–2952.
13. Lefebvre O, Vasudevan N, Thanasekaran K, Moletta R, Godon JJ (2006) Microbial diversity in hypersaline wastewater: the example of tanneries. Extremophiles 10: 505–513.
14. Li S, Xiao X, Li J, Luo J, Wang F (2006) Identification of genes regulated by changing salinity in the deep-sea bacterium Shewanella sp. WP3 using RNA arbitrarily primed PCR. Extremophiles 10: 97–104.
15. Kulp TR, Hoeft SE, Miller LG, Saltikov C, Murphy JN, et al. (2006) Dissimilatory arsenate and sulfate reduction in sediments of two hypersaline, arsenic-rich soda lakes: Mono and Searles Lakes, California. Appl Environ Microbiol 72: 6514–6526.
16. Leblanc L, Leboeuf C, Leroi F, Hartke A, Auffray Y (2003) Comparison between NaCl tolerance response and acclimation to cold temperature in Shewanella putrefaciens. Curr Microbiol 46: 157–162.
17. Roesser M, Muller V (2001) Osmoadaptation in bacteria and archaea: common principles and differences. Environ Microbiol 3: 743–754.
18. Liu Y, Gao W, Wang Y, Wu L, Liu X, et al. (2005) Transcriptome analysis of Shewanella oneidensis MR-1 in response to elevated salt conditions. J Bacteriol 187: 2501–2507.
19. Gao H, Yang ZK, Wu L, Thompson DK, Zhou J (2006) Global transcriptome analysis of the cold shock response of Shewanella oneidensis MR-1 and mutational analysis of its classical cold shock proteins. J Bacteriol 188: 4560– 4569.
20. Gao H, Wang Y, Liu X, Yan T, Wu L, et al. (2004) Global transcriptome analysis of the heat shock response of Shewanella oneidensis. J Bacteriol 186: 7796–7803.
21. Gressier M, Mbayo D, Deramond H, Grados F, Eb F, et al. First case of human spondylodiscitis due to Shewanella algae. Int J Infect Dis 14 Suppl 3: e261–264. 22. Wang D, Wang Y, Huang H, Lin J, Xiao D, et al. (2013) Identification of tetrodotoxin-producing Shewanella spp. from feces of food poisoning patients and food samples. Gut Pathog 5: 15.
23. Wang YL, Wang DC, Zhan SW, Zheng JX, Liu Y, et al. (2009) Isolation and characterization of Shewanella spp. from patients of food poisoning. Zhonghua Liu Xing Bing Xue Za Zhi 30: 836–840.
24. Hengge R (2009) Proteolysis of sigmaS (RpoS) and the general stress response in Escherichia coli. Res Microbiol 160: 667–676.
25. Hengge-Aronis R (2002) Recent insights into the general stress response regulatory network in Escherichia coli. J Mol Microbiol Biotechnol 4: 341–346. 26. Hughes KT, Mathee K (1998) The anti-sigma factors. Annu Rev Microbiol 52:
231–286.
27. Sleator RD, Hill C (2002) Bacterial osmoadaptation: the role of osmolytes in bacterial stress and virulence. FEMS Microbiol Rev 26: 49–71.
28. Schlosser A, Meldorf M, Stumpe S, Bakker EP, Epstein W (1995) TrkH and its homolog, TrkG, determine the specificity and kinetics of cation transport by the Trk system of Escherichia coli. J Bacteriol 177: 1908–1910.
29. Epstein W (1992) Kdp, a bacterial P-type ATPase whose expression and activity are regulated by turgor pressure. Acta Physiol Scand Suppl 607: 193–199. 30. Nandakumar R, Wakayama M, Nagano Y, Kawamura T, Sakai K, et al. (1999)
Overexpression of salt-tolerant glutaminase from Micrococcus luteus K-3 in Escherichia coli and its purification. Protein Expr Purif 15: 155–161. 31. van Der Heide T, Poolman B (2000) Glycine betaine transport in Lactococcus
lactis is osmotically regulated at the level of expression and translocation activity. J Bacteriol 182: 203–206.
32. Hase Y, Tarusawa T, Muto A, Himeno H Impairment of ribosome maturation or function confers salt resistance on Escherichia coli cells. PLoS One 8: e65747. 33. Hase Y, Yokoyama S, Muto A, Himeno H (2009) Removal of a ribosome small subunit-dependent GTPase confers salt resistance on Escherichia coli cells. Rna 15: 1766–1774.
34. Yin J, Gao H (2011) Stress responses of shewanella. Int J Microbiol 2011: 863623.
35. Mukhopadhyay A, He Z, Alm EJ, Arkin AP, Baidoo EE, et al. (2006) Salt stress in Desulfovibrio vulgaris Hildenborough: an integrated genomics approach. J Bacteriol 188: 4068–4078.
36. He Z, Zhou A, Baidoo E, He Q, Joachimiak MP, et al. (2011) Global transcriptional, physiological, and metabolite analyses of the responses of Desulfovibrio vulgaris hildenborough to salt adaptation. Appl Environ Microbiol 76: 1574–1586.
37. Hinsley AP, Berks BC (2002) Specificity of respiratory pathways involved in the reduction of sulfur compounds by Salmonella enterica. Microbiology 148: 3631– 3638.
38. Kaplan DL, O’Donnell M (2004) Twin DNA pumps of a hexameric helicase provide power to simultaneously melt two duplexes. Mol Cell 15: 453–465. 39. Sanan-Mishra N, Pham XH, Sopory SK, Tuteja N (2005) Pea DNA helicase 45
overexpression in tobacco confers high salinity tolerance without affecting yield. Proc Natl Acad Sci U S A 102: 509–514.
40. Vollmer W, Bertsche U (2008) Murein (peptidoglycan) structure, architecture and biosynthesis in Escherichia coli. Biochim Biophys Acta 1778: 1714–1734. 41. Young KD (2003) Bacterial shape. Mol Microbiol 49: 571–580.