Perfluoroalkyl Acid Concentrations in Blood
Samples Subjected to Transportation and
Processing Delay
Cathrine Carlsen Bach1*, Tine Brink Henriksen1,2, Rossana Bossi3, Bodil Hammer Bech4, Jens Fuglsang5, Jørn Olsen4,6, Ellen Aagaard Nohr7
1Perinatal Epidemiology Research Unit, Aarhus University Hospital, Aarhus, Denmark,2Department of Pediatrics, Aarhus University Hospital, Aarhus, Denmark,3Department of Environmental Science, Aarhus University, Roskilde, Denmark,4Section for Epidemiology, Department of Public Health, Aarhus University, Aarhus, Denmark,5Department of Obstetrics and Gynecology, Aarhus University Hospital, Aarhus, Denmark,6Department of Epidemiology, Fielding School of Public Health, University of California Los Angeles, California, United States of America,7Research Unit for Obstetrics and Gynecology, Institute of Clinical Research, University of Southern Denmark, Odense, Denmark
Abstract
Background
In studies of perfluoroalkyl acids, the validity and comparability of measured concentrations may be affected by differences in the handling of biospecimens. We aimed to investigate whether measured plasma levels of perfluoroalkyl acids differed between blood samples subjected to delay and transportation prior to processing and samples with immediate pro-cessing and freezing.
Methods
Pregnant women recruited at Aarhus University Hospital, Denmark, (n = 88) provided paired blood samples. For each pair of samples, one was immediately processed and plasma was frozen, and the other was delayed and transported as whole blood before processing and freezing of plasma (similar to the Danish National Birth Cohort). We measured 12 perfluor-oalkyl acids and present results for compounds with more than 50% of samples above the lower limit of quantification.
Results
For samples taken in the winter, relative differences between the paired samples ranged between -77 and +38% for individual perfluoroalkyl acids. In most cases concentrations were lower in the delayed and transported samples, e.g. the relative difference was -29% (95% confidence interval -30; -27) for perfluorooctane sulfonate. For perfluorooctanoate there was no difference between the two setups [corresponding estimate 1% (0, 3)]. Differ-ences were negligible in the summer for all compounds.
OPEN ACCESS
Citation:Bach CC, Henriksen TB, Bossi R, Bech BH, Fuglsang J, Olsen J, et al. (2015) Perfluoroalkyl Acid Concentrations in Blood Samples Subjected to Transportation and Processing Delay. PLoS ONE 10 (9): e0137768. doi:10.1371/journal.pone.0137768
Editor:Aimin Chen, University of Cincinnati, UNITED STATES
Received:April 10, 2015
Accepted:August 20, 2015
Published:September 10, 2015
Copyright:© 2015 Bach et al. This is an open access article distributed under the terms of the Creative Commons Attribution License, which permits unrestricted use, distribution, and reproduction in any medium, provided the original author and source are credited.
Data Availability Statement:All relevant data are within the paper and its Supporting Information files.
Funding:The work was supported by The Danish Council for Strategic Research (http://ufm.dk/en/ research-and-innovation/councils-and-commissions/ the-danish-council-for-strategic-research), grant number 10-092818, and is part of the Fetotox project (fetotox.au.dk). The funders had no role in study design, data collection and analysis, decision to publish, or preparation of the manuscript.
Conclusions
Transport of blood samples and processing delay, similar to conditions applied in some large, population-based studies, may affect measured perfluoroalkyl acid concentrations, mainly when outdoor temperatures are low. Attention to processing conditions is needed in studies of perfluoroalkyl acid exposure in humans.
Introduction
Several studies have addressed potential health effects of human exposure to perfluoroalkyl and polyfluoroalkyl substances (PFASs), but not all studies have standardized the sampling and storage of biospecimens since PFASs are considered to have stable chemical structures [1]. Methods for exposure assessment differed in terms of type of biospecimen, processing and pre-analytic conditions (e.g. handling of samples before processing and freezing, storage tempera-tures, repeated freeze-thaw cycles), laboratory analyses, and the approach to levels below the limit of quantification (LOQ).
Although the extent of use of some PFASs [perfluorooctane sulfonate (PFOS) and perfluor-ooctanoate (PFOA)] is now limited by regulation in several countries [2–6], these compounds
remain present in carpets, furniture, shoes, clothes, non-stick cookware, food packaging, and a variety of other consumer products, and similar chemicals are still used [7,8]. Of the large PFAS group, two perfluoroalkyl acids (PFAAs), PFOA and PFOS, are the most investigated compounds. PFOA and PFOS can be measured in biospecimens from most people and have serum half-lives of approximately 5 and 3.5 years, respectively [9]. Human exposure routes include ingestion, inhalation, and dermal absorption [10]. In pregnant women, PFOA and PFOS cross the placenta to the fetal circulation [11]. Serum and plasma are routine matrices in human studies, and the serum and plasma ratio approximates 1:1 for PFOS and PFOA [12].
Many studies on PFAAs have used material from large biobanks for which thousands of samples were collected and stored at very low temperatures (usually -80°C) for long periods of time before concentrations of PFAAs were measured. Some studies followed strict procedures allowing very short time between the collection of blood and processing and freezing [13,14] while others, e.g., the studies conducted in the Danish National Birth Cohort [11,15–21] used
samples that were transported for hours or up to two days as whole blood, at unknown temper-atures, before processing and freezing. To our knowledge, the impact of such conditions prior to processing has not been evaluated in human whole blood samples. The aim of this study was to investigate whether measured plasma levels of PFAAs in paired samples from pregnant women differed between a setup that mimicked conditions in the DNBC and a setup of imme-diate processing and freezing, after both sets of plasma samples were stored for several years. We investigated whether any observed differences varied according to the season of blood sam-pling since we hypothesized that transportation temperatures could modify the final PFAA concentration.
Methods
Study design and participants
and transportation under different outdoor temperatures (ranging from below 0˚C during the winter to above 20˚C during the summer). All women provided written informed consent prior to blood sampling.
Ethics statement
Permission from the Health Research Ethics Committee, Central Denmark Region, was not required since the project was a validation study (journal number 205–2.0/6).
Procedures
Each woman provided two (n = 67) or three (n = 21) samples of 9 mL blood that were drawn to EDTA tubes (Vacuette, Greiner Bio-One, Kremsmünster, Austria) at the same time and marked with encrypted identification numbers. The date and time were registered, and samples were treated according to three setups (Fig 1). In the immediate processing setup, 88 samples (36 during winter, 52 during summer) were processed, and plasma was frozen to -80˚C within two hours. The delay and transportation setup mimicked conditions for the DNBC sampling procedure (General practitioners took blood samples from pregnant women all over Denmark and mailed them to the cohort biobank in Copenhagen, where they were processed and plasma was frozen [15]). In our setup, we transported 88 samples at ambient temperature to one of four public mailboxes. Samples were returned to the laboratory by standard postal procedures after a maximum of 48 hours (most samples were returned within 24 hours). Samples were processed, and plasma was frozen upon arrival. A total of 21 women, who were all recruited during the summer, provided a third sample to which we applied delayed processing without transportation. These samples were left on a table in our laboratory at room temperature (approximately 20˚C) for 20–24 hours before they were processed and plasma was frozen in
order to disentangle the effect of delayed processing in itself and delayed processing and trans-portation (including more various temperature changes and movements).
The processing method was identical for the three setups. Blood samples were centrifuged at 1730 g for 10 minutes at room temperature, and plasma was pipetted to polypropylene cryo-tubes (Sarstedt, Nümbrecht, Germany). In summary, 36 paired samples were available in the winter and 52 in the summer for comparison between immediate processing and processing delay and transportation. Twenty-one paired samples were available for the comparison between only delayed processing and delayed processing in combination with transport during the summer.
Fig 1. Illustration of the three designs applied to paired blood samples from pregnant women.Each woman donated two (n = 67) or three (n = 21) blood samples. For all women (n = 88), blood sample 1 and 2 were treated as displayed in the Fig. For the 21 women that provided a third blood sample this sample was treated as displayed for blood sample 3.
PFAA analysis
Plasma samples from all three setups were stored at -80˚C until they were transported for approximately three hours to the Department of Environmental Science, Aarhus University, on dry ice in October 2013. A total of 12 PFAAs were measured [perfluorohexane sulfonate (PFHxS), perfluoroheptane sulfonate (PFHpS), PFOS, perfluorodecane sulfonate (PFDS), per-fluorooctane sulfonamide (PFOSA), perfluoroheptanoic acid (PFHpA), PFOA, perfluoronona-noic acid (PFNA), perfluorodecaperfluoronona-noic acid (PFDA), perfluoroundecaperfluoronona-noic acid (PFUnA), perfluorododecanoic acid (PFDoA), and perfluorotridecanoic acid (PFTrA)]. A laboratory technician blinded to sampling conditions performed all analyses. The extraction method was based on solid phase extraction [22]. Samples were spiked with13C-labelled internal standards (10 ng/mL) before extraction [13C2-PFHxA,13C4-PFOA,13C5-PFNA,13C2-PFDA,13C2
-PFUnA,13C2-PFDoA,13C8-PFOSA,18O2-PFHxS,13C4-PFOS, Wellington Laboratories
(Guelph, ON, Canada)]. They were extracted and analyzed in batches with a procedural blank and two control samples. These consisted of test material analyzed in a ring test that had assigned values for PFOS and PFOA concentrations. The laboratory participated in the Arctic Monitoring and Assessment Programme (AMAP) Ring Test for Organic Pollutants in Human Serum organized by Institut National de Santé Publique du Québec to test method perfor-mance three times a year.
We used LC-MS-MS with electrospray ionization in negative mode for the analyses. The method detection limits (MDLs) were calculated as three times the standard deviation for blank values (n = 8). For compounds not having blank values, the MDL was calculated as three times the standard deviation of samples (n = 5) spiked to a concentration of 0.5 ng/mL (equal to five times the concentration of the lowest calibration standard).
The limit of quantification (LOQ) was calculated as 5 times the standard deviation for each compound. The precision of the method (intra-day and inter-day) was calculated at 1 ng/mL and 10 ng/mL spikes (seeS1 Table). Five different samples were analyzed per day for four days by two different laboratory technicians. We determined the intra-day relative standard devia-tion % (RSD %) for each day as the standard deviadevia-tion divided by the average level of the five samples multiplied by 100. The four intra-day RSDs were squared and added together, then divided by 4. Finally, the square root of this yielded the inter-day RSD %. In addition, we exam-ined the precision of our method by analyzing 38 randomly selected duplicates from all three setups in order to compare the random variation in this setup with the potential systematic differences.
The measured bias for PFOS and PFOA was calculated from repeated analyses (n = 16) of human serum from one of the rounds of the AMAP Ring Test for Persistent Organic Pollutants in Human Serum (S1 Table). The values assigned for PFOS and PFOA by the organizer of the Ring test were used as certified values (other PFAAs were not included in the Ring Test before 2013).
Statistical analysis
For some of the investigated PFAAs, the differences increased with increasing average levels. Since this indicated a violation of one of the assumptions for using the paired t-test [23], and in order to identify relative instead of absolute differences, we transformed PFAA levels by the natural logarithm and repeated the plots (Fig 2), which then indicated no assumption viola-tions. To ease the interpretation of the results we exponentiated the estimates from the paired t-tests, acquiring mean ratios. We present the mean ratios minus one to illustrate the relative paired differences in percent (for instance, a mean ratio of 1.10 is equal to a relative difference of 10%). Similarly, we compared the blood samples that were transported and delayed to those that were only delayed (n = 21).
We performed sensitivity analyses according to different approaches to values below the LOQ. First, we repeated the analyses using a common approach of substituting values below the LOQ with the LOQ divided by 2 [24,25]. In another sensitivity analysis, we restricted to samples with concentrations above the LOQ. Multiple imputation of values below the LOQ was neither possible nor sensible in our setup. The 38 duplicates were analysed as described for the other paired comparisons. The statistical analyses were conducted in STATA statistical software version 12 (StataCorp, College Station, TX, USA).
Results
For PFDoA, PFOSA, PFDS, and PFTrA>50% of values were below the LOQ, and we do not
present results for these compounds. The number of values below the LOQ for the included compounds is shown inTable 1. Median levels of the eight presented PFAAs ranged from 0.1 to 20 ng/mL in the immediately processed samples (Table 2).
For samples that were taken in the winter, relative PFAA differences between the delayed and transported samples and the immediately processed samples ranged between -77 and +38%. Five PFAAs (PFUnA, PFDA, PFHpS, PFOS, PFNA) were detected with lower concen-trations in the delayed and transported samples [the relative difference (95% confidence inter-val) was -29 (-30, -27) for PFOS]. For PFOA, there was no difference between the two setups [relative difference (95% confidence interval) 1 (0, 3)], while for PFHxS and PFHpA, concen-trations were higher in the delayed and transported samples. For samples taken during the summer, the relative differences between the immediately processed and the transported and delayed samples were negligible.
Concentrations were similar for the 21 paired samples from the summer when delayed pro-cessing was compared with delayed propro-cessing and transportation. Concentrations deviated by less than 10% for all compounds; for PFOS and PFOA relative differences (95% confidence interval) were -2 (-5, 1) and -1 (-3, 1), seeTable 3.
Sensitivity analyses restricted to values>LOQ or assigning these values equal to the LOQ
divided by two provided results similar to the main analyses (S2 Table). Relative differences between duplicates were less than 3% for all PFAAs (S3 Table).
Discussion
populations even though we do not expect pregnancy to modify the paired differences in the same woman.
Since we mimicked the DNBC setup as closely as possible, we did not control any of the fac-tors than may be responsible for the observed differences in PFAA concentrations, such as indoor and outdoor temperatures or the exact amount of time in transport. Therefore we are not able to provide information on the mechanisms of the observed differences. Nonetheless, these findings are highly relevant to keep in mind when interpreting results from studies on PFAAs and health or disease outcomes in the DNBC or other cohorts using similar methods.
Some PFAAs were detected with higher and others with lower levels after transport and pro-cessing delay. Overall, lower concentrations were only seen in the samples from the winter, which were transported in cold weather (temperatures below 0˚C were present during that period). For the PFAAs with higher concentrations in transported samples, this observation was present both for samples in summer and winter.
Fig 2. Bland Altman plot for perfluorooctane sulfonate after transformation by the natural logarithm, stratified by season.The first plot represents samples from the winter, while the second plot represents samples from the summer. The average lnPFOS is the average of the natural log-transformed concentrations of perfluorooctane sulfonate (PFOS) in the transported and delayed samples and the immediately processed samples. The difference is the difference between the two natural log-transformed concentrations.
Increased PFAA concentrations with transport and delayed processing may be due to con-version of precursor compounds. However, precursor compounds such as flurotelomer alco-hols and sulfonamides are probably more likely to be metabolized to more stable acids like PFOS and PFOA in vivo than after blood sampling [26]. Evaporation is not likely to play an important role since the caps were closed during transportation. Since we used Teflon-free col-lection tubes, the risk of PFAA release from these was limited. Decreased concentrations may be caused by degradation of PFAAs, but this may not be very likely given the stability of the compounds. Adsorption to collection tubes can occur if polypropylene tubes are used [27]. However, we used polyethylene terephthalate collection tubes. In order to avoid adsorption, polyethylene or glass may be the preferable choice in terms of container material [27]. Binding
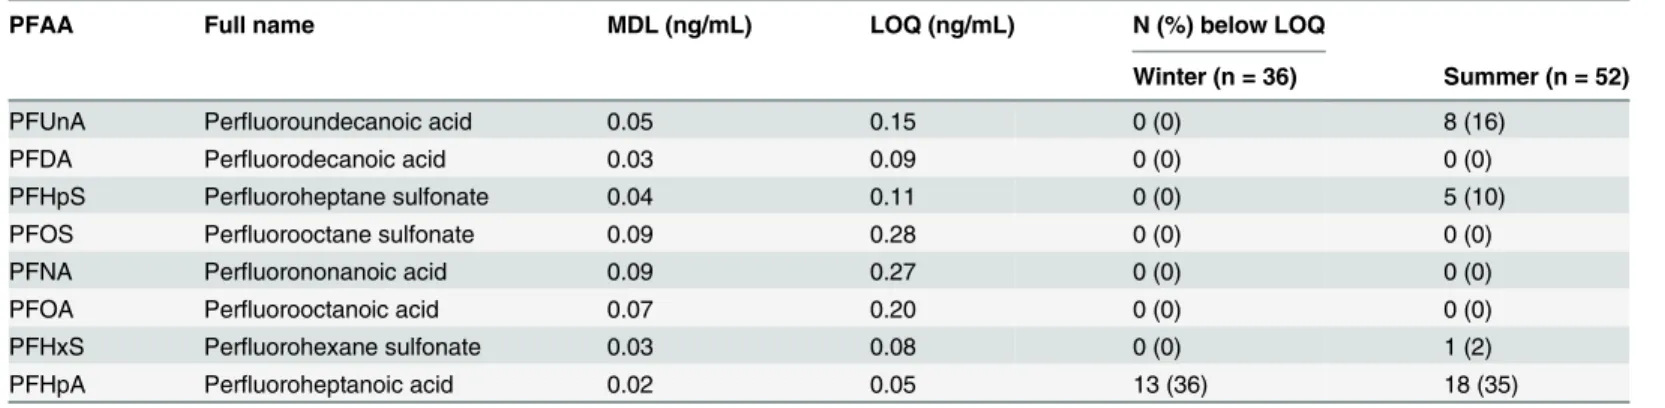
Table 1. Perfluoroalkyl acids abbreviations, method detection limits, and limits of quantification.
PFAA Full name MDL (ng/mL) LOQ (ng/mL) N (%) below LOQ
Winter (n = 36) Summer (n = 52)
PFUnA Perfluoroundecanoic acid 0.05 0.15 0 (0) 8 (16)
PFDA Perfluorodecanoic acid 0.03 0.09 0 (0) 0 (0)
PFHpS Perfluoroheptane sulfonate 0.04 0.11 0 (0) 5 (10)
PFOS Perfluorooctane sulfonate 0.09 0.28 0 (0) 0 (0)
PFNA Perfluorononanoic acid 0.09 0.27 0 (0) 0 (0)
PFOA Perfluorooctanoic acid 0.07 0.20 0 (0) 0 (0)
PFHxS Perfluorohexane sulfonate 0.03 0.08 0 (0) 1 (2)
PFHpA Perfluoroheptanoic acid 0.02 0.05 13 (36) 18 (35)
PFAA: Perfluoroalkyl acid MDL: Method detection limit LOQ: Limit of quantification.
n (%) below the LOQ applies to the immediately processed samples.
doi:10.1371/journal.pone.0137768.t001
Table 2. Relative differences between PFAA concentrations in 88 paired blood samples that were immediately processed or transported with a processing delay, stratified by the season of sampling.
Winter Summer
PFAA Median1(IQR) Median2(IQR) Relative difference (95% CI) Median1(IQR) Median2(IQR) Relative difference (95% CI)
(ng/mL) (ng/mL) (%) (ng/mL) (ng/mL) (%)
PFUnA 1.1 (0.8–1.3) 0.2 (0.2–0.3) -77 (-78, -75) 0.3 (0.2–0.5) 0.3 (0.2–0.5) -7 (-15, 3) PFDA 0.5 (0.4–0.6) 0.3 (0.2–0.4) -39 (-42, -3) 0.3 (0.2–0.4) 0.3 (0.2–0.4) 0 (-5, 5) PFHpS 0.3 (0.2–0.4) 0.2 (0.1–0.3) -41 (-47, -33) 0.2 (0.1–0.3) 0.2 (0.2–0.3) 7 (0, 14) PFOS 20.0 (14.8–26.6) 14.3 (11.2–20.1) -29 (-30, -27) 14.7 (10.8–20.6) 15.3 (11.1–19.8) 2 (-2, 5) PFNA 0.8 (0.7–1.1) 0.7 (0.6–1.0) -5 (-7, -3) 0.7 (0.6–1.0) 0.7 (0.6–1.0) 3 (0, 5) PFOA 2.5 (1.9–3.8) 2.6 (2.0–3.9) 1 (0, 3) 2.5 (1.8–3.4) 2.5 (1.9–3.5) 3 (0, 6) PFHxS 0.6 (0.5–0.7) 0.6 (0.5–0.8) 12 (3, 22) 0.6 (0.4–0.7) 0.6 (0.4–0.8) 11 (3, 19) PFHpA 0.1 (0.0–1.1) 0.1 (0.0–0.2) 38 (12, 70) 0.1 (0.00–0.1) 0.1 (0.0–0.1) 17 (8, 27)
PFAA: Perfluoroalkyl acid IQR: interquartile range
95% confidence interval (95% CI).
SeeTable 1for specific PFAA abbreviations. Medians are not log-transformed.
Median1refers to immediately processed samples. Median2corresponds to samples that were delayed and transported and processing. 36 samples were sampled in the winter, and 52 in the summer.
of PFAAs to proteins, and therefore the measurable free fraction, might differ in unpredictable manners.
We used a validated laboratory method for all analyses, which minimized the risk of mea-surement error. Any meamea-surement error would be non-differential since the laboratory techni-cian, who performed the PFAA analyses, was blinded to conditions prior to analysis, and the sequence of samples was random. Our samples were stored for approximately 8 years at–80°
C, but paired samples were stored for equal amounts of time, and therefore potential measure-ment error due to storage would be non-differential. After initial freezing of the samples we did not thaw them until they were to be analysed.
The 24-hour PFAA stability at room temperature was high in rabbit serum and plasma [28]. Bergeret al. [27] investigated the influence of storage for up to three months on PFAS stability in liquid chromatography-grade water stored in polypropylene containers at 4° C. In particular, long chained PFCAs such as PFUnA decreased in concentration (final recovery was less than 50%). Katoet al. [29] investigated the effects of storage temperature (room temperature, 5, -20 and -70˚C) and storage duration (up to eight months) on the stability of four PFAAs in 16 human serum samples. They found unchanged PFAA concentrations under the studied condi-tions, but they had no information on biospecimen collection, processing, and storage until arrival in their laboratory.
The results of our study should be replicated in other settings and laboratories. In future studies, it would be beneficial to investigate the influence of storage of fresh blood samples for various amounts of time at different temperatures (including temperatures below 0° C) on measured PFAA levels in different human matrices such as plasma, serum, whole blood, and blood cells, preferably using paired samples. The specific factors (such as the average tempera-ture, temperature changes, and duration of transport or delay) and mechanisms behind any differences between the investigated setups should be clarified by use of a larger controlled design. We also encourage studies of dried blood spots on filter paper (this type of storage may potentially affect the stability of PFAAs) as well as cord blood, since results may be different from those presented due to the larger haematocrit and susceptibility to haemolysis in the new-born [30]. Similar studies concerning other chemicals would be of interest since chemicals with other properties, such as lipophilic persistent organic pollutants, may react differently to trans-portation and processing delay.
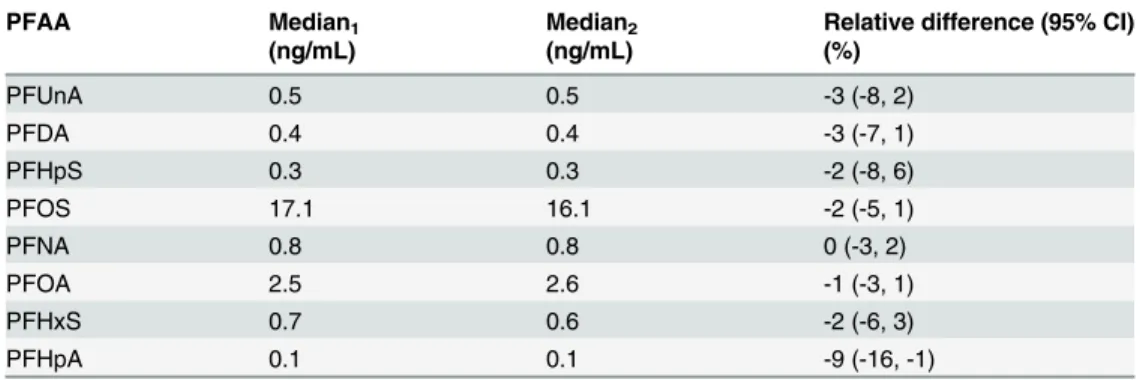
Table 3. Relative differences between PFAA concentrations in 21 paired blood samples that were col-lected during the summer and transported after a processing delay or only had delayed processing without transport.
PFAA Median1 Median2 Relative difference (95% CI)
(ng/mL) (ng/mL) (%)
PFUnA 0.5 0.5 -3 (-8, 2)
PFDA 0.4 0.4 -3 (-7, 1)
PFHpS 0.3 0.3 -2 (-8, 6)
PFOS 17.1 16.1 -2 (-5, 1)
PFNA 0.8 0.8 0 (-3, 2)
PFOA 2.5 2.6 -1 (-3, 1)
PFHxS 0.7 0.6 -2 (-6, 3)
PFHpA 0.1 0.1 -9 (-16, -1)
PFAA: Perfluoroalkyl acid
for specific PFAA abbreviations seeTable 1. Median1refers to delayed and transported samples. Median2 corresponds to samples that were only delayed.
Our findings are relevant to studies that used samples subjected to delays and transport before processing, perhaps in particular in cold weather. According to our results, transporta-tion in cold temperatures before processing may not affect PFOA much, but for PFOS, concen-trations may decrease by approximately 30%. In studies where a delay in processing is
unrelated to the exposure and outcome under study, measurement error may bias effect esti-mates towards null. However, if samples are collected throughout the year in a temperate cli-mate, and the outcome under study is season-dependent, differential measurement error may arise and the estimate may be biased in an unpredictable direction. Adjusting for calendar time of blood drawing may therefore be important for studies where blood samples are not pro-cessed and frozen shortly after blood drawing.
Conclusions
This study illustrates the need to consider the validity of laboratory data in studies where pro-cessing of biospecimens after blood drawing are less than perfect. Our results indicate that con-ditions in the pre-analytical phase may affect the measured concentration of PFAAs. However, these results should be replicated in a larger sample, and more studies are needed in order to determine which factors may be responsible for the observed differences.
Supporting Information
S1 Dataset. Concentrations of perfluoroalkyl acids in 88 plasma samples from pregnant Danish women, 2005.
(XLSX)
S1 Table. Precision for eight perfluoroalkyl acids and bias of the method. (DOCX)
S2 Table. Sensitivity analyses of relative differences between perfluoroalkyl acid concentra-tions in immediately processed samples and samples with processing delay that were trans-ported.
(DOCX)
S3 Table. Relative differences in perfluoroalkyl acid concentrations for 38 duplicate sam-ples from all three setups.
(DOCX)
Acknowledgments
We thank Kirsten A. Zeeberg for drawing and processing the blood samples and Inga Jensen for performing the PFAA analyses. This work is part of the Fetotox project (fetotox.au.dk).
Author Contributions
Conceived and designed the experiments: JF JO EAN. Performed the experiments: JF JO EAN RB. Analyzed the data: CCB TBH BHB EAN JO. Contributed reagents/materials/analysis tools: JF JO EAN RB. Wrote the paper: CCB TBH RB BHB JF JO EAN.
References
2. Environment Canada. Environmental performance agreement (“agreement”) respecting perfluorinated carboxylic acids (PFCAs) and their precursors in perfluorochemical products sold in Canada. Available:
http://www.ec.gc.ca/epe-epa/default.asp?lang=En&n=81AE80CE-1.
3. European Parliament. Directive 2006/122/EC of the European Parliament and of the Council of 12 December 2006. Official Journal of the EU, 27 December 2006, L372/32-L372/34. Available: http://eur-lex.europa.eu/legal-content/EN/TXT/?uri=CELEX:32006L0122.
4. UN Environment Programme. Governments unite to step-up reduction on global DDT reliance and add nine new chemicals under international treaty. Available:http://chm.pops.int/Convention/Pressrelease/ COP4Geneva8May2009/tabid/542/language/en-US/Default.aspx.
5. US Environmental Protection Agency. EPA and 3M announce phase-out of PFOS.http://yosemite.epa. gov/opa/admpress.nsf/0/33aa946e6cb11f35852568e1005246b4.
6. US Environmental Protection Agency. 2010/2015 PFOA Stewardship Program. Available:http://www. epa.gov/opptintr/pfoa/pubs/stewardship.
7. Kantiani L, Llorca M, Sanchís J, Farré M, Barceló D. Emerging food contaminants: a review. Anal Bioa-nal Chem 2010; 398:2413–2427. doi:10.1007/s00216-010-3944-9PMID:20680618
8. Butenhoff JL, Olsen GW, Pfahles-Hutchens A. The applicability of biomonitoring data for perfluoroocta-nesulfonate to the environmental public health continuum. Environ Health Perspect 2006; 114:1776–
1782. PMID:17107867
9. Olsen GW, Burris JM, Ehresman DJ, Froehlich JW, Seacat AM, Butenhoff JL, et al. Half-life of serum elimination of perfluorooctanesulfonate, perfluorohexanesulfonate, and perfluorooctanoate in retired fluorochemical production workers. Environ Health Perspect 2007; 115:1298–1305. PMID:17805419
10. Shoeib M, Harner T, M Webster G, Lee SC. Indoor sources of poly- and perfluorinated compounds (PFCS) in Vancouver, Canada: implications for human exposure. Environ Sci Technol 2011; 45:7999–
8005. doi:10.1021/es103562vPMID:21332198
11. Fei C, McLaughlin JK, Tarone RE, Olsen J. Perfluorinated Chemicals and Fetal Growth: A Study within the Danish National Birth Cohort. Environ Health Perspect 2007; 115:1677–1682. PMID:18008003
12. Ehresman DJ, Froehlich JW, Olsen GW, Chang S-C, Butenhoff JL. Comparison of human whole blood, plasma, and serum matrices for the determination of perfluorooctanesulfonate (PFOS), perfluorooc-tanoate (PFOA), and other fluorochemicals. Environ Res 2007; 103:176–184. PMID:16893538
13. Wu K, Xu X, Peng L, Liu J, Guo Y, Huo X. Association between maternal exposure to perfluorooctanoic acid (PFOA) from electronic waste recycling and neonatal health outcomes. Environ Int 2012; 48:1–8. doi:10.1016/j.envint.2012.06.018PMID:22820015
14. Apelberg BJ, Witter FR, Herbstman JB, Calafat AM, Halden RU, Needham LL, et al. Cord serum con-centrations of perfluorooctane sulfonate (PFOS) and perfluorooctanoate (PFOA) in relation to weight and size at birth. Environ Health Perspect 2007; 115:1670–1676. PMID:18008002
15. Olsen J, Melbye M, Olsen SF, Sørensen TI, Aaby P, Andersen AM, et al. The Danish National Birth
Cohort—its background, structure and aim. Scand J Public Health 2001; 29:300–307. PMID:
11775787
16. Andersen CS, Fei C, Gamborg M, Nohr EA, Sørensen TIA, Olsen J. Prenatal exposures to
perfluori-nated chemicals and anthropometric measures in infancy. Am J Epidemiol 2010; 172:1230–1237. doi:
10.1093/aje/kwq289PMID:20940176
17. Andersen CS, Fei C, Gamborg M, Nohr EA, Sørensen TIA, Olsen J. Prenatal exposures to
perfluori-nated chemicals and anthropometry at 7 years of age. Am J Epidemiol 2013; 178:921–927. doi:10. 1093/aje/kwt057PMID:23825166
18. Fei C, McLaughlin JK, Tarone RE, Olsen J. Fetal growth indicators and perfluorinated chemicals: a study in the Danish National Birth Cohort. Am J Epidemiol 2008; 168:66–72. doi:10.1093/aje/kwn095
PMID:18460444
19. Fei C, McLaughlin JK, Lipworth L, Olsen J. Maternal levels of perfluorinated chemicals and subfecund-ity. Hum Reprod 2009; 24:1200–1205. doi:10.1093/humrep/den490PMID:19176540
20. Fei C, McLaughlin JK, Lipworth L, Olsen J. Maternal concentrations of perfluorooctanesulfonate (PFOS) and perfluorooctanoate (PFOA) and duration of breastfeeding. Scand J Work Environ Health 2010; 36:413–421. PMID:20200757
21. Bach CC, Liew Z, Bech BH, Nohr EA, Fei C, Bonefeld-Jorgensen EC, et al. Perfluoroalkyl acids and time to pregnancy revisited: An update from the Danish National Birth Cohort. Environ Health 2015; 14 (1):59. doi:10.1186/s12940-015-0040-9
23. Bland JM, Altman DG. Statistical methods for assessing agreement between two methods of clinical measurement. Lancet 1986; 1:307–310. PMID:2868172
24. Helsel DR. Less than obvious—statistical treatment of data below the detection limit. Environ Sci Tech-nol 1990; 24:1766–1774.
25. Hornung RW, Reed LD. Estimation of average concentration in the presence of nondetectable values. Appl Occup Environ Hyg 1990; 5:46–51.
26. Nilsson H, Kärrman A, Rotander A, van Bavel B, Lindström G, Westberg H, et al. Biotransformation of fluorotelomer compound to perfluorocarboxylates in humans. Environ Int 2013; 51:8–12; doi:10.1016/ j.envint.2012.09.001PMID:23138016
27. Berger U, Kaiser MA, Kärrman A, Barber JL, van Leeuwen SPJ. Recent Developments in Trace Analy-sis of Poly- and Perfluoroalkyl Substances. Anal Bioanal Chem 2011; 400:1625–35. doi:10.1007/ s00216-011-4823-8PMID:21400077
28. Flaherty JM, Connolly PD, Decker ER, Kennedy SM, Ellefson ME, Reagen WK, et al. Quantitative determination of perfluorooctanoic acid in serum and plasma by liquid chromatography tandem mass spectrometry. J Chromatogr B Analyt Technol Biomed Life Sci 2005; 819:329–338. PMID:15833298
29. Kato K, Wong LY, Basden BJ, Calafat AM. Effect of temperature and duration of storage on the stability of polyfluoroalkyl chemicals in human serum. Chemosphere 2013; 91:115–7. doi:10.1016/j.
chemosphere.2012.11.013PMID:23232044