COMPARISON OF CARBON AND NITROGEN
DETERMINATION METHODS FOR SAMPLES OF
A PALEUDULT SUBJECTED TO NO-TILL
CROPPING SYSTEMS
Jeferson Dieckow1*; João Mielniczuk2; Heike Knicker3; Cimélio Bayer2; Deborah Pinheiro Dick4; Ingrid Kögel-Knabner3
1
UFPR - Depto. de Solos e Engenharia Agrícola, R. dos Funcionários 1540 - 80035-050 - Curitiba, PR - Brasil. 2
UFRGS - Depto. de Solos, C.P. 15100 - 91501-970 - Porto Alegre, RS - Brasil. 3
TUM - Lehrstuhl für Bodenkunde, D-85350 - Freising-Weihenstephan - Germany 4
UFRGS - Depto. de Físico-Química, 90001-970 - Porto Alegre, RS - Brasil. *Corresponding author <[email protected]>
ABSTRACT: Organic carbon (C) concentration evaluated by the Walkley-Black method, and total nitrogen (N) concentration determined by Kjeldahl method, were compared with corresponding results of C and N concentrations obtained through the dry combustion method (Elementar Vario EL analyzer), using samples of ten soil layers down to the depth of 107.5 cm of a kaolinitic Typic Paleudult (220-418 g clay kg-1
along the profile) subjected to no-till cropping systems [fallow bare soil, pigeon pea (Cajanus cajan L. Millsp.) plus maize, and lablab (Lablab purpureum L. Sweet) plus maize]. A close correlation (R2
≥ 0.96) was observed between the C results of the Walkley-Black and dry combustion methods, but a correction was suggested to be applied to C results of Walkley-Black (C = 1.05CW.Black + 0.47). A close correlation (R2 ≥ 0.96) was also found between results of Kjeldahl-N and dry combustion-N, but no correction was necessary to be applied. The relationships between results of Walkley-Black and dry combustion and between results of Kjeldahl and dry combustion did not change among soil samples from different management systems, in disagreement to findings of a previous study where results of analytical C recovery were influenced by samples from different managements, supposedly because changes in lability or recalcitrance of organic matter might have affected the wet combustion reactions. A poor correlation (R2 = 0.42) was found between the C:N ratios based on Walkley-Black and Kjeldahl analysis and the C:N ratios based on dry combustion analysis. The methods for C and N determination did not affect the interpretation of the effects of management systems on soil C and N stocks.
Key words: Walkley-Black, Kjeldahl, wet combustion, dry combustion
COMPARAÇÃO DE MÉTODOS DE DETERMINAÇÃO DE CARBONO E
NITROGÊNIO EM AMOSTRAS DE ARGISSOLO SOB PLANTIO DIRETO
RESUMO: Resultados de concentração de carbono (C), obtidos pelo método Walkley-Black, e resultados de concentração de nitrogênio (N) total, determinados pelo método Kjeldahl, foram comparados com os correspondentes resultados de C e N obtidos pelo método de combustão seca (analisador Elementar Vario EL), utilizando-se amostras de dez camadas de um Argissolo Vermelho até a profundidade de 107.5 cm (220-418 g argila kg-1 ao longo do perifl), manejado em sistemas de culturas de plantio direto [solo descoberto, guandu (Cajanus cajan L. Millsp.) mais milho, e lab lab (Lablab purpureum L. Sweet) mais milho]. Alta correlação (R2 ≥ 0.96) foi observada entre os resultados de C-Walkley-Black e C-combustão seca. Uma correção foi sugerida para os resultados de C-Walkley-Black (C = 1.05CW.Black + 0.47). Elevada correlação (R2 ≥ 0.96) também foi observada entre os resultados de Kjeldahl e N-combustão seca, não sendo necessária a aplicação de uma correção aos resultados de N-Kjeldahl. A relação entre os resultados de Walkley-Black e combustão seca e entre os resultados de Kjeldahl e combustão seca não mudaram entre amostras de solo de diferentes sistemas de manejo, diferindo dos resultados de um trabalho anterior onde a recuperação analítica de C foi influenciada por amostras oriundas de diferentes manejos, supostamente por alterações na labilidade ou recalcitrância da matéria orgânica terem afetado as reações de combustão úmida. Uma baixa correlação (R2 = 0.42) foi observada entre a relação C:N baseada nas análises Walkley-Black e Kjeldahl e a relação C:N baseada na combustão seca. Os métodos de determinação de C e N não afetaram as interpretações do efeito de sistemas de manejo sobre os estoques de C e N no solo.
INTRODUCTION
The reliability of methods for carbon (C) and nitrogen (N) measurements is of fundamental concern in soil organic matter studies because C and N analy-ses constitute the first analytical step towards soil or-ganic matter quantification and characterization. Au-tomated dry combustion methods, although being of easy and simple operation, not requiring excessive amounts of reagents, presenting high accuracy and not having the problem related to chemical waste disposal, are not always feasible for small laboratories due to acquisition costs of the equipment. Thus, in many soil laboratories the conventional Walkley-Black and Kjeldahl methods for C and N analysis, respectively, are still routinely being employed.
Although the C concentration results given by the Walkley-Black rapid dichromate oxidation method are generally lower than those obtained through the ref-erence dry combustion methods (McGeehan & Naylor, 1988; Mikhailova et al., 2003) a high correlation is commonly found between these two methods (Mikhailova et al., 2003; Pérez et al., 2001). To over-come the problem of incomplete C recovery which leads to the underestimation of C concentrations by Walkley-Black method, the analytical results of this technique are corrected by a factor, commonly reported as 1.30 when no external heat is applied (Nelson & Sommers, 1996). A correction factor of 1.63 was pro-posed for a Russian Chernozem (Mikhailova et al., 2003), while a factor of 1.12 was suggested for sub-tropical soils of the State of Rio Grande do Sul, Brazil (Tedesco et al., 1995), but with application of exter-nal heat.
The Kjeldahl method of soil N analysis is be-ing commonly employed in laboratories not equipped with a dry combustion automated analyzer, although more personal labor and reagents are required. In or-ganic soils or soils with high oror-ganic matter contents, the results of N concentration obtained through the Kjeldahl method are generally lower than results of dry combustion (Bremner & Shaw, 1958; Stewart et al., 1963). For mineral soils or soils with low organic mat-ter contents, results have been comparable between these two methods (Bremner & Shaw, 1958; Stewart et al., 1963).
Regarding the influence that soil samples origi-nated from different management systems might have on analytical results of wet combustion or digestion, Diaz-Zorita (1999) showed that C recovery by Walkley-Black method was 15% lower compared to dry com-bustion method in samples of a pasture land in Argen-tina Pampa, while for agricultural land samples, results were comparable among the two methods. This
dif-ference among samples of distinct management sys-tems was attributed to the greater amounts of chemi-cal stable organic compounds in pasture than in crop residues. This influence of samples from different management on C results could not be however con-firmed in a study conducted in a Russian Chernozem (Mikhailova et al., 2003).
The hypothesis of this study is that different analytical methods for soil C and N determinations (dry and wet combustion) provide different C and N con-centration results, and thus corrections to a standard method should be necessary. Therefore, this study compares the results of soil organic C concentration and stock obtained by Walkley-Black method and the results of total N concentration and stock determined by Kjeldahl method with the respective C and N con-centrations and stocks obtained through the automated dry combustion method (Elementar Vario EL analyzer), using samples of a subtropical kaolinitic Typic Paleudult subjected to different no-till cropping systems.
MATERIAL AND METHODS
Soil samples
Soil samples were collected from a long-term experiment (18 years) located in Eldorado do Sul, State of Rio Grande do Sul, Brazil (30°51’ S and 51°38’ W). The soil was a kaolinitic Typic Paleudult, and the cli-mate as humid-subtropical (Cfa, Köppen). Ten soil lay-ers were sampled down to the 107.5-cm depth, in three replicates of three no-till cropping systems: bare soil; pigeon pea (Cajanus cajan L. Millsp.) plus maize (Zea mays L.) [P+M]; and lablab (Lablab purpureum L. Sweet) plus maize [L+M]. The P+M and L+M sys-tems were conducted under two N levels (0 and 180 kg N ha-1 applied to the maize crops). Soil samples
were air dried and ground in a mortar to pass through a 0.50-mm mesh sieve.
The clay fraction of the 0-20 cm layer is con-stituted mainly by kaolinite (720 g kg-1), but contains
also iron oxides (109 g kg-1) and other unidentified
min-erals (Bayer, 1996). An increment in clay content from 221 g kg-1 in the top layer to 418 g kg-1 in the deepest
layer was found, due to the presence of the argillic horizon (Table 1). Soil texture analyses were performed using the hydrometer with a Bouyoucos’ scale, (Gee & Bauder, 1986). More details about the experiment and sampling are given elsewhere (Diekow et al., 2005).
Carbon analyses
exter-nal heat (Tedesco et al., 1995). The heating was pro-vided by swirling the suspension over a Bunsen burner-flame after the addition of H2SO4 and was con-trolled so that the initial temperature of 120°C could rise to 150°C within one minute. Soil samples of about 0.50 g were used, but for some treatments with high C concentration the analysis had to be repeated using 0.25 g.
Dry combustion method (975°C) was per-formed with a Vario EL II analyzer (Elementar Analysensysteme, Hanau, Germany) detecting carbon as CO2. The detection limit for carbon is 0.4 µg. Soil samples of about 30 mg were used. Since no carbon-ate C is present in this Paleudult (Brasil, 1973), the total C is referred as the organic C. Total C stocks were calculated for the 0-27.5 cm layer, after considering the soil bulk density of each layer (Table 2). Soil den-sity down to the 27.5 cm depth was determined as suggested by Bayer (1996), and in no-N treatments,
according to the core method (Blake & Hartage, 1986). For N-fertilized treatments, considered the same bulk density of no-N treatments was considered.
Nitrogen analyses
The Kjeldahl semimicro procedure was based on acid digestion followed by steam distillation of the NH3 formed after addition of alkali (Bremner, 1965). The dry combustion was carried out simultaneously with the C analysis, in the same Vario EL analyzer, which has a detection limit of 1 µg for N. The total N stocks in the 0-27.5 cm layer were calculated according to the same procedure for total C.
Statistical analysis
Data were submitted to analysis of variance to assess the significance of the effects of cropping sys-tems and N fertilization levels on the C and N con-centrations and stocks measured through the differ-ent analytical methods. Analysis of variance (ANOVA) was carried out according to the employed split-plot design, considering the cropping system factor as the main plot and N level as sub-plots. The soil layer fac-tor was not considered in ANOVA. Means were com-pared by using the Tukey test (P = 0.05), and linear regressions were made between results of Walkley-Black and dry combustion, and between Kjeldahl and dry combustion methods. The confidence intervals of the angular and linear coefficients of these regressions were calculated at P < 0.05, across the three experi-mental replicates.
RESULTS AND DISCUSSION
Comparison of methods for C determination
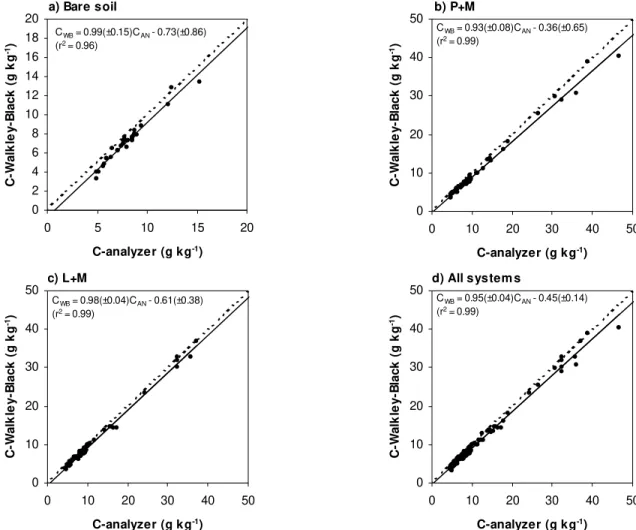
The results of C concentration obtained through the Walkley-Black method correlated well (R2
≥ 0.96) with results of C concentration obtained through dry combustion technique, for soil samples of all cropping systems (Figures 1a, 1b and 1c). The re-gressions found between these two methods were practically the same in the three cropping systems (Fig-ures 1a, 1b and 1c), showing that results of C recov-ery by the Walkley-Black method compared to the ref-erence dry combustion method were not influenced by samples originated from different managements. The Walkley-Black C recovery was also not affected by land use and soil management systems for a Russian Cher-nozem (Mikhailova et al., 2003), but was for a Typic Hapludoll in Argentina Pampa, where the chemical stable compounds of organic matter occurring after the application of some managements has supposedly reduced the Walkley-Black C recovery (Diaz-Zorita, 1999).
r e y a l l i o
S Sand ±s.d. Silt±s.d. Clay±s.d. m
c --- gkg-1----------------
-5 . 2
-0 536 ±20 243±25 221 ±5
5 . 7 -5 .
2 547 ±14 233±21 220 ±8
5 . 7 1 -5 .
7 525 ±9 217±12 258 ±16
5 . 7 2 -5 . 7
1 499 ±23 215±14 287 ±24
5 . 7 3 -5 . 7
2 480 ±34 198±12 322 ±45
5 . 7 4 -5 . 7
3 460 ±23 181±18 359 ±18
5 . 7 5 -5 . 7
4 425 ±20 178±15 398 ±21
5 . 7 6 -5 . 7
5 426 ±27 166±17 408 ±15
5 . 7 8 -5 . 7
6 407 ±24 178±20 415 ±35
5 . 7 0 1 -5 . 7
8 414 ±23 167±20 418 ±39
Table 1 - Average particle-size distribution in the sampled soil layers.
s.d. = standard deviation
r e y a l l i o
S NoN WithN
l i o s e r a
B P+M L+M P+M L+M
m
c --- tm-3-----------------
-5 . 2
-0 1.42 1.44 1.55 1.44 1.55
5 . 7 -5 .
2 1.58 1.65 1.64 1.65 1.64
5 . 7 1 -5 .
7 1.60 1.65 1.64 1.65 1.64
5 . 7 2 -5 . 7
1 1.60 1.65 1.63 1.65 1.63
Table 2 - Soil bulk density within the 27.5 cm layer, determined according to the core method, for treatments of bare soil, pigeon pea plus maize (P+M) and lablab plus maize (L+M) no-till systems, under two nitrogen levels (0 kg N ha-1
– No N, and 180 kg N ha-1 – With N). Original
Since the relationship between Walkley-Black and dry combustion remains the same across samples of different management systems, a general regression was fitted considering all the treatments together (Fig-ure 1d). In most of the samples, C concentration de-termined through Walkley-Black method was lower than that obtained through dry combustion (Figure 1), possibly because of incomplete oxidation of the total organic C in the Walkley-Black procedure (McGeehan & Naylor, 1988; Nelson & Sommers, 1996). By tak-ing the inverse of the linear regression in Figure 1d, a correction equation is thus proposed to be applied on the C concentration results of Walkley-Black: C = 1.05CW.Black + 0.47.
The C concentrations of the two top layers as determined through dry combustion were affected by cropping systems and N fertilization levels, so that higher concentrations were found for soils under P+M
and L+M or N fertilized, compared to the bare soil or soils without N fertilization (Table 3). The same trend was observed for C concentrations as determined by the Walkley-Black procedure, except of a lack of sig-nificance for the difference between fertilized and non-fertilized treatments in the top layer of P+M and in the second layer of L+M systems (Table 3).
The statistical trends for results of C concen-tration between cropping systems and between N fer-tilization levels were comparable for the two meth-ods (Table 3). This was also observed for results of C stocks in the 0-27.5 cm layer, the layer which nearly corresponds to the 0-30 cm depth used in soil C inventory surveys (IPCC, 1996) (Table 4). There-fore, the methods for soil C determinations did not affect the interpretation of the effects of management systems in this kaolinitic Paleudult. This differs from the findings of Diaz-Zorita (1999) and Brye & Slaton
Figure 1 - Relationship between C concentrations obtained by the Walkley-Black method and C concentrations obtained by a dry combustion method (analyzer) in (a) bare soil (n = 30), (b) P+M system (n = 60), (c) L+M system (n = 60) and (d) all systems (n = 150). For P+M and L+M, results of both N levels are included. “CWB” means C-Walkley Black, “CAN” means C-analyzer. The values in parenthesis following the ± signal refer to the confidence interval (P < 0.05) of the angular or linear
coefficient of the regression.
d) All system s
0 10 20 30 40 50
0 10 20 30 40 50
C-analyzer (g kg-1)
C
-W
a
lk
le
y-B
lac
k
(
g
k
g
-1)
CWB = 0.95(±0.04)CAN - 0.45(±0.14) (r2 = 0.99)
c) L+M
0 10 20 30 40 50
0 10 20 30 40 50
C-analyzer (g kg-1)
C
-W
a
lk
le
y-B
lac
k
(
g
k
g
-1)
CWB = 0.98(±0.04)CAN - 0.61(±0.38) (r2 = 0.99)
a) Bare soil
0 2 4 6 8 10 12 14 16 18 20
0 5 10 15 20
C-analyzer (g kg-1)
C
-W
al
k
le
y-B
lack
(
g
k
g
-1)
CWB = 0.99(±0.15)CAN - 0.73(±0.86) (r2 = 0.96)
b) P+M
0 10 20 30 40 50
0 10 20 30 40 50
C-analyzer (g kg-1)
C
-W
a
lk
le
y
-B
la
c
k
(
g
k
g
-1)
(2003), which showed influence of the analytical methodology (Walkley-Black and dry combustion) on the interpretations of their results in different land use systems and crop rotations.
Table 3 - Carbon concentrations in bare soil, pigeon pea plus maize (P+M) and lablab plus maize (L+M) systems as measured by dry combustion and Walkley-Black methods.
aValues in rows followed by the same capital letter do not differ (Tukey test, P = 0.05). This is a comparison between cropping systems. Values in rows followed by the same small letter, in the same cropping system, do not differ (Tukey test, P = 0.05). This is a comparison
between N levels.
r e y a l l i o
S No N WithN
l i o s e r a
B P+M L+M P+M L+M
m
c --- gC kg-1a------------------------------------------
-n o i t s u b m o c y r D 5 . 2
-0 13.3B 32.6Ab 29.6 Ab 37.8a 35.1 a
5 . 7 -5 .
2 8.9B 13.8Ab 14.0 Ab 17.1a 16.5 a
5 . 7 1 -5 .
7 8.2A 9.2Aa 9.6 Aa 10.7a 10.0 a
5 . 7 2 -5 . 7
1 8.6A 9.2Aa 8.7 Ab 9.2a 9.3 a
5 . 7 3 -5 . 7
2 8.4B 9.5Aa 8.8 ABa 9.1a 9.1 a
5 . 7 4 -5 . 7
3 7.8B 9.2Aa 8.4 ABa 8.6a 8.8 a
5 . 7 5 -5 . 7
4 7.2A 8.2Aa 7.8 Aa 8.7a 8.2 a
5 . 7 6 -5 . 7
5 6.3A 7.8Aa 7.5 Aa 8.0a 7.5 a
5 . 7 8 -5 . 7
6 5.8A 6.6Aa 5.8 Aa 6.0a 6.2 a
5 . 7 0 1 -5 . 7
8 5.0A 5.0Aa 4.9 Aa 5.1a 5.1 a
k c a l B -y e l k l a W 5 . 2
-0 12.4B 31.2Aa 28.8 Ab 33.6a 33.8 a
5 . 7 -5 .
2 8.3B 12.6Ab 13.2 Aa 15.9a 14.4 a
5 . 7 1 -5 .
7 7.5A 8.4Aa 9.1 Aa 9.6a 9.4 a
5 . 7 2 -5 . 7
1 7.7A 8.0Aa 7.9 Aa 8.1a 8.5 a
5 . 7 3 -5 . 7
2 7.5A 8.1Aa 7.9 Aa 7.8a 8.2 a
5 . 7 4 -5 . 7
3 7.1A 8.2Aa 7.6 Aa 7.6a 7.9 a
5 . 7 5 -5 . 7
4 6.4A 7.1Aa 7.2 Aa 7.4a 7.5 a
5 . 7 6 -5 . 7
5 5.8B 6.9Aa 6.5 ABa 7.1a 6.8 a
5 . 7 8 -5 . 7
6 4.9A 5.7Aa 5.2 Aa 5.2a 5.5 a
5 . 7 0 1 -5 . 7
8 3.8A 4.4Aa 4.2 Aa 4.3a 4.7 a
d o h t e
M NoN WithN
l i o s e r a
B P+M L+M P+M L+M
a h C t
-- -1a-------------
-n o i t s u b m o c y r
D 39B 54Aa 53Aa 61a 59a
k c a l B -y e l k l a
W 35B 49 Aa 50Aa 54a 54a
Table 4 - Carbon stocks in the 0-27.5 cm layer of bare soil, pigeon pea+maize (P+M) and lablab+maize (L+M) systems as measured by dry combustion and Walkley-Black methods.
aValues in rows followed by the same capital letter do not differ (Tukey test, P = 0.05). This is a comparison between cropping
systems. Values in rows followed by the same small letter, in the same cropping system, do not differ (Tukey test, P = 0.05).
This is a comparison between N levels.
Comparison of methods for N determination
Nitrogen concentrations obtained by dry combustion were highly correlated (R2
≥ 0.96) to those of the Kjeldahl method (Figure 2) and the regressions between them were very similar for the three cropping systems (Figures 2a, 2b and 2c). There was, however, a tendency of the re-sults from Kjeldahl to become closer to those ob-tained by dry combustion, for the L+M system (Fig-ure 2c).
combustion could be related to a non quantitatively release of some refractory N, or of N in N-O struc-tures of NO3- (McGeehan & Naylor, 1988; Bremner,
1965).
Similar to C, the N concentrations in the two top layers as assessed by dry combustion were significantly higher for the P+M and L+M systems as compared to bare soil, and for fertilized soils than non fertilized treatments (Table 5). About the same statistical trend was observed for results of the Kjeldahl method, except for the top layer of P+M and the second layer of L+M, where no differences were observed between fertilized and non-fertilized treat-ments (Table 5). In a general view, the statistical trends observed for the results of N concentration are relatively similar, either for dry combustion or Kjeldahl (Table 5). Similar statistical trends of the two methods were also observed for the results of total N stocks in the 0-27.5 cm layer (Table 6). This
Figure 2 - Relationship between total N concentrations obtained by the Kjeldahl semimicro method and the dry combustion method (analyzer) in (a) bare soil (n = 30), (b) P+M system (n = 60), (c) L+M system (n = 60) and (d) all systems (n = 150). For P+M and L+M, results of both N levels are included. “NKJ” means N-Kjeldahl, “NAN” means N-analyzer. The values in parenthesis following the ± signal refer to the confidence interval (P < 0.05) of the angular or linear coefficient of the
regression.
a) Bare soil
0 0.5 1 1.5
0 0.5 1 1.5
N-analyzer (g kg-1)
N
-K
je
lda
hl
(
g k
g
-1)
NKJ = 0.96(±0.16)NAN - 0.02(±0.12) (r2 = 0.96)
b) P+M
0 1 2 3 4
0 1 2 3 4
N-analyzer (g kg-1)
N
-K
je
lda
hl
(g
k
g
-1)
NKJ = 0.92(±0.06)NAN - 0.02(±0.06) (r2 = 0.99)
c) L+M
0 1 2 3 4
0 1 2 3 4
N-analyzer (g kg-1)
N
-K
je
lda
hl
(
g k
g
-1)
NKJ = 0.99(±0.03)NAN - 0.01(±0.04) (r2 = 0.99)
d) All system s
0 1 2 3 4
0 1 2 3 4
N-analyzer (g kg-1)
N
-K
je
lda
hl
(g
k
g
-1)
NKJ = 0.96(±0.05)NAN - 0.003(±0.05) (r2 = 0.99)
means that the interpretations of the effect of soil management on the N concentrations and stocks, as well as the conclusions drawn from these interpre-tations, are comparable irrespective if analysis were performed through dry combustion or Kjeldahl method.
C:N ratios
One of the basic information in soil organic matter characterization studies is the C:N ratio. There was a poor correlation (R2 = 0.42) between the C:N
analy-sis in Rio Grande do Sul (Tedesco et al., 1995) (Fig-ure 3c). This poor correlation for the C:N ratio as compared to the high correlations for C and N may be a result from the division operation to obtain C:N
r e y a l l i o
S NoN WithN
l i o s e r a
B P+M L+M P+M L+M
m
c --- gkg-1a------------------------------------------
-n o i t s u b m o c y r D 5 . 2
-0 1.20 B 2.61 Ab 2.63Ab 3.04a 3.14a
5 . 7 -5 .
2 0.84 B 1.28 ABb 1.36Ab 1.54a 1.56a
5 . 7 1 -5 .
7 0.73 A 0.89 Aa 0.91Aa 0.98a 0.94a
5 . 7 2 -5 . 7
1 0.68 A 0.81 Aa 0.76Aa 0.81a 0.84a
5 . 7 3 -5 . 7
2 0.65 A 0.76 Aa 0.69Aa 0.74a 0.69a
5 . 7 4 -5 . 7
3 0.61 B 0.72 Aa 0.65ABa 0.68a 0.68a
5 . 7 5 -5 . 7
4 0.61 AB 0.67 Aa 0.59Ba 0.69a 0.64a
5 . 7 6 -5 . 7
5 0.54 A 0.65 Aa 0.59Aa 0.67a 0.62a
5 . 7 8 -5 . 7
6 0.52 A 0.59 Aa 0.49Aa 0.54a 0.54a
5 . 7 0 1 -5 . 7
8 0.50 A 0.50 Aa 0.44Aa 0.50a 0.48a
l h a d l e j K 5 . 2
-0 1.15 B 2.50 Aa 2.67Ab 2.74a 3.08a
5 . 7 -5 .
2 0.78 B 1.24 Ab 1.33Aa 1.52a 1.45a
5 . 7 1 -5 .
7 0.65 B 0.88 Aa 0.92Aa 0.96a 0.92a
5 . 7 2 -5 . 7
1 0.61 A 0.70 Aa 0.71Aa 0.77a 0.78b
5 . 7 3 -5 . 7
2 0.60 A 0.70 Aa 0.70Aa 0.71a 0.72a
5 . 7 4 -5 . 7
3 0.58 A 0.66 Aa 0.64Aa 0.65a 0.66a
5 . 7 5 -5 . 7
4 0.56 A 0.61 Aa 0.59Aa 0.62a 0.62a
5 . 7 6 -5 . 7
5 0.50 B 0.58 Aa 0.56ABa 0.58a 0.57a
5 . 7 8 -5 . 7
6 0.48 A 0.53 Aa 0.49Aa 0.54a 0.50a
5 . 7 0 1 -5 . 7
8 0.44 A 0.46 Aa 0.43Aa 0.43a 0.48a
Table 5 - Total nitrogen concentration in bare soil, pigeon pea plus maize (P+M) and lablab plus maize (L+M) samples as measured by dry combustion and Kjeldahl.
aValues in rows followed by the same capital letter do not differ (Tukey test, P = 0.05). This is a comparison between cropping systems. Values in rows followed by the same small letter, in the same cropping system, do not differ (Tukey test, P = 0.05). This is a comparison between N levels.
d o h t e
M NoN WithN
l i o s e r a
B P+M L+M P+M L+M
a h N t
-- -1a--------------
-n o i t s u b m o c y r
D 3.3B 4.8Aa 4.9 Aa 5.3a 5.4a
l h a d l e j
K 3.0B 4.5Aa 4.8Aa 5.1a 5.2a
Table 6 - Nitrogen stocks in the 0-27.5 cm layer of bare soil, pigeon pea plus maize (P+M) and lablab plus maize (L+M) systems as measured by dry combustion and Kjeldahl methods.
aValues in rows followed by the same capital letter, in the same N level, do not differ (Tukey test, P = 0.05). This is a comparison
between cropping systems. Values in rows followed by the same small letter, in the same cropping system, do not differ (Tukey test, P = 0.05). This is a comparison between N levels.
values, which possibly amplifies the distortions be-tween the two methods.
Figure 3 - Relationships between the C:N ratio values obtained by the Walkley-Black and Kjeldahl methods and the C:N ratio values obtained by dry combustion, considering (a) the non-corrected Walkley-Black C and the Kjeldahl N, (b) the corrected Walkley-Black C (C = 1.053CW.Black + 0,470) and the Kjeldahl N, and (c) the corrected Walkley-Black C using the factor 1.12 suggested by Tedesco et al. (1995) for soils of Rio Grande do Sul and the Kjeldahl N (n = 150). “C:Nwet” means C:N ratio calculated from Walkley-Black and Kjeldahl, “C:NAN” means C:N-analyzer. The values in parenthesis following the ± signal refer to the confidence interval (P < 0.05) of the angular or linear coefficient of the regression.
CONCLUSIONS
The C concentration determined by Walkley-Black and the N concentration determined by Kjeldahl methods obtained for this kaolinitic Paleudult profile highly correlate to the respective results of C and N concentrations determined through the automated dry combustion method (Elementar Vario EL), and, the correction equation (C = 1.05CW.Black + 0.47) is suggested to be applied on re-sults of C obtained by Walkley-Black. The rere-sults of N obtained by Kjeldahl methods did not need correc-tion.
The methods for C and N determination did not affect the interpretation of the effects of manage-ment systems on soil C and N stocks, indicating
7 8 9 10 11 12 13 14 15
7 9 11 13 15
C:N-analyzer
C
:N-W
a
lk
le
y
-Bl
a
c
k
:
Kj
e
ld
a
h
l
a) Non-corrected Walkley-Black-C and Kjeldahl-N
C:Nwet = 0.70(±0.11)C:NAN + 2.86(±1.75) (r2 = 0.42)
7 8 9 10 11 12 13 14 15
7 9 11 13 15
C:N-analyzer
C
-W
a
lk
le
y-B
lac
k
(
g
k
g
-1)
b) Corrected Walkley-Black-C and Kjeldahl-N
C:Nwet = 0.75(±0.16)C:NAN + 3.51(±2.43) (r2 = 0.42)
7 8 9 10 11 12 13 14 15
7 9 11 13 15
C:N-analyzer
C
:N-W
a
lk
le
y
-Bl
a
c
k
:
K
je
ld
a
h
l
c) Corrected Walkley-Black-C (f=1.12) and Kjeldahl-N (Tedesco et al., 1995)
C:Nwet = 0.79(±0.12)C:NAN + 3.18(±1.94) (r2 = 0.42)
that both methodological approaches provide compa-rable conclusions in soil organic matter studies in dif-ferent management systems.
The C:N ratio results obtained after Walkley-Black and Kjeldahl methods have a poor correlation to results obtained after dry combustion technique. Pos-sibly the deviations between results of Walkley-Black C and dry combustion C and the deviations between results of Kjeldahl N and dry combustion N were mag-nified after the calculation of C:N ratios.
ACKNOWLEDGEMENTS
DAAD are acknowledged for supporting the Probral project, in the framework of which this study was car-ried out. To FAPERGS, for financial support in the framework of the project PRONEX.
REFERENCES
BAYER, C. Dynamics of soil organic matter in management systems. Porto Alegre: UFRGS, 1996. 241p. (Thesis Ph.D.). BLAKE, G.R.; HARTAGE, K.H. Bulk density. In: KLUTE, A. (Ed.).
Methods of soil analysis. Part 1. Physical and mineralogical methods. Madison: SSSA, 1986. p.363-375.
BRASIL. Ministério da Agricultura. Levantamento de reconhecimento dos solos do Rio Grande do Sul. Recife: Convênio MA/DPP – SA/DRNR, 1973. 431p.
BREMNER, J.M. Organic forms of nitrogen. In: BLACK, C.A. (Ed.). Methods of soils analysis. Part 2. Chemical and microbiological properties. Madison: SSSA, 1965. p.1238-1255. BREMNER, J.M.; SHAW, K. Denitrification in soil. I. Methods of investigation. Journal of Agricultural Science, v.51, p.22-39, 1958.
BRYE, K.R.; SLATON, N.A. Carbon and nitrogen storage in a Typic Albaqualf as affected by assessment method. Communications in Soil Science and Plant Analysis, v.34, p.1637-1655, 2003.
DIAZ-ZORITA, M. Soil organic carbon recovery by the Walkley-Black method in a Typical Hapludoll. Communications in Soil Science and Plant Analysis, v.30, p.739-745, 1999. DIEKOW, J.; MIELNICZUK, J.; KNICKER, H.; BAYER, C.; DICK,
D.P.; KÖGEL-KNABNER, I. Soil C and N stocks as affected by cropping systems and nitrogen fertilization in a southern Brazil Acrisol managed under no-tillage for 17 years. Soil and Tillage Research, v.81, p.87-95, 2005.
GEE, G.W.; BAUDER, J.W. Particle-size analysis. In: KLUTE, A. (Ed.). Methods of soil analysis. Part 1. Physical and mineralogical methods. Madison: SSSA, 1986. p.383-411. INTERGOVERNMENTAL PANEL ON CLIMATE CHANGE
-IPCC. Revised 1996 IPCC Guidelines for National Greenhouse Gas Inventories: The workbook. Geneva: IPCC, 1996.
McGEEHAN, S.L.; NAYLOR, D.V. Automated instrumental analysis of carbon and nitrogen in plant and soil samples. Communications in Soil Science and Plant Analysis, v.19, p.493-505, 1988.
MIKHAILOVA, E.A.; NOBLE, R.R.P.; POST, C.J. Comparison of soil organic carbon recovery by Walkley-Black and dry combustion methods in the Russian Chernozem. Communications in Soil Science and Plant Analysis, v.34, p.1853-1860, 2003.
NELSON, P.W.; SOMMERS, C. E. Total C, organic C and organic matter. In: PAGE, A.L. (Ed.). Methods of soil analysis. Part 2. Chemical methods. Madison: SSSA, 1996. p.539-579. PÉREZ, D.V.; ALCANTARA, S.; ARRUDA, R.J.; MENEGHELLI,
N.A. Comparing two methods for soil carbon and nitrogen determination using selected Brazilian soils. Communications in Soil Science and Plant Analysis, v.32, p.295-309, 2001. STEWART, B.A.; PORTER, L.K.; CLARK, F.E. The reliability of a micro-dumas procedure for determining total nitrogen in soil. Soil Science Society of America Proceedings, v.27, p.377-380, 1963.
TEDESCO, M.J.; GIANELLO, C.; BISSANI, C.A.; BOHNEN, H.; VOLKWEISS, S.J. Análise de solo, plantas e outros materiais. 2.ed. Porto Alegre: UFRGS, 1995. 174p.