Virulence Factors Using Cross-Species Genetic
Interaction Profiling
Jessica C. S. Brown, Hiten D. Madhani*
Department of Biochemistry and Biophysics, University of California San Francisco, San Francisco, California, United States of America
Abstract
In many human fungal pathogens, genes required for disease remain largely unannotated, limiting the impact of virulence gene discovery efforts. We tested the utility of a cross-species genetic interaction profiling approach to obtain clues to the molecular function of unannotated pathogenicity factors in the human pathogenCryptococcus neoformans. This approach involves expression ofC. neoformans genes of interest in each member of the Saccharomyces cerevisiaegene deletion library, quantification of their impact on growth, and calculation of the cross-species genetic interaction profiles. To develop functional predictions, we computed and analyzed the correlations of these profiles with existing genetic interaction profiles ofS. cerevisiaedeletion mutants. ForC. neoformans LIV7, which has noS. cerevisiaeortholog, this profiling approach predicted an unanticipated role in the Golgi apparatus. Validation studies inC. neoformansdemonstrated that Liv7 is a functional Golgi factor where it promotes the suppression of the exposure of a specific immunostimulatory molecule, mannose, on the cell surface, thereby inhibiting phagocytosis. The genetic interaction profile of another pathogenicity gene that lacks anS. cerevisiaeortholog,LIV6, strongly predicted a role in endosome function. This prediction was also supported by studies of the correspondingC. neoformansnull mutant. Our results demonstrate the utility of quantitative cross-species genetic interaction profiling for the functional annotation of fungal pathogenicity proteins of unknown function including, surprisingly, those that are not conserved in sequence across fungi.
Citation:Brown JCS, Madhani HD (2012) Approaching the Functional Annotation of Fungal Virulence Factors Using Cross-Species Genetic Interaction Profiling. PLoS Genet 8(12): e1003168. doi:10.1371/journal.pgen.1003168
Editor:Gregory P. Copenhaver, The University of North Carolina at Chapel Hill, United States of America
ReceivedAugust 22, 2012;AcceptedOctober 29, 2012;PublishedDecember 2 , 2012
Copyright:ß2012 Brown, Madhani. This is an open-access article distributed under the terms of the Creative Commons Attribution License, which permits unrestricted use, distribution, and reproduction in any medium, provided the original author and source are credited.
Funding:This research was supported by a grant from the NIH to HDM. (R01AI096869). JCSB was supported by an NIH T32 grant to the UCSF Program in Microbial Pathogenesis. The funders had no role in study design, data collection and analysis, decision to publish, or preparation of the manuscript.
Competing Interests:The authors have declared that no competing interests exist. * E-mail: [email protected]
Introduction
Diseases produced by fungal infections are challenging to diagnose and treat, making these infections a major cause of morbidity and mortality worldwide [1,2]. Genetics and genomics have led to the identification of numerous pathogen genes required for replication in the mammalian host [3–7]. Unfortu-nately, many, if not most, identified virulence genes lackin vitro phenotypes that could explain their effects in the host [3–8], and the predicted protein sequences often offer few clues to function. Thus, our power to identify pathogen genes required for disease far outstrips our ability to understand their molecular function in the host.
Historically, the expression of human genes in the model yeasts Saccharomyces cerevisiaeandSchizosaccharomyces pombehas been used as a tool to identify specific genes and to determine their cellular function [9–14]. In a classic example, complementation of a fission yeastcdc2mutant was used to identify human Cdk1 [11]. More recently, a number of groups have combined the expression of foreign genes with high-throughout tools available inS. cerevisiaeto identify suppressor genes to obtain insights into the function of human proteins, ranging from those involved in neurodegenera-tion to cancer [9,11,14].
Likewise, expression of viral and bacterial proteins in yeast,
informative. For example, the genes responsible for biosynthesis of the eEF2 modification diphthamide were identified in selections for resistance to the F2 fragment of diphtheria toxin [15]. Identification ofS. cerevisiaegene deletion mutants hypersensitive to the expression of the Shigella virulence factor OspF, a type III secretion substrate, coupled with transcriptional profiling exper-iments, led to the identification of the cell wall integrity MAP kinase pathway as a likely target of OspF in yeast [10,13]. Importantly, the latter study took advantage of phenotypic information for yeast deletion mutants available at that time to obtain clues to gene function [10].
based on the analysis of ,5.4 million gene pairs. Such a comprehensive genetic interaction dataset has only been described to date for the model yeastS. cerevisiae[19].
Below we test the utility a cross-species genetic interaction approach for fungal pathogen gene annotation that combines expression of pathogen genes in S. cerevisiae with genetic interaction profiling. We used genes from the human pathogen Cryptococcus neoformans, an opportunistic basidiomycete fungal pathogen that is very distantly related to the model yeasts S. cerevisiaeandS. pombe. C. neoformansis the most common cause of fungal meningitis in humans, and among the most important causes of morbidity and mortality in AIDS patients, leading to ,1 million infections and ,600,000 deaths annually in sub-Saharan African alone [1]. Our laboratory previously generated a library of 1201 gene deletion strains and used a signature-tagged mutagenesis approach to identify genes required for pathogen fitness during experimental infection of mice [5]. In addition to identifying new genes required for the synthesis of known virulence factors, these studies identified several dozen genes required for virulence whose mutation failed to yield in vitro phenotypes that could explain its role in the host.
As a proof-of-principle, we expressed sixC. neoformansgenes of interest in each member of the S. cerevisiae deletion library and quantified their impact on fitness, thereby producing cross-species genetic interaction profiles. We exploited their similarities to existing S. cerevisiae knockout genetic profiles to predict possible functions for each C. neoformans protein. For two of these C. neoformans proteins, Liv6 and Liv7, we describe validation experiments that support the functional assignment. For Liv7, additional experiments connect its newly identified function to the evasion of phagocytosis, an important virulence trait. The cross-species genetic interaction profiling approach described here offers a generalizable avenue toward the functional annotation of pathogenicity factors of fungal agents of infectious disease.
Results
Cross-species genetic interaction approach
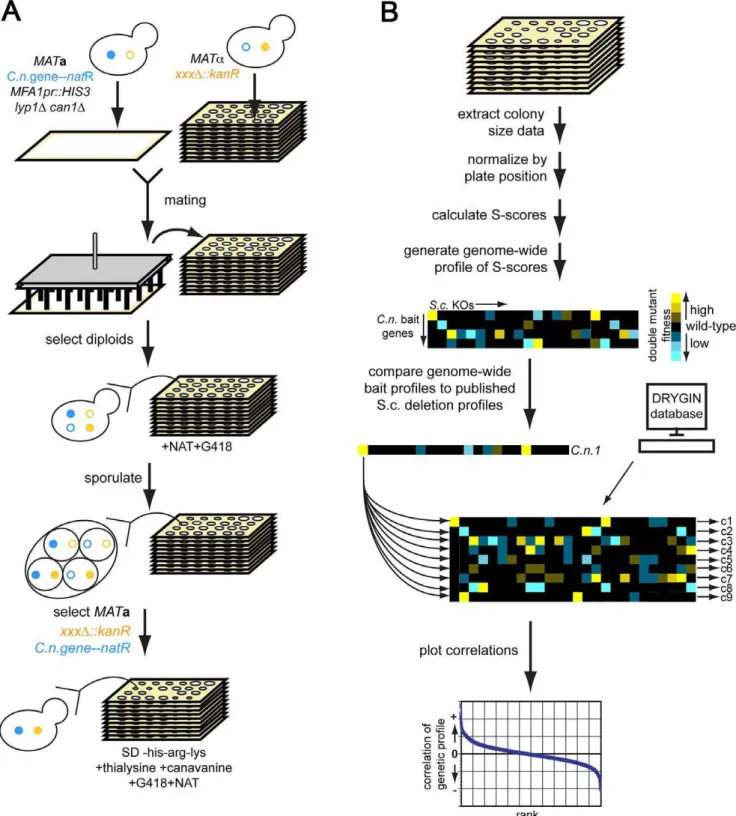
We sought to develop a generic approach for developing testable hypotheses for the function of novelC. neoformansvirulence genes by taking advantage of the methods and datasets that exist in S. cerevisiae. We createdS. cerevisiaestrains that each expressed aC. neoformansgene of interest (described further below). We crossed these to theS. cerevisiaegene deletion library using automated SGA methods and measured fitness of the progeny strains using high-throughput colony imaging methods [16,17] (Figure 1). Measure-ments (n = 8 per double mutant) were converted into significance scores (S-scores) [20] (See Methods). We refer to these data as a ‘‘cross-species genetic interaction profile’’ which is the set of quantitative genetic interactions between strains expressing a particularC. neoformansgene and eachS. cerevisiaedeletion mutant. We calculated correlations between these cross-species profiles and the available genetic interaction profiles of deletion mutants inS. cerevisiae[21]. We reasoned that the expression of aC. neoformans gene could, in some cases, produce dominant-negative effect and produce genetic interaction profiles that correlate positively with those ofS. cerevisiaegene deletions that function in the homologous pathway. Alternatively, the expression C. neoformans gene might have a dominant-positive effect, producing a profile that anti-correlates with those ofS. cerevisiaedeletions mutants in the same pathway. Scenarios on which both behaviors occurred could also be imagined. We further expected that the expression of some, but not all, ofC. neoformans genes would produce profiles that would allow us to develop experimentally testable hypothesis for gene function.
We focused on sixC. neoformansgenes (Figure 2 and Table S1), four of which (LIV5,LIV6,LIV7, andLIV13) our previously work identified as necessary for growth in a murine infection model [5]. Two others,BLP1andMEP1, are targets of Gat201 [22], a master transcriptional regulator of virulence [5,22]. Blp1 is important for C. neoformansto evade phagocytosis by macrophages. Four of these genes (LIV6, LIV7, MEP1, and BLP1) lack S. cerevisiae orthologs. Several contain conserved domains identified by BLAST [23], but the function of these domains are poorly understood (Figure 2 and Table S1). The application of PHYRE, a threading-based structure prediction algorithm, provided information for only Liv6, which it predicts to be structurally related to a lectin [24].
We generated cross-species genetic interaction profiles usingS. cerevisiae strains carrying two control constructs and six different bait constructs: pGPD (promoter-only control), pGPD-GFP (non-specific protein control), pGPD-LIV5, pGPD-LIV6, pGPD-LIV7, pGPD-LIV13, pGPD-MEP1, and pGPD-BLP1. To ensure reason-able expression levels (see Materials and Methods) used the strong GPD1promoter because theC. neoformansgenome is GC-rich [25] compared toS. cerevisiae[26], which is anticipated to inhibit protein translational efficiency due to differences in codon usage and an increased propensity to form inhibitor RNA structures [27]. We calculated Pearson correlations (correlation score) to compare cross-species genetic interaction profiles with the previously described genetic interaction profiles of produced by crosses of 171263885S. cerevisiaegene deletions [19]. To avoid potentially spurious correlations, we filtered out correlations withS. cerevisiae deletions whose profiles yielded significant correlations with either of the two control baits. Significance testing revealed that correlations with a value of greater than 0.08 are highly significant (P,0.001, two-tailed test, Bonferroni-corrected for multiple hypothesis testing). Quantile-quantile plots of the correlations with S. cerevisiae deletions versus standard normal quantiles revealed outliers on one or both tails for all baits (Figure S1). Author Summary
Figure 1. Cross-species genetic interaction mapping to predict the function ofC. neoformansgenes necessary for murine infection.
We focused on correlations that departed from the mean by at least three standard deviations (|Z|.3). This conservative strategy yielded from 2–15 hits, depending on the bait (Table 1). The profile ofLIV7displays the largest number hits, and their identities strongly points to a role in Golgi transport, a prediction whose validation via experiments inC. neoformansis described below. The LIV6 profile correlates positively and negatively with two S. cerevisiae genetic profiles, those of deletions inSYN8and ECM21, respectively. Strikingly, both genes play a role in endosome transport and/or fusion [28,29], predicting a role for Liv6 in these processes in C. neoformans. Support for this prediction via experiments inC. neoformansis also described in this paper. Several other profile hits were obtained, but have yet to validated. The Liv5 profile correlates with those of deletions affecting the cell cycle and autophagy [30–32] and the Liv13 profile negatively correlates with the genetic profiles of knockouts involved in alleviating protein folding stress [33–35]. The profile of theMEP1 metalloprotease correlates with that of a knockout in aS. cerevisiae metalloprotease of a different family,YBR075W [23], as well as proteins involved in nucleotide and RNA metabolism. Finally, the genetic interaction profile of theS. cerevisiaestrain expressing Blp1 positively correlates with that of the deletion of anS. cerevisiaegene, ETR1, that has a role in fatty acid synthesis. This observation may be related to the Rare Lipoprotein A (RlpA) domain prediction for Blp1 (Table S1).
LIV7 cross-species genetic interaction profile suggests a role in Golgi transport
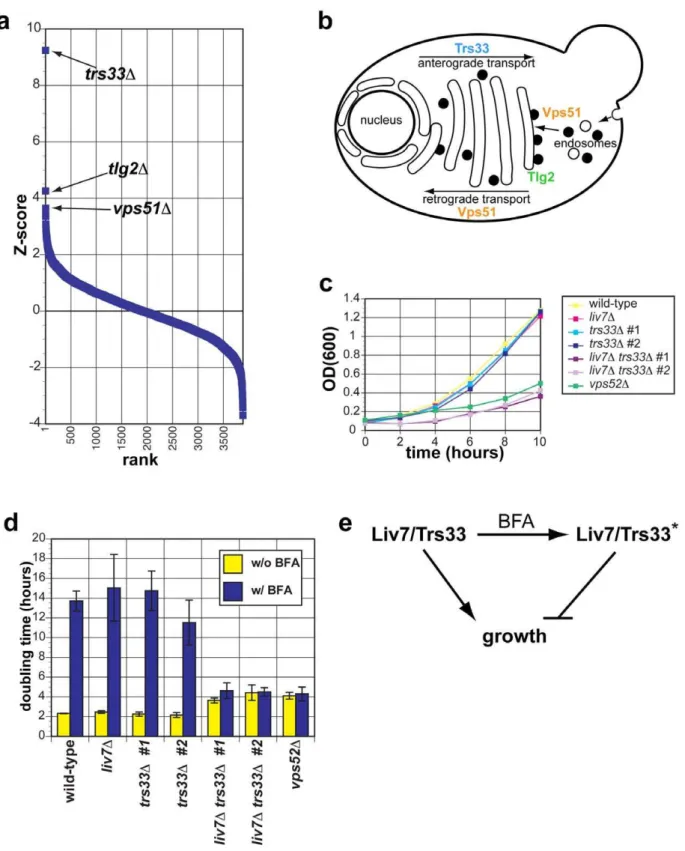
Liv7 (Figure 2) is a 330-residue protein that contains a DUF3752 domain, which is annotated as a conserved domain of unknown function [36]. The profile of the S. cerevisiae strain expressingLIV7displays the strongest three positive correlations with the published genetic interaction profiles ofS. cerevisiaegene deletionstrs33D,tlg2D, andvps51D(Figure 3A). Strikingly, all three of these genes function in transport events that involve the Golgi apparatus (Figure 3B). Trs33 is one of two nonessential subunits of the TRAPP complex, an essential vesicle tethering complex involved in ER-to-Golgi transport [37]. Vps51 is a member of the GARP complex, another vesicle tethering complex that promotes endosome-to-Golgi transport and retrograde transport within the Golgi [38]. Tlg2 is a t-SNARE that is important vesicle fusion within the Golgi [39]. These data make a strong prediction that the function of the unannotated Liv7 protein is in transport events involving the Golgi apparatus. Below we describe experiments in C. neoformansthat support this prediction and additional follow-up experiments that led us to find that the Liv7 protein is required for
the suppression mannose exposure on the cell surface and the suppression of mannose-dependent phagocytosis by mammalian macrophages.
LIV7andTRS33interact genetically inC. neoformans Given that Trs33 is a nonessential subunit of TRAPP, we anticipated that if Liv7 functions to promote TRAPP function in C. neoformans, that its gene deletion mutation should display a synthetic lethal or synthetic sick phenotype with a deletion of TRS33inC. neoformans. We tested this prediction by creating single and double targeted knockouts ofLIV7and an ortholog ofTRS33 we identified in theC. neoformansgenome. We found that wild-type, liv7D, andtrs33Dstrains all grow at approximately the same rate, with a doubling time of two hours (Figure 3C. In contrast, the liv7Dtrs33Ddouble mutant cells display a severe growth defect, having a doubling time of four hours (Figure 3C). These data demonstrate that LIV7 and TRS33 interact genetically in C. neoformans, as inferred from analysis of the cross-species genetic interaction profiles described above. We also constructed a deletion in the gene coding for a member of the C. neoformans GARP complex, Vps52 (we were unable to delete theC. neoformans VPS51 gene), and found that it displayed a growth phenotype similar to that of theliv7Dtrs33Ddouble mutant.
Liv7 and Trs33 act redundantly in ER–Golgi function inC. neoformans
We next tested the hypothesis thatLIV7functions in the ER-Golgi system by using a chemical biology approach that takes advantage of the small molecule Brefeldin A (BFA). BFA is a fungal secondary metabolite that inhibits eukaryotic Sec7-family guanine nucleotide exchange factors that are involved in vesicle transport and themselves localize to the membranes of the ER and Golgi apparatus [40–42]. BFA blocks anterograde transport from the ER to the Golgi, fusion of ER and Golgi compartments, and loss of Golgi apparatus itself [40,41]. We grew strains with and without a growth-inhibitory, sublethal concentration (40mg/ml) of BFA (Figure 3D). Wild-type, liv7D, and trs33D show identical responses to BFA: a sharp increase in doubling time from two hours to over 12 hours (p#0.01) (Figure 3D).liv7Dtrs33Dmutants, which already exhibit slow growth (p#0.01), do not show any further increase in their four-hour doubling time. The resistance to BFA exhibited byliv7Dtrs33Ddouble mutants demonstrates that either Liv7 or Trs33 function is required for BFA to inhibit cell growth (Figure 3D). These data could be explained if Liv7 and Trs33 have a severe defect in the assembly and/or function of the Golgi apparatus (which we show to be the case below). In this or the GFP control was$1.96 (p = 0.05). We also filtered out hits whose ratios ofC. neoformansgene correlation score/control correlation score (either vector or GFP) was between 0.95 and 1.05 (,60 profiles).
doi:10.1371/journal.pgen.1003168.g001
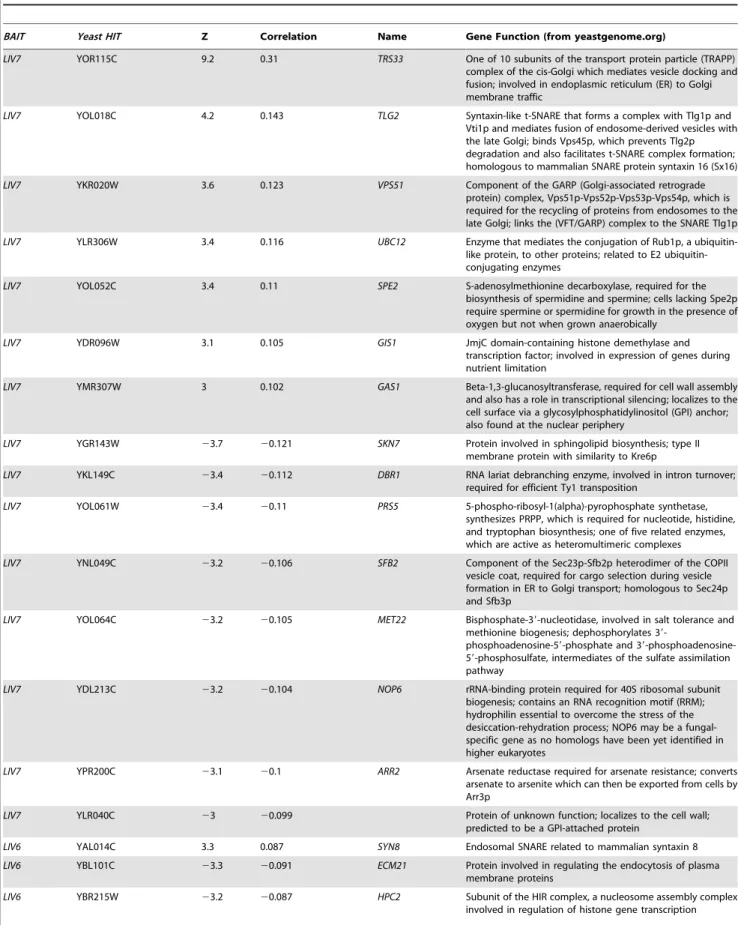
Table 1.S. cerevisiaegenes whose knockouts significantly correlate withC. neoformansbait genes.
BAIT Yeast HIT Z Correlation Name Gene Function (from yeastgenome.org)
LIV7 YOR115C 9.2 0.31 TRS33 One of 10 subunits of the transport protein particle (TRAPP)
complex of the cis-Golgi which mediates vesicle docking and fusion; involved in endoplasmic reticulum (ER) to Golgi membrane traffic
LIV7 YOL018C 4.2 0.143 TLG2 Syntaxin-like t-SNARE that forms a complex with Tlg1p and
Vti1p and mediates fusion of endosome-derived vesicles with the late Golgi; binds Vps45p, which prevents Tlg2p degradation and also facilitates t-SNARE complex formation; homologous to mammalian SNARE protein syntaxin 16 (Sx16)
LIV7 YKR020W 3.6 0.123 VPS51 Component of the GARP (Golgi-associated retrograde
protein) complex, Vps51p-Vps52p-Vps53p-Vps54p, which is required for the recycling of proteins from endosomes to the late Golgi; links the (VFT/GARP) complex to the SNARE Tlg1p
LIV7 YLR306W 3.4 0.116 UBC12 Enzyme that mediates the conjugation of Rub1p, a
like protein, to other proteins; related to E2 ubiquitin-conjugating enzymes
LIV7 YOL052C 3.4 0.11 SPE2 S-adenosylmethionine decarboxylase, required for the
biosynthesis of spermidine and spermine; cells lacking Spe2p require spermine or spermidine for growth in the presence of oxygen but not when grown anaerobically
LIV7 YDR096W 3.1 0.105 GIS1 JmjC domain-containing histone demethylase and
transcription factor; involved in expression of genes during nutrient limitation
LIV7 YMR307W 3 0.102 GAS1 Beta-1,3-glucanosyltransferase, required for cell wall assembly
and also has a role in transcriptional silencing; localizes to the cell surface via a glycosylphosphatidylinositol (GPI) anchor; also found at the nuclear periphery
LIV7 YGR143W 23.7 20.121 SKN7 Protein involved in sphingolipid biosynthesis; type II
membrane protein with similarity to Kre6p
LIV7 YKL149C 23.4 20.112 DBR1 RNA lariat debranching enzyme, involved in intron turnover;
required for efficient Ty1 transposition
LIV7 YOL061W 23.4 20.11 PRS5 5-phospho-ribosyl-1(alpha)-pyrophosphate synthetase,
synthesizes PRPP, which is required for nucleotide, histidine, and tryptophan biosynthesis; one of five related enzymes, which are active as heteromultimeric complexes
LIV7 YNL049C 23.2 20.106 SFB2 Component of the Sec23p-Sfb2p heterodimer of the COPII
vesicle coat, required for cargo selection during vesicle formation in ER to Golgi transport; homologous to Sec24p and Sfb3p
LIV7 YOL064C 23.2 20.105 MET22 Bisphosphate-39-nucleotidase, involved in salt tolerance and
methionine biogenesis; dephosphorylates 39
-phosphoadenosine-59-phosphate and 39 -phosphoadenosine-59-phosphosulfate, intermediates of the sulfate assimilation pathway
LIV7 YDL213C 23.2 20.104 NOP6 rRNA-binding protein required for 40S ribosomal subunit
biogenesis; contains an RNA recognition motif (RRM); hydrophilin essential to overcome the stress of the desiccation-rehydration process; NOP6 may be a fungal-specific gene as no homologs have been yet identified in higher eukaryotes
LIV7 YPR200C 23.1 20.1 ARR2 Arsenate reductase required for arsenate resistance; converts
arsenate to arsenite which can then be exported from cells by Arr3p
LIV7 YLR040C 23 20.099 Protein of unknown function; localizes to the cell wall;
predicted to be a GPI-attached protein
LIV6 YAL014C 3.3 0.087 SYN8 Endosomal SNARE related to mammalian syntaxin 8
LIV6 YBL101C 23.3 20.091 ECM21 Protein involved in regulating the endocytosis of plasma
membrane proteins
LIV6 YBR215W 23.2 20.087 HPC2 Subunit of the HIR complex, a nucleosome assembly complex
scenario, the growth rate of such cells would thus not be affected by BFA since the have greatly reduced the target organelle most strongly affected by the drug. A more formal statement of such a model would be that in the absence of BFA, Liv7 and Trs33
redundantly promote growth (via a role in Golgi biogenesis), but in the presence of the drug, cells convert to a state in which either Liv7 or Trs33 inhibits growth (Figure 3E). This genetic behavior is analogous to that of theS. cerevisiaeMAP kinase Kss1, which is Table 1.Cont.
BAIT Yeast HIT Z Correlation Name Gene Function (from yeastgenome.org)
LIV5 YKR019C 3.6 0.097 IRS4 EH domain-containing protein involved in regulating
phosphatidylinositol 4,5-bisphosphate levels and autophagy; Irs4p and Tax4p bind and activate the PtdIns phosphatase Inp51p; Irs4p and Tax4p are involved in localizing Atg17p to the PAS
LIV5 YBR195C 3.4 0.091 MSI1 Subunit of chromatin assembly factor I (CAF-1Msi1p localizes
to both nucleus and cytoplasm and has an independent role as a negative regulator of the RAS/cAMP pathway via sequestration of Npr1p kinase
LIV5 YBR057C 24.1 20.11 MUM2 Cytoplasmic protein essential for meiotic DNA replication and
sporulation; interacts with Orc2p, which is a component of the origin recognition complex
LIV5 YKL030W 23.4 20.092 dubious; overlaps with MAE1 (Mitochondrial malic enzyme,
catalyzes the oxidative decarboxylation of malate to pyruvate, which is a key intermediate in sugar metabolism and a precursor for synthesis of several amino acids)
LIV13 YBR169C 24.1 20.116 SSE2 Member of the heat shock protein 70 (HSP70) family; may be involved in protein folding; localized to the cytoplasm; highly homologous to the heat shock protein Sse1p
LIV13 YKL075C 23.8 20.108 unknown; proposed to be involved in resistance to streptozotocin and camptothecin
LIV13 YBL049W 23.5 20.098 MOH1 Protein of unknown function, has homology to kinase Snf7p; not required for growth on nonfermentable carbon sources; essential for survival in stationary phase
LIV13 YBR181C 23.1 20.087 RPS6B Protein component of the small (40S) ribosomal subunit; identical to Rps6Ap and has similarity to rat S6 ribosomal protein
MEP1 YAR015W 6.4 0.175 ADE1 N-succinyl-5-aminoimidazole-4-carboxamide ribotide
(SAICAR) synthetase, required for ‘de novo’ purine nucleotide biosynthesis; red pigment accumulates in mutant cells deprived of adenine
MEP1 YKL009W 4.5 0.122 MRT4 Protein involved in mRNA turnover and ribosome assembly,
localizes to the nucleolus
MEP1 YPR114W 3.5 0.094 unknown
MEP1 YKR019C 3.4 0.092 IRS4 EH domain-containing protein involved in regulating
phosphatidylinositol 4,5-bisphosphate levels and autophagy; Irs4p and Tax4p bind and activate the PtdIns phosphatase Inp51p; Irs4p and Tax4p are involved in localizing Atg17p to the PAS
MEP1 YBR074W 3.2 0.088 unknown; putative metalloprotease
MEP1 YBR119W 24.2 20.115 MUD1 U1 snRNP A protein, homolog of human U1-A; involved in
nuclear mRNA splicing
MEP1 YKR055W 23.5 20.095 RHO4 Non-essential small GTPase of the Rho/Rac subfamily of
Ras-like proteins, Ras-likely to be involved in the establishment of cell polarity
BLP1 YBR026C 3.1 0.085 ETR1 2-enoyl thioester reductase, member of the medium chain
dehydrogenase/reductase family; localized to in mitochondria, where it has a probable role in fatty acid synthesis
BLP1 YKL166C 3 0.083 TPK3 cAMP-dependent protein kinase catalytic subunit; promotes
vegetative growth in response to nutrients via the Ras-cAMP signaling pathway; partially redundant with Tpk1p and Tpk2p; localizes to P-bodies during stationary phase
C. neoformansbait gene (column 1),S. cerevisiaeORF that shows significant correlation (column 2), Z-score (column 3), correlation score (column 4),S. cerevisiaegene name (column 5), andS. cerevisiaegene function (from theSaccharomyces Genome Databaseat yeastgenome.org) [78] (column 6).
converted from an inhibitor of filamentous growth to an activator via phosphorylation by the upstream MAP kinase Ste7 [43]. The vps52Dmutant also displays resistance to BFA (Figure 3D).
To further test the hypothesis that Liv7 functions in the Golgi, we examined the colocalization of an mCherry-tagged version of Liv7 with compartment markers. The levels of Liv7 protein are low and we could not detect it by Western or microscopy under yeast culture conditions (data not shown). However, under the same tissue culture conditions we use to study pathogen phagocytosis (DMEM, 5% CO2, without shaking), we observed
a punctate Liv7-mCherry signal that was well above background signal observed in an untagged control strain (Figure 4A–4C). To label the ER and Golgi, we briefly incubated cells with a fluorescent derivative of Brefeldin A (fBFA) [44] at sub-inhibitory concentrations (0.5mg/ml for 40 min, 80-fold less than the minimal inhibitory concentration). To confirm that the compound was labeling the anticipated compartments, we stained a C. neoformansstrain with fBFA carrying a mCherry-tagged version of the conserved Erd2 protein, which is found in both ER and Golgi compartments [45] and found that the fBFA signal colocalizes with the Erd2 signal (Figure S2). Importantly, the Liv7-mCherry colocalizes with the fBFA signal. The respective puncta co-localize in almost 100% cells that display signals for both fluorophores (Figure 4A–4C). As a control, we stained mitochondria with MitoTracker did not observe co-localization with Liv7-mCherry signal (Figure S3).
To test whether mutations LIV7 and TRS33 impact the formation of the ER and Golgi we stained single and double mutants with fBFA. Wild-type, liv7D, andtrs33Dstrains showed similar cytoplasmic punctate staining (Figure 4D–4G). However, liv7D trs33D mutants did not exhibit detectable fBFA staining (Figure 4G), consistent with a severe defect in organelle formation. These data show that Liv7 is important in promoting organelle formation in cells lacking Trs33. Together with the impact of the mutants on BFA sensitivity and the colocalization of Liv7 with fBFA, these observations provide strong evidence for a role for Liv7 in Golgi function.
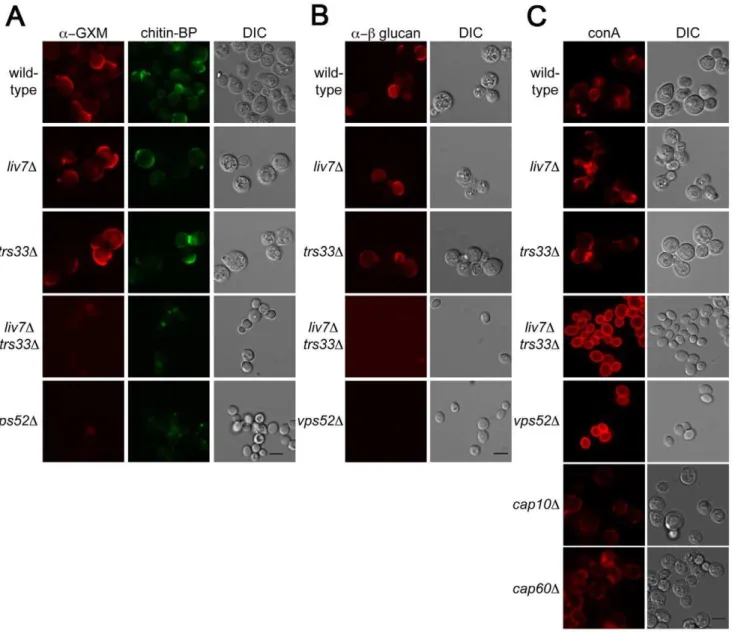
Liv7 and Trs33 suppress PAMP exposure inC. neoformans Key functions of the Golgi include the sorting and modification of proteins and the biosynthesis of polysaccharides. The cell surface of microbes often contain pathogen-associated molecular patterns (PAMPs), molecular signatures that are recognized by the mammalian immune system [46]. Previous studies of the human fungal pathogen Candida albicans has shown that there are mechanisms by which this pathogen masks PAMPs to order to avoid recognition by neutrophils [47]. To test whether LIV7or TRS33 are involved in PAMP exposure, we examined the cell surface exposure of two well-established fungal PAMPs, mannose andb-glucan. These experiments were performed in tissue culture conditions, which modestly induces production of theC. neoformans polysaccharide capsule. In addition, we stained cells for the glucuronoxylomannan (GXM) component of the capsule and as well as the cell wall polysaccharide chitin. We used an antibody to detect glucuronoxylomannan (GXM) component ofC. neoformans polysaccharide capsule (Figure 5A), the lectin CBP to detect chitin (Figure 4A), an antibody to detectb-glucan (Figure 5B), and the
lectin concanavalin A (conA) to detect exposure of mannose (Figure 5C). Wild-type,liv7D, andtrs33Dall showed similar PAMP exposure, with modest staining of b-glucan and mannose under tissue culture growth conditions (Figure 5A–5C). We also observed modest staining using reagents that detect chitin and GXM (Figure 5A–5C).
In contrast, we observed strikingly different results in liv7D trs33D double mutant cells and in the vps52D mutant. Most remarkably, we observed a dramatic increase in mannose exposure in these mutants as measured by conA staining (Figure 5C). In contrast, GXM orb-glucan staining is virtually eliminated (Figure 5A, 5B). The chitin signal is reduced in intensity and localizes to a focus at the cell pole. The increase in conA signal cannot be explained by the lack of capsular GXM in the double mutant, as GXM- and capsule-deficient mutant strains cap10D [48] andcap60D[48,49] do not exhibit this phenotype (Figure 5C). These data suggest thatLIV7andTRS33act redundantly in the transport of molecules required to suppress the exposure of mannose on the cell surface and that the integrity of the GARP complex is also required for this process.
Liv7 prevents mannose-dependent phagocytosis ofC. neoformansby macrophages
Mannose and mannoproteins (mannan) are highly immuno-genic [50], and, consequently, masking their exposure would be expected to be critical for pathogen evasion of the host immune system. It is well-established thatC. neoformansevades phagocytosis by macrophages (anti-phagocytosis), the first line of host immune defense, and that this attribute is important for mammalian infection [5,51]. In prior work, we demonstrated thatC. neoformans evades phagocytosis by at least two pathways, one requiring capsule production and a second that is independent of capsule production and programmed by the transcriptional regulators Gat201 and Gat204 [5,22]. Strikingly, mutations that abrogate capsule formation and mutations in the capsule-independent pathway do not result in detectable exposure of mannose or b -glucan on the cell surface, suggesting that these pathways do not act by masking these known PAMPs, even though their exposure would be anticipated to activate phagocytic receptors on macrophages.
Surprisingly, even though there was no gross increase in mannose exposure in theliv7Dsingle mutant, it displays a small (11%) but reproducible increase in phagocytosis without opson-ization (p#561025) and no further increase with opsonization. In contrast, thetrs33Dmutant does not show this phenotype.
The singleliv7Dandtrs33Dmutants show distinct phagocytosis phenotypes yet the mannose exposure (as determined by conA staining) of both mutants is not distinguishable from wild-type. We hypothesized thatliv7Dcells might exhibit an increase in mannose or mannan on their surface not present intrs33Dcells that is too
subtle to detect by microscopy-based lectin staining assays. A functional prediction of this hypothesis is that the increase in phagocytosis of theliv7Dmutant should be specifically blocked by an excess of free mannose. We performed phagocytosis assays using unopsonized C. neoformans cells and added either soluble mannose (to block recognition of mannose and mannans by macrophage mannose-recognition receptors) or laminarin (a control oligosaccharide that blocks recognition of beta-glucan) [52]. Strikingly mannose, but not laminarin, blocks the increased phagocytosis of liv7D mutants (p#1023) (Figure 6B). Mannose
Figure 4. Liv7 localizes to the ER/Golgi inC. neoformans.A) Localization analysis. Shown are mCherry signals of cells grown under tissue culture conditions (left) (DMEM, 5% CO2, 37uC, without shaking). The untagged control population (blue) shows mCherry signal in less than 20% of cells, whereas mCherry signal is visible in ,50% of Liv7-mCherry positive cells (yellow). We then stained these same strains with BODIPY-labeled fluorescent BFA (fBFA; green channel; localizes to the ER/Golgi [44]). Experiments were performed three times, 100 cells counted per sample, and data shown are the averages of three experiments. Error bars represent that standard deviation and p-values were calculated using Student’s t-test. Scale bars are 5mm. B) Untagged control cells stained with fBFA. 50 ms exposure. C) Liv7-mCherry cells stained with fBFA. 50 ms exposure. D–G) fBFA-staining of wild-type,liv7D,trs33D, andliv7Dtrs33Dcells.
doi:10.1371/journal.pgen.1003168.g004
addition also partially rescues the anti-phagocytosis defect ofliv7D trs33Dcells (p#1023). Importantly, this treatment did not impact
phagocytic index of gat204D cells (Figure 6B), a mutant we described previously that produces similar increase in phagocyto-sis, supporting the view that Liv7 and Gat204 function via distinct mechanisms [22].
Genetic support for the endosomal role forLIV6 predicted by its cross-species profile
The genetic interaction profile produced by the expression of LIV6inS. cerevisiaeshows positive and negative correlations with the corresponding profiles of the S. cerevisiae syn8D and ecm21D deletion mutants, respectively (Table 1 and Figure 7A). These genes act in endosome transport and/or fusion [28,29], a process that mediates transport from either the plasma membrane or the late Golgi to the vacuole [53]. These correlations predict that Liv6 participates in endosomal functions inC. neoformans.
We first tested this prediction by assessing the impact of Liv6 on vacuole number.S. cerevisiaegenes involved sorting to the vacuole include those that function in endosome biology and often impact vacuole number and morphology [54–56]. Vacuoles can be detected by staining with LysoTracker Green (Invitrogen), a dye that is taken up by the cell during endocytosis and fluoresces in acidified compartments, including endosomal vesicles, and typi-cally strains the outer rims of vacuoles. Wild-typeC. neoformanscells grown in yeast culture conditions and strained with LysoTracker show efficient uptake, many internal vesicles, and rim-stained vacuoles (Figure 7B). This pattern is remarkably similar to those reported for S. cerevisiae stained with LysoTracker or FM4-64 [56,57], an older vital stain used to study protein sorting to the vacuole [57]. Strikingly, liv6Dcells consistently exhibit a greater number of vacuoles than wild-type cells (p,0.005) (Figure 7C, 7D). Notably, theS. cerevisiaegeneSYN8, whose deletion mutant’s genetic interaction profile displays a positive correlation with the profile produced byLIV6expression (Table 1), has been reported to function with another SNARE to promote normal vacuolar morphology [28]. The increase in vacuolar number seen inliv6D cells is highly specific, as knockout mutant in any of the bait genes did not exhibit a change in vacuole number (Figure 7D).
We next exploited the aminoglycoside antibiotic neomycin, which interferes with eukaryotic endosomal activity by binding phosphytidylinositol phosphates [58,59] necessary for endosome function [60]. As a consequence, loss-of-function mutations inS. cerevisiaegenes involved in endosome function [61,62] are sensitive to neomycin [61]. Supporting a role for Liv6 in endosome function, we found thatC. neoformans liv6Dknockout mutants are sensitive to this drug (Figure 7E). Cells lacking LIV7 display a subtle reproducible neomycin resistance which could be due to altered cell permeability, a characteristic of neomycin-resistant S. cerevisiaestrains [63,64]. Knockout mutants in the other bait genes do not display a change in sensitivity to this compound.liv6Dcells
do not exhibit a growth defect on fluconazole, suggesting that their growth defect is specific to neomycin. Together, the changes in vacuole number and sensitivity to neomycin in produced by the liv6Dmutation support the prediction from cross-species genetic profiles of a role for Liv6 in the endovacuolar system of C. neoformans.
Discussion
Genetic approaches to understanding mechanisms of virulence in human fungal pathogens can efficiently identify genes necessary for pathogens to cause disease. However, a key roadblock to progress is the lack of tools that can help define the function of a gene product when its predicted sequence offers few clues to its biochemical function, a common occurrence. We described here a case study of a cross-species genetic interaction profiling approach to develop testable hypotheses for the function of fungal virulence factors of unknown function. Notably, this proof-of-principle study shows that the approach can provide information on fungal pathogenicity factors that lack S. cerevisiae orthologs. Although many studies have usedS. cerevisiaeto investigate the function of foreign genes [9–11,13,14], the cross-species genetic interaction profile used here represents an application of quantitative genetic profiling of foreign proteins inS. cerevisiaecoupled with comparison to recently described genetic map of S. cerevisiae [19] to the problem of annotation of fungal virulence factors. Because S. cerevisiae is a fungus, we anticipate that this approach may be particularly useful for fungal genes but that the method may also find utility in the study of bacterial and viral proteins that impact conserved intracellular processes in eukaryotic host cells.
Our approach involves expression in S. cerevisiae of cDNAs encoding Cryptococcus neoformans virulence factors identified in systematic genetic screens; the generation of genetic profiles by assessing the effect ofC. neoformansgene expression in the context of each nonessentialS. cerevisiaedeletion mutants; and, correlation analysis with the existing database of genetic interactions to develop testable functional hypotheses. As mentioned above, one mechanism whereby expression of a C. neoformans gene could produce impactS. cerevisiae would be ‘‘dominant-negative’’ effect thereby inhibiting the activity of an S. cerevisiae pathway. Our results withLIV7in bothS. cerevisiaeandC. neoformansare consistent with this scenario. The expression ofLIV7inS. cerevisiaeproduces a profile that correlates with that of theS. cerevisiae trs33Ddeletion mutant, but in C. neoformans, the liv7D mutation produces a synthetic phenotype with the trs33D mutation. Alternatively, expression of a C. neoformans gene product could act in a ‘‘dominant-active’’ fashion to increase the activity of a pathway which might result in a negative correlation with the profile of a gene deletion in the corresponding pathway. With Liv6, we observed both positive and negative correlations that led us to test a role in endosome function. Although we have focused on the
Figure 6.liv7Dbut nottrs33Dcells are defective in phagocytosis evasion.A) Phagocytosis assays.C. neoformanscells were treated either with 16PBS (unopsonized, blue) or 100% fetal bovine serum (opsonized, yellow) for 30 min, then used to infect RAW264.6 macrophage-like cells at a multiplicity-of-infection of twoC. neoformanscells to one macrophage. Data shown are the averages of three experiments. Error bars represent that standard deviation and p-values were calculated using Student’s t-test. B) Phagocytosis assays. Association of unopsonizedC. neoformanscells with the addition of control buffer (blue), with 250mM mannose (yellow), or 250mM laminarin (purple). Data shown are the averages of three experiments. Error bars represent that standard deviation and p-values were calculated using Student’s t-test. C) Model. Together with our previous work, the data described in this paper suggests that there are three parallel mechanisms by whichC. neoformansevades phagocytosis. First, Liv7 acts in a partially redundant fashion with Trs33 in vesicle transport, a function that prevents exposure of pathogen associated molecular patterns (PAMPs) that are recognized by the immune system and result in phagocytosis ofC. neoformansby phagocytes. Liv7/Trs33 are not part of the Gat201-Gat204-Blp1 pathway because phagocytosis ofliv7Dcells can be competitively inhibited by mannose, whereas phagocytosis ofgat204Dcells cannot. The Liv7/ Trs33 pathway does not act to suppress phagocytosis via capsule production since capsule-deficient mutants do not display PAMP exposure and are sensitive to opsonization.
extensive deletion mutant genetic interaction dataset [19], comparisons of the cross-species profiles generated here with genetic interaction profiles produced using chemicals [65,66] and/ or overexpressed genes [67,68] will likely be equally useful as these approaches are applied on a larger scale. Thus, the analysis of correlations between cross-species genetic interaction profiles and existing ‘‘within-species’’ genetic interaction profiles offers a tool for generating testable predictions for pathways in which foreign genes operate.
The genetic profiling studies and validation experiments described in this paper provide new information on two C. neoformans pathogenicity factors identified previously, Liv7 and Liv6. These proteins lack orthologs inS. cerevisiaeand lack orthologs of known function in other species. Our studies of Liv7 suggest it functions in Golgi transport in a process that suppresses the exposure of the PAMP mannose on the cell surface (Figure 6C). The increased phagocytosis phenotype of theliv7Dsingle mutant and its specific suppression by soluble mannose appears specific toliv7D cells and is specific to mannose versus other carbohydrates (Figure 6B). The anti-phagocytic properties of C. neoformans are critical for mammalian infection [5,22,69] and the capsule is important for the anti-phagocytosis activity of opsonized C. neoformans cells [51]. Our previous work identified a capsule-independent pathway necessary for anti-phagocytosis under un-opsonized conditions [22]. The suppression cell surface exposure of PAMP mannose appears to represent a third anti-phagocytosis pathway (Figure 6C) since mannose does not rescue the anti-phagocytic defect ofgat204Dcells (Figure 6B), which are defective in the capsule-independent anti-phagocytosis pathway [22]. This argument is supported by the observation thatcap10Dandcap60D cells, which lack GXM [48,49], do not exhibit increased conA staining (Figure 5C). We suggest that Liv7 is important for mammalian infection [5] because it inhibits macrophage recogni-tion of mannose-containing patterns on theC. neoformanscell surface (Figure 6C). Although our studies of Liv6 point to a role in endosome biology that impacts neomycin resistance and vacuole number, understanding how this function relates to its role in pathogen fitness in the host will require further investigation. One possibility is that Liv6 is involved in the endocytic uptake of limiting factors required for proliferation from the host milieu.
One anticipates that functional annotation of fungal virulence factors identified genetically will continue to be a major challenge for the future. The approach described here represents one generic tool that could be applied to this problem on a larger scale. We expect that a substantial number of virulence genes of unknown function in fungal pathogens will impinge on conserved cellular processes and that their genetic profiling inS. cerevisiaecould therefore yield testable functional predictions in a significant number of cases. The cross-species interaction profiling could also be useful for studying genes from highly virulent pathogens that are difficult to work with due to the requirement for extensive containment.
Methods
Generation ofS. cerevisiaestrains
We inserted theGPD1promoter region, ourC. neoformanscDNA of interest, and a NAT resistance marker into the multicloning site
of pRS316. For recombination into S. cerevisiae, we cut with a restriction enzyme that cleaved within the URA3 locus, the transformed the linearized vector intoS. cerevisiae using standard lithium acetate-based transformation techniques. We verified expression ofC. neoformans genes by extracting total RNA from log-phaseS. cerevisiaecultures grown at 30uC in YNB, selecting for mRNA, and making cDNA as previously described [70]. Expression ofC. neoformansgenes was verified by qPCR performed as previously described [70].
CalculatingC. neoformansgene expression level inS. cerevisiaestrains
We expressed eachC. neoformansgene under theGPD1promoter and we measured RNA by qRT-PCR (Figure S4). We then measured the levels of BUD1 mRNA in the same RNA preparation. BUD1 is a small GTPase expressed at low levels [71–73] along with its two co-regulatorsBUD2andBUD5[74,75]. We used published data on the molecules ofBUD1RNA per cell averaged with co-regulatorsBUD2andBUD5[71–73] to estimate the number of RNA molecules per cell forC. neoformansgenes from the ratios in Figure S4, then calculated its rank position compared to otherS. cerevisiaegenes.BLP1andLIV6were in the lowest 10% of genes with detectable RNA (,5090 of ,6580 genes had detectable RNA [71–73]). LIV5 and LIV7 were in the 10–20th percentile, as were theBUDgenes.MEP1was the best expressed of theC. neoformans genes, (,35th percentile). LIV13 was expressed based on the increase inLIV13primer products with and without RT (data not shown) but not compared toBUD1.
Synthetic Genetic Analysis (SGA) screens
We performed SGA screens as described in Tong et al [16,17] using a RoToR colony pinning robot (Singer Instruments). All screen plates were scanned on a flatbed scanner with autofocus. We extracted colony size data using the publicly available ScreenMill software [76]. We then adjusted the raw colony size data to control for plate position, edge effects, and slow growth of knockout mutants using the S-score method developed by Collins et al [20]. The final S-scores, one for each double mutant strain, indicate the strength of the genetic interaction (absolute value) and whether the interaction is synthetically sick (negative numbers) or buffered (positive numbers) [20]. We then adjusted S-scores so that they were on a scale between21.0 and 1.0 and calculated the Pearson correlation between S-scores and e-scores from Con-stanzo et al [19]. We calculated p-values of the Pearson correlations by calculating the Z-score of the Pearson correlation for each interaction, then using the Z-score to determine the p-value of each interaction.
C. neoformansgenetic manipulations and growth conditions
C. neoformanswas routinely grown in yeast culture conditions in either YPAD (1% yeast extract, 2% peptone, 2% glucose, 0.015% L-tryptophan, 0.004% adenine) or yeast nitrogen base (YNB) (Difco). Strain construction and genetic manipulation was previously described [5]. Whenever more than one knockout mutant for a single gene is shown, mutants were made by independent transformations. Growth curves (Figure 3A) were neoformanscells.liv6Dcells but not other mutants show an increase in the number of vacuoles per cell (p#0.005). Data shown are the averages of three experiments. 200 cells were counted per sample. Error bars represent the standard deviation of three experiments and p-values were calculated using the Student’s t-test. E) Growth analysis of wild-type and mutantC. neoformanscells on yeast medium (YNB) without drug, with 2.5 mM neomycin, or with 10mg/ml fluconazole. Cells were spotted at 107cells/ml in the upper spot and diluted 5-fold in each subsequent spot. Plates were incubated 48 hours at 30uC.
performed in YNB at 30uC by taking measurements of OD600
every two hours for 10 hrs. The growth curve was repeated three times and representative data are shown. WhenC. neoformanscells were grown in tissue culture conditions, they were first grown overnight to saturation in YNB, then washed once in 16PBS and resuspended at a density of 1 OD600/ml (,1.76107cells/ml) in DMEM, then incubated for the specified amount of time in 5% CO2at 37uC.
Treatment with Brefeldin A (BFA)
Samples were grown in overnight in YNB at 30uC, then subcultured to OD600= 0.2. BFA or DMSO (-BFA control) was
added to each culture and the OD600taken every hour for 10 hr.
Doubling time was calculated over the interval from 4–8 hr. The treatment curve was repeated three times and the data shown are averages of the three experiments.
Imaging of Liv7-mCherry and staining with fluorescent Brefeldin A (fBFA)
Samples were grown overnight in YNB at 30uC, then washed 36in 16PBS and resuspended at 1 OD/ml in DMEM, then incubated 16 hr under tissue culture conditions (5% CO2, 37uC).
Samples were then either imaged (unstained samples) or fBFA (Life Technologies) was added to the medium to a final concentration of 0.5mg/ml. fBFA samples were incubated 40 min, washed 16in PBS, then imaged immediately.
LysoTracker staining
C. neoformans cells were grown overnight under yeast culture conditions (yeast nitrogen base (YNB), 30uC with rotation), then subcultured to OD600 of ,0.2 and grown to midlog phase. LysoTracker Green was added to a final concentration of 500 nM and incubated for five minutes with shaking at 30uC. Cells were then harvested and immediately imaged.
MitoTracker staining
Strains were grown under tissue culture conditions for 12 hr. MitoTracker Green (Invitrogen) was added to a final concentra-tion of 1mM (from 1 mM stock in DMSO), incubated 30 min at 37uC, then imaged.
Lectin and antibody staining of cell surface residues Samples were grown overnight in YNB at 30uC, then washed three times in 16PBS and resuspended at 1 OD/ml in DMEM, then incubated 16 hr under tissue culture conditions (5% CO2,
37uC). Samples were then fixed for 15 min in 4% paraformal-dehyde, washed three times in 16PBS, and then used for staining. To stain with concanavalin A (conA) staining for mannose residues, cells were incubated 5 min in 50mg/ml
Alexa Fluor 594 (Invitrogen), washed once in 16PBS, then imaged. Samples for staining for chitin and GXM were incubated withaGXM antibody mAb 339 (1:1000) as previously described [5] and fluorescein-conjugated chitin binding domain (New England Biolabs) (1:500) for 4 hr, then washed twice in 16 PBS and incubated with TRITC-conjugated donkey anti-mouse secondary antibody (Jackson ImmunoResearch) and fluorescein-conjugated chitin binding domain (1:500) for 1 hr. Samples were then washed once and imaged using an Axiovert 200 M (Zeiss) microscope running Axiovision software. b-glucan staining was performed using the same procedure as GXM staining but with anti-b-glucan antibody (1:1000) (Biosupplies
Phagocytosis assays
Phagocytosis assays were performed as previously described [5,22]. RAW264.7 macrophages (26104 cells/well) were seeded into 96-well tissue-culture treated plates in DMEM medium and allowed to adhere overnight.C. neoformans cells grown in YPAD medium were washed three times with PBS, then resuspended to a density of 107cells/ml in PBS. 200ml fresh DMEM was added to RAW264.7 cells. 5mlC. neoformansculture (56104cells) were then added to each well for a multiplicity of infection of two yeast to one macrophage. Following 24 hr co-incubation, the macrophages were washed three times with PBS to remove unphagocytosed yeast and then fixed with 1% formaldehyde/PBS prior to visualization on an inverted light microscope. Percentage of yeast cell-associated macrophages was determined by counting the number of macro-phages with yeast internalized or associated with their cell surface, divided by the number of macrophages counted. At least 200 macrophages were assayed per well, and each strain was tested in triplicate. If performing phagocytosis experiments under opsonizing conditions,C. neoformanscells were grown overnight in YNB, washed three times in 16PBS, resuspended to a density of 107cells/ml in either fetal bovine serum (opsonized samples; FBS) or 16PBS (unopsonized samples), incubated for 30 min at 30uC on a shaking platform, washed once in 16PBS, then resuspended at 107cells/ml in 16PBS and used to infect macrophages as above.
Supporting Information
Figure S1 Q–Q plots of C. neoformans bait genes. Plots of the quantiles of the indicated filtered genetic interaction profiles plotted against those of a normal distribution. Observations that lie on the diagonal are indicative of normally-distributed data, whereas tails indicate a deviation from the expectation.
(TIF)
Figure S2 fBFA co-localizes with Erd2-mCherry, confirming that fBFA stains the ER and Golgi compartments. A) Six representative cells expressing Erd2-mCherry and stained with fBFA. Growth and staining procedures were performed as in Figure 3C–3E and experiments were carried out simultaneously. Erd2-mCherry and fBFA are co-localized. Scale bars represent five microns. B) mCherry signal from cells grown under tissue culture conditions (left) (DMEM, 5% CO2, 37uC). The untagged
control population (blue) shows mCherry signal in less than 20% of cells, whereas mCherry signal is visible in,50% of Liv7-mCherry expressing cells (yellow) or ,65% of Erd2-mCherry expressing cells (purple), demonstrating that both Liv7-mCherry and Erd2-mCherry are visible above background levels. When we stained these strains with fBFA, Erd2-mCherry cells with both mCherry and fBFA signal showed co-localization ,96% of the time, compared to,30% of the time for the untagged control. The co-localization of fBFA and Erd2-mCherry, an ER/Golgi marker [45], demonstrate that fBFA localizes to the ER/Golgi as expected. These data are the complete dataset from Figure 3C. Experiments were performed three times, 100 cells counted per sample, and data shown are the averages of three experiments. Error bars represent that standard deviation.
(TIF)
Figure S4 RT–qPCR ofC. neoformansbait genes expressed inS. cerevisiae. C. neoformans genes RNA levels measured by RT-qPCR and compared toS. cerevisiaegeneBUD1, a GTPase involved. (TIF)
Table S1 C. neoformans bait genes. C. neoformans bait genes (column 1); their systematic names (column 2); their S. cerevisiae ortholog, if any [23] (column 3); the function of the orthologousS. cerevisiaegene (column 4); conserved motifs or domains detected by BLAST [23] (column 5); the function of conserved domains or motifs (column 6); and any functional prediction made by the threading program PHYRE [24] (column 7).
(PDF)
Acknowledgments
We would like to thank Huiming Ding from the University of Toronto for help in extracting colony size data.
Author Contributions
Conceived and designed the experiments: JCSB HDM. Performed the experiments: JCSB. Analyzed the data: JCSB HDM. Contributed reagents/materials/analysis tools: JCSB HDM. Wrote the paper: JCSB HDM.
References
1. Park BJ, Wannemuehler KA, Marston BJ, Govender N, Pappas PG, et al. (2009) Estimation of the current global burden of cryptococcal meningitis among persons living with HIV/AIDS. AIDS 23: 525–530.
2. Richardson MD (2005) Changing patterns and trends in systemic fungal infections. J Antimicrob Chemother 56: i5–i11.
3. Gallagher LA, Ramage E, Jacobs MA, Kaul R, Brittnacher M, et al. (2007) A comprehensive transposon mutant library of Francisella novicida, a bioweapon surrogate. Proc Natl Acad Sci U S A 104: 1009–1014.
4. Liberati NT, Urbach JM, Miyata S, Lee DG, Drenkard E, et al. (2006) An ordered, nonredundant library of Pseudomonas aeruginosa strain PA14 transposon insertion mutants. Proc Natl Acad Sci U S A 103: 2833–2838. 5. Liu OW, Chun CD, Chow ED, Chen C, Madhani HD, et al. (2008) Systematic
Genetic Analysis of Virulence in the Human Fungal Pathogen Cryptococcus neoformans. Cell 135: 174–188.
6. Murray GL, Morel V, Cerqueira GM, Croda J, Srikram A, et al. (2009) Genome-Wide Transposon Mutagenesis in Pathogenic Leptospira Species. Infect Immun 77: 810–816.
7. Noble SM, French S, Kohn LA, Chen V, Johnson AD (2010) Systematic screens of a Candida albicans homozygous deletion library decouple morphogenetic switching and pathogenicity. Nat Genet 42: 590–598.
8. Giaever G, Chu AM, Ni L, Connelly C, Riles L, et al. (2002) Functional profiling of the Saccharomyces cerevisiae genome. Nature 418: 387–391. 9. Cooper AA, Gitler AD, Cashikar A, Haynes CM, Hill KJ, et al. (2006)
Alpha-Synuclein Blocks ER-Golgi Traffic and Rab1 Rescues Neuron Loss in Parkinson’s Models. Science 313: 324–328.
10. Kramer RW, Slagowski NL, Eze NA, Giddings KS, Morrison MF, et al. (2007) Yeast Functional Genomic Screens Lead to Identification of a Role for a Bacterial Effector in Innate Immunity Regulation. PLoS Pathog 3: e21. doi:10.1371/journal.ppat.0030021
11. Lee MG, Nurse P (1987) Complementation used to clone a human homologue of the fission yeast cell cycle control gene cdc2. Nature 327: 31–35. 12. Sisko JL, Spaeth K, Kumar Y, Valdivia RH (2006) Multifunctional analysis of
Chlamydia-specific genes in a yeast expression system. Mol Microbiol 60: 51–66. 13. Slagowski NL, Kramer RW, Morrison MF, LaBaer J, Lesser CF (2008) A Functional Genomic Yeast Screen to Identify Pathogenic Bacterial Proteins. PLoS Pathog 4: e9. doi:10.1371/journal.ppat.0040009
14. Treusch S, Hamamichi S, Goodman JL, Matlack KES, Chung CY, et al. (2011) Functional Links Between AB Toxicity, Endocytic Trafficking, and Alzheimer’s Disease Risk Factors in Yeast. Science 334: 1241–1245.
15. Turgeon Z, White D, Jørgensen R, Visschedyk D, Fieldhouse RJ, et al. (2009) Yeast as a tool for characterizing mono-ADP-ribosyltransferase toxins. FEMS Microbiol Lett 300: 97–106.
16. Tong A, Boone C (2006) Synthetic genetic array analysis in Saccharomyces cerevisiae. Methods Mol Biol 313: 171–192.
17. Tong A, Lesage G, Bader G, Ding H, Xu H, et al. (2004) Global mapping of the yeast genetic interaction network. Science 303: 808–813.
18. Collins SR, Miller KM, Maas NL, Roguev A, Fillingham J, et al. (2007) Functional dissection of protein complexes involved in yeast chromosome biology using a genetic interaction map. Nature 446: 806–810.
19. Costanzo M, Baryshnikova A, Bellay J, Kim Y, Spear ED, et al. (2010) The Genetic Landscape of a Cell. Science 327: 425–431.
20. Collins S, Schuldiner M, Krogan N, Weissman J (2006) A strategy for extracting and analyzing large-scale quantitative epistatic interaction data. Genome Biol 7: R63.
21. Grefen C, Lalonde S, Obrdlik P (2007) Split-Ubiquitin System for Identifying Protein-Protein Interactions in Membranes and Full-Length Proteins. Current Protocols in Neuroscience. pp. 5.27.
22. Chun CD, Brown JCS, Madhani HD (2011) A Major Role for Capsule-Independent Phagocytosis-Inhibitory Mechanisms in Mammalian Infection by Cryptococcus neoformans. Cell Host Microbe 9: 243–251.
23. Altschul SF, Madden TL, Schaeffer AA, Zhang J, Zhang Z, et al. (1997) Gapped BLAST and PSI-BLAST: a new generation of protein database search programs. Nucleic Acids Res 25: 3389–3402.
24. Bennett-Lovsey RM, Herbert AD, Sternberg MJE, Kelley LA (2008) Exploring the extremes of sequence/structure space with ensemble fold recognition in the program Phyre. Proteins 70: 611–625.
25. Loftus BJ, Fung E, Roncaglia P, Rowley D, Amedeo P, et al. (2005) The genome of the basidiomycetous yeast and human pathogen Cryptococcus neoformans. Science 307: 1321–1324.
26. Goffeau A, Barrell BG, Bussey H, Davis RW, Dujon B, et al. (1996) Life with 6000 genes. Science 274: 563–567.
27. Hershberg R, Petrov DA (2009) General Rules for Optimal Codon Choice. PLoS Genet 5: e1000556. doi:10.1371/journal.pcbi.1000556
28. Lewis MJ, Pelham HR (2002) A new yeast endosomal SNARE related to mammalian syntaxin 8. Traffic 3: 922–929.
29. Nikko E, Sullivan JA, Pelham HRB (2008) Arrestin-like proteins mediate ubiquitination and endocytosis of the yeast metal transporter Smf1. EMBO Rep 9: 1216–1221.
30. Davis L, Barbera M, McDonnell A, McIntyre K, Sternglanz R, et al. (2001) The Saccharomyces cerevisiae MUM2 Gene Interacts With the DNA Replication Machinery and Is Required for Meiotic Levels of Double Strand Breaks. Genetics 157: 1179–1189.
31. Engebrecht J, Masse S, Davis L, Rose K, Kessel T (1998) Yeast Meiotic Mutants Proficient for the Induction of Ectopic Recombination. Genetics 148: 581–598. 32. Enomoto S, Berman J (1998) Chromatin assembly factor I contributes to the maintenance, but not the re-establishment, of silencing at the yeast silent mating loci. Genes Dev 12: 219–232.
33. Ashrafi K, Farazi TA, Gordon JI (1998) A Role for Saccharomyces cerevisiae Fatty Acid Activation Protein 4 in Regulating ProteinN-Myristoylation during Entry into Stationary Phase. J Biol Chem 273: 25864–25874.
34. Martinez MJ, Roy S, Archuletta AB, Wentzell PD, Anna-Arriola SS, et al. (2004) Genomic Analysis of Stationary-Phase and Exit in Saccharomyces cerevisiae: Gene Expression and Identification of Novel Essential Genes. Mol Biol Cell 15: 5295–5305.
35. Mukai H, Kuno T, Tanaka H, Hirata D, Miyakawa T, et al. (1993) Isolation and characterization of SSE1 and SSE2, new members of the yeast HSP70 multigene family. Gene 132: 57–66.
36. Letunic I, Doerks T, Bork P (2009) SMART 6: recent updates and new developments. Nucleic Acids Res 37: D229–232.
37. Sacher M, Kim Y-G, Lavie A, Oh B-H, Segev N (2008) The TRAPP Complex: Insights into its Architecture and Function. Traffic 9: 2032–2042.
38. Oka T, Krieger M (2005) Multi-Component Protein Complexes and Golgi Membrane Trafficking. J Biochem 137: 109–114.
39. Holthuis JCM, Nichols BJ, Dhruvakumar S, Pelham HRB (1998) Two syntaxin homologues in the TGN/endosomal system of yeast. EMBO J 17: 113–126. 40. Donaldson JG, Finazzi D, Klausner RD (1992) Brefeldin A inhibits Golgi
membrane-catalysed exchange of guanine nucleotide onto ARF protein. Nature 360: 350–352.
41. Helms JB, Rothman JE (1992) Inhibition by brefeldin A of a Golgi membrane enzyme that catalyses exchange of guanine nucleotide bound to ARF. Nature 360: 352–354.
42. Sciaky N, Presley J, Smith C, Zaal KJM, Cole N, et al. (1997) Golgi Tubule Traffic and the Effects of Brefeldin A Visualized in Living Cells. J Cell Biol 139: 1137–1155.
43. Madhani HD, Fink GR (1998) The control of filamentous differentiation and virulence in fungi. Trends Cell Biol 8: 348–353.
44. Deng Y, Bennink JR, Kang HC, Haugland RP, Yewdell JW (1995) Fluorescent conjugates of brefeldin A selectively stain the endoplasmic reticulum and Golgi complex of living cells. J Histochem Cytochem 43: 907–915.
45. Semenza JC, Hardwick KG, Dean N, Pelham HRB (1990) ERD2, a yeast gene required for the receptor-mediated retrieval of luminal ER proteins from the secretory pathway. Cell 61: 1349–1357.
46. Kumar H, Kawai T, Akira S (2011) Pathogen Recognition by the Innate Immune System. Int Rev Immunol 30: 16–34.
48. Chang YC, Kwon-Chung KJ (1999) Isolation, characterization, and localization of a capsule-associated gene, CAP10, of Cryptococcus neoformans. J Bacteriol 181: 5636–5643.
49. Chang YC, Kwon-Chung KJ (1998) Isolation of the Third Capsule-Associated Gene,CAP60, Required for Virulence in Cryptococcus neoformans. Infect Immun 66: 2230–2236.
50. Willment JA, Brown GD (2008) C-type lectin receptors in antifungal immunity. Trends Microbiol 16: 27–32.
51. Levitz SM, DiBenedetto DJ (1989) Paradoxical role of capsule in murine bronchoalveolar macrophage-mediated killing of Cryptococcus neoformans. J Immunol 142: 659–665.
52. Cross CE, Bancroft GJ (1995) Ingestion of acapsular Cryptococcus neoformans occurs via mannose and beta-glucan receptors, resulting in cytokine production and increased phagocytosis of the encapsulated form. Infection and Immunity 63: 2604–2611.
53. Pelham HRB (2002) Insights from yeast endosomes. Curr Opin Cell Biol 14: 454–462.
54. Bowers K, Stevens TH (2005) Protein transport from the late Golgi to the vacuole in the yeast Saccharomyces cerevisiae. Biochim Biophys Acta 1744: 438–454.
55. Ostrowicz CW, Meiringer CTA, Ungermann C (2008) Yeast vacuole fusion. Autophagy 4: 5–19.
56. Raymond CK, Howald-Stevenson I, Vater CA, Stevens TH (1992) Morpho-logical classification of the yeast vacuolar protein sorting mutants: evidence for a prevacuolar compartment in Class Evpsmutants. Mol Biol Cell 3: 1389–1402. 57. Vida TA, Emr SD (1995) A new vital stain for visualizing vacuolar membrane
dynamics and endocytosis in yeast. J Cell Biol 128: 779–792.
58. Schacht J (1978) Purification of polyphosphoinositides by chromatography on immobilized neomycin. J Lipid Res 19: 1063–1067.
59. Lodhi S, Weiner ND, Schacht J (1979) Interactions of neomycin with monomolecular films of polyphosphoinositides. Biochim Biophys Acta 557: 1–8. 60. Mayer A, Scheglmann D, Dove S, Glatz A, Wickner W, et al. (2000) Phosphatidylinositol 4,5-bisphosphate regulates two steps of homotypic vacuole fusion. Mol Biol Cell 11: 807–817.
61. Hua Z, Graham TR (2003) Requirement for Neo1p in retrograde transport from the Golgi complex to the endoplasmic reticulum. Mol Biol Cell 14: 4971– 4983.
62. Wicky S, Schwarz H, Singer-Krueger B (2004) Molecular Interactions of Yeast Neo1p, an Essential Member of the Drs2 Family of Aminophospholipid Translocases, and Its Role in Membrane Trafficking within the Endomembrane System. Mol Cell Biol 24: 7402–7418.
63. Castro IM, Cabral DB, Tro´pia MJM, Almeida FM, Branda˜o RL (2001) Yeast genes YOL002C and SUL1 are involved in neomycin resistance. World J Microbiol Biotechnol 17: 399–402.
64. Prezant TR, Chaltraw WEj, Fischel-Ghodsian N (1996) Identification of an overexpressed yeast gene which prevents aminoglycoside toxicity. Microbiology 142: 3407–3414.
65. Hillenmeyer ME, Fung E, Wildenhain J, Pierce SE, Hoon S, et al. (2008) The Chemical Genomic Portrait of Yeast: Uncovering a Phenotype for All Genes. Science 320: 362–365.
66. Parsons AB, Brost RL, Ding H, Li Z, Zhang C, et al. (2004) Integration of chemical-genetic and genetic interaction data links bioactive compounds to cellular target pathways. Nature Biotechnology 22: 62–69.
67. Sharifpoor S, van Dyk D, Costanzo M, Baryshnikova A, Friesen H, et al. (2012) Functional wiring of the yeast kinome revealed by global analysis of genetic network motifs. Genome Res 22: 791–801.
68. Sopko R, Papp B, Oliver SG, Andrews BJ (2006) Phenotypic activation to discover biological pathways and kinase substrates. Cell Cycle 15: 1397–1402. 69. Del Poeta M (2004) Role of phagocytosis in the virulence of Cryptococcus
neoformans. Eukaryot Cell 3: 1067–1075.
70. Meneghini MD, Wu M, Madhani HD (2003) Conserved Histone Variant H2A.Z Protects Euchromatin from the Ectopic Spread of Silent Heterochro-matin. Cell 112: 725–736.
71. Nagalakshmi U, Wang Z, Waern K, Shou C, Raha D, et al. (2008) The Transcriptional Landscape of the Yeast Genome Defined by RNA Sequencing. Science 320: 1344–1349.
72. Pelechano V, Cha´vez S, Pe´rez-Ortı´n JE (2010) A Complete Set of Nascent Transcription Rates for Yeast Genes. PLoS ONE 5: e15442. doi:10.1371/ journal.pone.0015442
73. Steinmetz EJ, Warren CL, Kuehner JN, Panbehi B, Ansari AZ, et al. (2006) Genome-Wide Distribution of Yeast RNA Polymerase II and Its Control by Sen1 Helicase. Mol Cell 24: 735–746.
74. Bender A (1993) Genetic evidence for the roles of the bud-site-selection genes BUD5 and BUD2 in control of the Rsr1p (Bud1p) GTPase in yeast. Proc Natl Acad Sci U S A 90: 9926–9929.
75. Chant J, Herskowitz I (1991) Genetic control of bud site selection in yeast by a set of gene products that constitute a morphogenetic pathway. Cell 65: 1203– 1212.
76. Dittmar J, Reid R, Rothstein R (2010) ScreenMill: A freely available software suite for growth measurement, analysis and visualization of high-throughput screen data. BMC Bioinformatics 11: 353–363.
77. Albertyn J, Hohmann S, Thevelein JM, Prior BA (1994) GPD1, which encodes glycerol-3-phosphate dehydrogenase, is essential for growth under osmotic stress in Saccharomyces cerevisiae, and its expression is regulated by the high-osmolarity glycerol response pathway. Mol Cell Biol 14: 4135–4144. 78. Cherry JM, Hong EL, Amundsen C, Balakrishnan R, Binkley G, et al. (2012)
Saccharomyces Genome Database: the genomics resource of budding yeast. Nucleic Acids Res 40: D700–D705.