ISSN 1414-431X
www.bjournal.com.br
www.bjournal.com.br
Volume 45 (12) 1102-1340 December 2012
Braz J Med Biol Res, December 2012, Volume 45(12) 1269-1275
10.1590/S0100-879X2012007500141
doi:
Genetic and environmental influences on blood pressure and
physical activity: a study of nuclear families from Muzambinho,
Brazil
C.L.M. Forjaz, T. Bartholomeu, J.A.S. Rezende, J.A. Oliveira, L. Basso, G. Tani, A. Prista and
J.A.R. Maia
Institutional Sponsors
The Brazilian Journal of Medical and Biological Research is partially financed by
Faculdade de Medicina de Ribeirão Preto Campus
Ribeirão Preto
Explore High - Performance MS Orbitrap Technology In Proteomics & Metabolomics
analiticaweb.com.br S C I E N T I F I C
BIOMEDICAL SCIENCES
AND
Genetic and environmental influences on blood
pressure and physical activity: a study of nuclear
families from Muzambinho, Brazil
C.L.M. Forjaz
1, T. Bartholomeu
1, J.A.S. Rezende
3, J.A. Oliveira
2, L. Basso
2,
G. Tani
2, A. Prista
4and J.A.R. Maia
51Laboratório de Hemodinâmica da Atividade Motora (LAHAM), Escola de Educação Física e Esporte, Universidade de São Paulo, São Paulo, SP, Brasil
2Laboratório de Comportamento Motor (LACOM), Escola de Educação Física e Esporte,
Universidade de São Paulo, São Paulo, SP, Brasil 3Escola Superior de Educação Física de Muzambinho, Muzambinho, MG, Brasil 4Faculdade de Educação Física e Desporto, Universidade Pedagógica, Maputo, Moçambique 5CIFI2D, Laboratório de Cineantropometria e Gabinete de Estatística Aplicada,
Faculdade de Desporto, Universidade do Porto, Porto, Portugal
Abstract
Blood pressure (BP) and physical activity (PA) levels are inversely associated. Since genetic factors account for the ob-served variation in each of these traits, it is possible that part of their association may be related to common genetic and/
or environmental influences. Thus, this study was designed to estimate the genetic and environmental correlations of BP
and PA phenotypes in nuclear families from Muzambinho, Brazil. Families including 236 offspring (6 to 24 years) and their 82 fathers and 122 mothers (24 to 65 years) were evaluated. BP was measured, and total PA (TPA) was assessed by an interview (commuting, occupational, leisure time, and school time PA). Quantitative genetic modeling was used to estimate maximal heritability (h2),and genetic and environmental correlations. Heritability was significant for all phenotypes (systolic
BP: h2 = 0.37 ± 0.10, P < 0.05; diastolic BP: h2 = 0.39 ± 0.09, P < 0.05; TPA: h2 = 0.24 ± 0.09, P < 0.05). Significant genetic
(rg) and environmental (re) correlations were detected between systolic and diastolic BP (rg = 0.67 ± 0.12 and re = 0.48 ±
0.08, P < 0.05). Genetic correlations between BP and TPA were not significant, while a tendency to an environmental
cross-trait correlation was found between diastolic BP and TPA (re = -0.18 ± 0.09, P = 0.057). In conclusion, BP and PA are under
genetic influences. Systolic and diastolic BP share common genes and environmental influences. Diastolic BP and TPA are probably under similar environmental influences.
Key words: Exercise; Hypertension; Environmental influence; Heritability; Genetic epidemiology
Introduction
Correspondence: C.L.M. Forjaz, Av. Prof. Mello Moraes, 65, 05508-030 São Paulo, SP, Brasil. Fax: +55-11-3813-5921. E-mail: [email protected]
Received March 10, 2012. Accepted August 22, 2012. Available online September 7, 2012. Published December 17, 2012.
Epidemiological data have shown an inverse relationship between regular physical activity (PA) and blood pressure (BP) (1,2). Vigorous leisure time PA is recognized to reduce by 30% the risk of becoming hypertensive (1,2). However, the linking agents of this association are not completely understood and may be due, in part, to common environ-mental and genetic factors.
Individually taken, PA and BP levels have been shown to be influenced by genetic as well as by environmental factors (3-7). The magnitude of genetic influences on these phenotypes varies. Previous review articles have shown that
heritability (h2 - the fraction of the total phenotypic variance
that is accounted for by genetic factors) for systolic (SBP) and diastolic BP (DBP) ranged from 14 to 68 and from 6 to 62%, respectively (7), while for PA, heritability ranged from 6 to 62% (6). The main explanations for this wide varia-tion are differences in populavaria-tion structures in genetic and environmental terms, sample sizes, experimental designs,
estimation techniques for h2, and phenotype assessment
techniques (6,7).
1270 C.L.M. Forjaz et al.
common genetic influences, i.e., a pleiotropic effect, and/ or to common environmental influences. If this association
can be identified, it offers a potential target for more ef
-ficient and effective strategies for reducing cardiovascular risk and for detecting genes and environmental factors, as well as their possible interaction, related to these two phenotypes.
Family studies provide a suitable design to investigate
genetic and environmental influences not only on the varia
-tion of individual traits, but also on their covaria-tion (8). We were able to identify only one study (4) that addressed this question, and concluded that variability of DBP in adulthood was significantly correlated to subjectively reported physical
exercise done in adolescence (genetic, rg = -0.27 and
envi-ronment, re = -0.18), but not with aerobic exercise intensity
during the entire lifetime. However, the study reported in Ref. 4 was conducted with twins and included only males, which limited generalization of results (9,10). Moreover, only adults over 40 years old were included, which might have weakened the results obtained, since it is known that heritability of many health-related phenotypes, such as BP, decreases with aging (11).
Therefore, the purpose of the present study was to estimate the genetic and environmental correlations of BP and PA phenotypes in nuclear families that consist of two generations: parents and offspring. We investigated SBP and DBP phenotypes, as well as total PA (TPA).
Material and Methods
A volunteer sample of families was recruited from the 10-year-old students who participated in a larger study about growth, maturation, and motor development in Muzambinho (12). The study was approved by the Ethics Committee of Escola de Educação Física e Esporte, Universidade de São Paulo, and written informed consent was obtained from all of the participants. Data were collected between March 2008 and November 2009.
Muzambinho is a small town in the State of Minas Gerais, Brazil, with 19,925 inhabitants in 2007, 5650 of whom are between 5 and 19 years old (13). Its human developmental index is 0.801, and its economy is based on agriculture, livestock, and handicrafts (14).
A total of 210 families were invited to participate, and data were assessed in 138. The two-generation family ranged in size from 3 to 9 subjects, and most of them consisted of 3 (41%) or 4 (41%) members. In some families, mothers and especially fathers did not come for evaluation, and thus the final sample consisted of 82 fathers, 122 mothers, and 236 offspring (126 sons and 110 daughters). Offspring age ranged from 6 to 24 years and parents’ age ranged from 24 to 65 years. Missing values analysis was carried out using SYSTAT 13 (USA) within family structure and missing data distribution was carried out at random, which is essential for the analysis in the present study.
Weight (kg) and height (m) were measured with an
elec-tronic scale (Filizola, Brazil)following standard procedures
and body mass index (BMI) was calculated [weight (kg) /
height (m)2]. Adults were classified as normal if BMI was
≤24.9 kg/m2, as at risk of overweight if 25 ≤ BMI ≤ 29.9 kg/
m2, and as overweight if BMI ≥30 kg/m2 (15). In children
and adolescents, classification was based on CDC centile growth charts, employing BMI <85th percentile as normal, BMI between the 85th and the 95th percentile for the age as overweight, and BMI >95th percentile for the age as obese (16).
BP was measured according to current guidelines (17) with the auscultatory method and aneroid sphygmoma-nometers. Calibrations were carried out daily. In both adults and youths, phases I and V of the Korotkoff’s sound were employed for determining SBP and DBP, respectively. Five different cuff sizes were available, and the most adequate was chosen according to the subject’s arm circumference. BP measurements were made at the same time of day in all of the volunteers, between 7:00 and 9:00 pm, avoid-ing any possible influence of circadian BP variation. BP was measured at least twice, and the average value was calculated. Anti-hypertensive treatment was assessed. Classifications of BP followed the specific criteria for youth and adults (18).
PA was assessed with a specific and culturally mean
-ingful structured direct interview. Family members were all interviewed by the same team member. Main questions regarded their usually commuting PA (how do they move from one place to another: walking, cycling, etc.), occu-pational PA (what do they do for work: domestic chores, rural tasks, deliveries, etc.), and leisure time PA (what do they do during leisure time: cycling, soccer, swimming, gym classes, ballet, physical play games, e.g., tag, hide
and seek, hopscotch, skip rope, and others). In addition,
children were asked about their PA at school (including physical education classes and class intervals). Weekly frequency and duration were assessed for each type of PA. Their product was calculated to generate the weekly volume for each type of PA (min/week), and a TPA volume was obtained by their unweighted sum.
Statistical analysis
Descriptive analysis was done using SPSS. The
inde-pendent t-test or Mann-Whitney test was used for
compari-sons between genders. PEDSTATS (19) was employed for pedigree checks. Phenotypes were adjusted for gender, age,
gender x age, age2, gender x age2, and BP phenotypes were
were computed using the SOLAR 4.0 software (Sequential Oligogenic Linkage Analysis Routines, http://www.sfbr.org, Southwest Foundation for Biomedical Research, USA). The heritability of a trait is the proportion of phenotypic variation
(σp2) that is accounted for by additive genetic effects (σg2),
and is given by h2 = (σg2) / (σp2). In nuclear family studies
without any additional information, only maximal heritability can be estimated, which means the sum of shared genetic and family environmental factors. A bivariate extension of the univariate quantitative genetic procedure, based on the suggestions of Falconer (20) and extended by Almasy et al.
(21), was used to partition the phenotypic relationships (rp)
between two traits into estimate genetic (rg) and
environ-mental (re) correlations between SBP/DBP, SBP/TPA, and
DBP/TPA given by rp = rg√h21√h22 + re√(1 - h21)√(1 - h22).
The significance of h2 was determined using the likelihood
ratio test by comparing the log-likelihood of a model where h2
was estimated against a model where h2 was fixed at zero. A
P value ≤0.05 was considered to be statistically significant.
Results
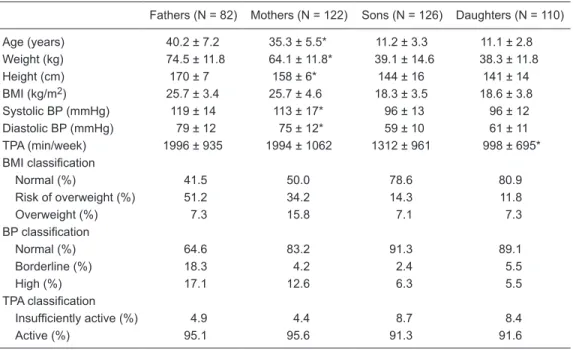
The characteristics of the family’s members are de-scribed in Table 1. Based on the guidelines of the Joint National Committee on Prevention, Detection, Evaluation, and Treatment of High Blood Pressure (18), 24.4% of the parents, and 9.7% (N = 23) of the offspring had BP levels higher than normal (either borderline or high). Eleven
sub-jects were receiving anti-hypertensive medications at the time of assessment. Considering a minimum of 150 min/ week of PA for adults, and 300 min/week of PA for children (22), 95.3% of the parents and 91.5% of the offspring were classified as active (Table 1).
Fathers were significantly older, heavier, taller, and had higher BP levels than mothers. However, both parents had similar TPA levels (Table 1). No differences in anthropometric data or BP were found between male and female youths, while sons had higher levels of TPA than daughters.
The correlations between pairs of family members are shown in Table 2. For SBP, values ranged from -0.11 to 0.36, and were significant for parent-offspring and siblings. For DBP, correlations ranged from 0.21 to 0.25, and were significant for parent-offspring, siblings, and father-mother. For TPA, correlations ranged from 0.12 to 0.39, and were significant for siblings and father-mother.
The heritabilities of each phenotype are shown in Table 3. All were statistically significant and ranged from 0.24 (TPA) to 0.39 (DBP). Similar results were obtained even when excluding from the analysis all subjects with hyper-tensive medication.
Genetic and environmental cross-trait correlations be-tween SBP, DBP, and TPA are shown in Table 4. Genetic cross-trait correlations were significant only between SBP and DBP, while environmental correlations were significant between SBP and DBP and presented a strong tendency to significance between DBP and TPA (P = 0.057).
Table 1. Descriptive information (means ± SD and risk prevalence) about family members.
Fathers (N = 82) Mothers (N = 122) Sons (N = 126) Daughters (N = 110)
Age (years) 40.2 ± 7.2 35.3 ± 5.5* 11.2 ± 3.3 11.1 ± 2.8 Weight (kg) 74.5 ± 11.8 64.1 ± 11.8* 39.1 ± 14.6 38.3 ± 11.8
Height (cm) 170 ± 7 158 ± 6* 144 ± 16 141 ± 14
BMI (kg/m2) 25.7 ± 3.4 25.7 ± 4.6 18.3 ± 3.5 18.6 ± 3.8 Systolic BP (mmHg) 119 ± 14 113 ± 17* 96 ± 13 96 ± 12
Diastolic BP (mmHg) 79 ± 12 75 ± 12* 59 ± 10 61 ± 11
TPA (min/week) 1996 ± 935 1994 ± 1062 1312 ± 961 998 ± 695*
BMI classification
Normal (%) 41.5 50.0 78.6 80.9
Risk of overweight (%) 51.2 34.2 14.3 11.8
Overweight (%) 7.3 15.8 7.1 7.3
BP classification
Normal (%) 64.6 83.2 91.3 89.1
Borderline (%) 18.3 4.2 2.4 5.5
High (%) 17.1 12.6 6.3 5.5
TPA classification
Insufficiently active (%) 4.9 4.4 8.7 8.4
Active (%) 95.1 95.6 91.3 91.6
1272 C.L.M. Forjaz et al.
Discussion
The main findings of the present study were that: a) low, but significant genetic factors explained the variation of SBP and DBP, as well as TPA; b) SBP and DBP cross-trait genetic and environmental influences were significant; c) no such influences were evident for SBP and TPA, while a strong tendency (P = 0.057) to a significant cross-trait environmental correlation was observed between DBP and TPA.
The prevalence of high BP levels calculated in the pres-ent population based on international criteria (18) (24% in adults and 10% in youths) was similar to that reported in previous studies (23-25). In contrast, reported PA levels
classified 95% of the adults and 91% of the youths as ac
-tive, a higher rate than previously reported (26-28). Such a high level of PA might be explained by sociocultural aspects, since in Muzambinho, occupational PA (mainly rural tasks for men and domestic chores for women) was reported by 89% of the adults, and leisure time PA, mainly street games was performed by 92% of the youths.
Moderate prevalence of high BP simultaneously with a high level of PA might seem odd, since an inverse relation-ship is expected between these factors (1,2). However, this relationship may be influenced by physical fitness. Franks et al. (29) observed that PA was not inversely associated with metabolic factors when subjects had high cardiovascular fitness. Other factors, such as nutrition, might be more
Table 2. Phenotypic correlations between different pairs of family members considering their clustering effects.
SBPa DBPb TPAc
Father-mother -0.113 ± 0.124 (0.3740) 0.241 ± 0.119* (0.0500) 0.393 ± 0.001* (0.0006) Parent-offspring 0.171 ± 0.058* (0.0039) 0.251 ± 0.059* (0.0000) 0.115 ± 0.069 (0.0991) Siblings 0.355 ± 0.097* (0.0008) 0.209 ± 0.101* (0.0457) 0.335 ± 0.098* (0.0016)
Data are reported as estimate ± SE with P values in parentheses. SBP = systolic blood pressure; DBP = diastolic blood pressure; TPA = total physical activity. *P < 0.05. aPreviously adjusted for significant influence of age, gender, gender x age2, height, and drug. bPreviously adjusted for significant influence of age, gender, gender x age2, height, and drug. cPreviously adjusted for significant influence of age, and gender x age.
Table 3. Maximal heritability (h2; estimate ± SE) of systolic blood pressure (SBP), diastolic blood pressure (DBP), and total physical activity (TPA).
Phenotype h2 P Covariates Proportion of variance
explained by covariates
SBP 0.37 ± 0.10 <0.01 Age, gender, gender x age2, height, drug 0.48 DBP 0.39 ± 0.09 <0.01 Age, gender, gender x age2, height, drug 0.46
TPA 0.24 ± 0.09 <0.01 Age, gender x age 0.15
Table 4. Genetic and environmental correlations (estimate ± SE) obtained between systolic blood pressure (SBP), diastolic blood pressure (DBP) and total physical activity (TPA).
Genetic correlations Environmental correlations
SBP DBP TPA SBP DBP TPA
SBP -
-DBP 0.67 ± 0.12* - 0.48 ± 0.08*
-TPA -0.08 ± 0.24 0.05 ± 0.23 - -0.04 ± 0.10 -0.18 ± 0.09+
important in these cases.
Genetic factors explained 37 and 39% of SBP and DBP variation in the Muzambinho population. Similar values were reported in Chinese (30) and Brazilian (5) samples. Further-more, genetic factors explained 24% of the variance in TPA, which is within the range of reported values for different PA phenotypes (6). However, the present heritability estimates differed from those obtained in the Baependi Heart Study (31,32) that investigated another city from the same Brazil-ian state (26% for SBP and DBP, and 11 to 35% for distinct PA indexes). Differences in study design (nuclear families
vs extended families), sample characteristics (children and
adults vs only adults), covariates used and ways to map
PA may explain the differences.
The heritability indexes evaluated in the present study represent the upper-limit heritabilities (10). Nuclear families share not only genes but also a common environment, and without additional information, the heritability calculated for these families represents the sum of these influences. In this study, common environment should have had an important influence because correlations between father and mother were significant for DBP and TPA. Thus, the heritability index calculated probably overestimated the true genetic influence.
The main aim of this study was to analyze the cross-trait genetic and environmental correlations. As expected (3), these correlations were significant between SBP and DBP, which shows that these traits share common genes and environ-mental conditions. Nevertheless, the main novelty of the study was the analysis of genetic and environmental co-influences on BP and TPA. This analysis showed no pleiotropy between
these traits (rg = -0.08 and rg = 0.05 SBP/TPA and DBP/TPA,
respectively), which implies that they were under different genetic influences. In contrast, a tendency to a significant cross-trait environmental correlation was observed between
DBP and TPA (re = -0.18, P = 0.057), strongly suggesting that
these traits may share common environmental influences that had opposite effects on these phenotypes, increasing TPA and decreasing BP or vice versa.
The failure to detect a clear cross-trait correlation be-tween TPA and DBP might be explained by the large age range of the offspring combined with the fact that familial resemblance for BP varies with age and may peak around age 30, decreasing in younger family members (33,34). Most of the offspring in the present study (64%) were 8 to 12 years old. Thus, the observation of a tendency at this age may really represent an important influence.
The absence of pleiotropy between PA and BP is op-posite to findings reported by Hernelahti et al. (4). However, in that study, correlation was observed between reported PA at adolescence and DBP measured at 40 years of age,
and the estimated rg was low, r = 0.27. In addition,
simi-lar to the present results, these authors did not observe any pleiotropic effect when other phenotype of PA was analyzed. Taken together, these results may suggest that
common genetic influences on BP and PA may be linked to some chronological life-course events, namely different PA modalities, intensities, duration, and their associations with susceptibility genes that may evidence the presence of incomplete pleiotropy.
The present finding that TPA and DBP may be influ
-enced by common environmental factors has important clinical implications since it gives scientific support to the search for environmental interventions that simultaneously increase PA levels and decreases BP, preventing hyper-tension. Nutritional factors may be a strong candidate for this influence since unhealthy nutrition is associated with higher BP levels (35) and lower PA (36,37). In addition, a healthy diet has resulted in lower BP levels and higher PA levels (38).
Environmental cross-trait correlation was suggested be-tween PA and DBP but not SBP. Exercise hypotensive effect is primarily related to an increase in vasodilatory capacity (39) that may result in a decrease in DBP and may also facilitate muscle metabolism, improving performance.
It may be argued that the sample size of the present study was not big enough to detect the pleiotropic effect. However, it was similar to previous reports (40), and rep-resented 2.2% of the Muzambinho’s population. Although antihypertensive use might be a confounding factor, only 11 parents were receiving these agents, and an analysis without them revealed similar results. Another caveat is the way PA was assessed. Since no previous knowledge of PA patterns of this population was available, a structured open interview was required. However, interviews are open to some degree of inaccuracy but were usually employed in previous studies (4). Finally, the Muzambinho population studied here was very active, which might limit extrapola-tion of the results to other samples. However, many small cities in Brazil preserve the old PA habits and deserve to be investigated. In this context, the present study highlighted an important issue by showing that even in these very active samples, cardiovascular risk is high, and some environmen-tal factors may influence both PA and DBP.
In conclusion, SBP, DBP, and TPA were under signifi
-cant genetic influences. SBP and DBP shared part of the genetic and environmental influences, while no pleiotropy was evident between BP and TPA. However, environmental influences on DBP and TPA may be similar.
Acknowledgments
1274 C.L.M. Forjaz et al.
References
1. Fagard RH. Physical activity, physical fitness and the inci -dence of hypertension. J Hypertens 2005; 23: 265-267. 2. Pescatello LS, Franklin BA, Fagard R, Farquhar WB, Kelley
GA, Ray CA. American College of Sports Medicine position stand. Exercise and hypertension. Med Sci Sports Exerc 2004; 36: 533-553.
3. Cui J, Hopper JL, Harrap SB. Genes and family environment explain correlations between blood pressure and body mass index. Hypertension 2002; 40: 7-12.
4. Hernelahti M, Levalahti E, Simonen RL, Kaprio J, Kujala UM, Uusitalo-Koskinen AL, et al. Relative roles of heredity and physical activity in adolescence and adulthood on blood pressure. J Appl Physiol 2004; 97: 1046-1052.
5. Krieger H, Morton NE, Rao DC, Azevedo E. Familial deter-minants of blood pressure in northeastern Brazil. Hum Genet 1980; 53: 415-418.
6. Chaves RN, Souza MC, Santos D, Garganta R, Seabra A, Maia JAR. Agregação familiar nos níveis de atividade física: um resumo do estado da arte. Rev Bras Ativ Física Saúde 2010; 15: 19-26.
7. Fermino RC, Seabra A, Garganta R, Maia JAR. Genetic factors and variability in blood pressure: a brief literature review. Rev Bras Cineantropom Desempenho Hum 2009; 11: 341-349.
8. Lynch M, Walsh B. Genetics and analysis of quantitative traits. Sanderland: Sinauer Associates; 1998.
9. Bouchard C, Malina RM, Pérusse L. Genetics of fitness and physical performance. Champaign: Human Kinetics; 1997. 10. Burton PR, Tobin MD, Hopper JL. Key concepts in genetic
epidemiology. Lancet 2005; 366: 941-951.
11. Chen W, Srinivasan SR, Bao W, Berenson GS. The mag-nitude of familial associations of cardiovascular risk factor
variables between parents and offspring are influenced by
age: the Bogalusa Heart Study. Ann Epidemiol 2001; 11: 522-528.
12. Basso L, Junior CM, Oliveira JA, Forjaz CLdM, Souza JAd, Prista A, et al. Crescimento e desenvolvimento motor de escolares de Muzambinho: um estudo com implicações acadêmicas, sociais e de política interinstitucional. Rev Port Cien Desp 2009; 9: 247-257.
13. Instituto Brasileiro de Geografia e Estatística. Censo da Edu-cação Superior. Brasília: Instituto Brasileiro de Geografia e Estatística; 2007.
14. Instituto Brasileiro de Geografia e Estatística. Censo Popu-lacional 2010. Brasília: Instituto Brasileiro de Geografia e Estatística; 2010.
15. World Health Organization. Diet, nutrition and the prevention of chronic diseases. Genebra: World Health Organization; 2003.
16. Kuczmarski RJ, Ogden CL, Guo SS, Grummer-Strawn LM, Flegal KM, Mei Z, et al. 2000 CDC Growth Charts for the United States: methods and development. Vital Health Stat 11 2002; 246: 1-190.
17. Williams JS, Brown SM, Conlin PR. Videos in clinical medi-cine. Blood-pressure measurement. N Engl J Med 2009; 360: e6.
18. Chobanian AV, Bakris GL, Black HR, Cushman WC, Green LA, Izzo JL Jr, et al. The Seventh Report of the Joint National Committee on Prevention, Detection, Evaluation, and
Treat-ment of High Blood Pressure: the JNC 7 report. JAMA 2003; 289: 2560-2572.
19. Wigginton JE, Abecasis GR. PEDSTATS: descriptive sta-tistics, graphics and quality assessment for gene mapping data. Bioinformatics 2005; 21: 3445-3447.
20. Falconer DS. Introduction to quantitative genetics. Harlow:
Longman Scientific & Technical; 2005.
21. Almasy L, Dyer TD, Blangero J. Bivariate quantitative trait linkage analysis: pleiotropy versus co-incident linkages. Genet Epidemiol 1997; 14: 953-958.
22. American College of Sports Medicine. ACSM’s Guidelines for exercise testing and prescription. Philadelphia: Lippincott
Williams & Wilkins; 2010.
23. [IV Brazilian guidelines in arterial hypertension]. Arq Bras Cardiol 2004; 82 (Suppl 4): 7-22.
24. Candido AP, Benedetto R, Castro AP, Carmo JS, Nicolato RL, Nascimento-Neto RM, et al. Cardiovascular risk fac-tors in children and adolescents living in an urban area of Southeast of Brazil: Ouro Preto Study. Eur J Pediatr 2009; 168: 1373-1382.
25. Coronelli CL, de Moura EC. [Hypercholesterolemia and its risk factors among schoolchildren]. Rev Saúde Pública 2003; 37: 24-31.
26. Dumith SC. Physical activity in Brazil: a systematic review. Cad Saúde Pública 2009; 25 (Suppl 3): S415-S426. 27. Hallal PC, Bertoldi AD, Goncalves H, Victora CG.
[Preva-lence of sedentary lifestyle and associated factors in ado-lescents 10 to 12 years of age]. Cad Saúde Pública 2006; 22: 1277-1287.
28. Silva MA, Rivera IR, Ferraz MR, Pinheiro AJ, Alves SW, Moura AA, et al. Prevalence of cardiovascular risk factors in child and adolescent students in the city of Maceió. Arq Bras Cardiol 2005; 84: 387-392.
29. Franks PW, Ekelund U, Brage S, Wong MY, Wareham NJ. Does the association of habitual physical activity with the
metabolic syndrome differ by level of cardiorespiratory fit -ness? Diabetes Care 2004; 27: 1187-1193.
30. Gu D, Rice T, Wang S, Yang W, Gu C, Chen CS, et al. Heritability of blood pressure responses to dietary sodium and potassium intake in a Chinese population. Hypertension 2007; 50: 116-122.
31. Horimoto AR, Giolo SR, Oliveira CM, Alvim RO, Soler JP, de Andrade M, et al. Heritability of physical activity traits in Brazilian families: the Baependi Heart Study. BMC Med Genet 2011; 12: 155-163.
32. de Oliveira CM, Pereira AC, de Andrade M, Soler JM, Krieger JE. Heritability of cardiovascular risk factors in a Brazilian population: Baependi Heart Study. BMC Med Genet 2008; 9: 32-39.
33. Province MA, Rao DC. A new model for the resolution of cultural and biological inheritance in the presence of tem-poral trends: application to systolic blood pressure. Genet Epidemiol 1985; 2: 363-374.
34. Province MA, Tishler P, Rao DC. Repeated-measures model for the investigation of temporal trends using longitudinal family studies: application to systolic blood pressure. Genet Epidemiol 1989; 6: 333-347.
sodium and the Dietary Approaches to Stop Hypertension (DASH) diet. DASH-Sodium Collaborative Research Group. N Engl J Med 2001; 344: 3-10.
36. Cho ER, Shin A, Lim SY, Kim J. Dietary patterns and their associations with health behaviours in Korea. Public Health Nutr 2011; 14: 356-364.
37. Charreire H, Kesse-Guyot E, Bertrais S, Simon C, Chaix B, Weber C, et al. Associations between dietary patterns, physical activity (leisure-time and occupational) and televi-sion viewing in middle-aged French adults. Br J Nutr 2011; 105: 902-910.
38. Panunzio MF, Caporizzi R, Antoniciello A, Cela EP, Fergu-son LR, D’Ambrosio P. Randomized, controlled nutrition
education trial promotes a Mediterranean diet and improves anthropometric, dietary, and metabolic parameters in adults. Ann Ig 2011; 23: 13-25.
39. Cornelissen VA, Fagard RH. Effects of endurance training on blood pressure, blood pressure-regulating mechanisms, and cardiovascular risk factors. Hypertension 2005; 46: 667-675.