Predicting performance of soybean populations using genetic distances
estimated with RAPD markers
Paulo Augusto Vianna Barroso
1, Isaias Olívio Geraldi
2, Maria Lúcia Carneiro Vieira
2,
Carlos Eduardo Pulcinelli
3, Roland Vencovsky
2and Carlos Tadeu dos Santos Dias
4 1Embrapa-Algodão, Campina Grande, PB, Brazil.
2
Universidade de São Paulo, ESALQ, Departamento de Genética, Piracicaba, SP, Brazil.
3
Embrapa-Soja, Londrina, PR, Brazil.
4
Universidade de São Paulo, ESALQ, Departamento de Ciências Exatas, Piracicaba, SP, Brazil.
Abstract
In order to verify whether genetic distance (GD) is associated with population mean (PM), genetic variance (GV) and the proportion of superior progenies generated by each cross in advanced generations of selfing (PS), the genetic distances between eight soybean lines (five adapted and three non-adapted) were estimated using 213 polymorphic RAPD markers. The genetic distances were partitioned according to Griffing’s Model I Method 4 for diallel analysis, i.e., GDij= GD + GGDi+ GGDj+ SGDij. Phenotypic data were recorded for seed yield and plant height for 25 out of 28 populations of a diallel set derived from the eight soybean lines and evaluated from F2:8to F2:11generations. No significant correlation for seed yield was detected between GD and GV, while negative correlations were detected between GD and PM and between GD and PS (r = -0.74** and -0.75**, respectively). Similar results were observed for the correlation between GGDi + GGDj and PM and between GGDi + GGDjand PS (r = -0.78** and -0.80**, respectively). No significant correlation was detected for plant height. The magnitudes of the correlations for seed yield were high enough to allow predictions of the potential of the populations based on RAPD markers.
Key words:soybean, genetic distance, molecular markers, RAPD, prediction. Received: January 27, 2000; Accepted: May 29, 2003.
Introduction
Selection in soybean breeding programs is carried out in endogamic populations obtained by artificial hybridiza-tion followed by several generahybridiza-tions of selfing. Several endogamic populations are obtained and evaluated annu-ally, but not all of them have sufficient potential to produce genotypes with superior performance. Previous knowledge of the potential of a population may greatly increase the ef-ficiency of plant breeding programs, permitting the early elimination of unpromising populations or even the avoid-ance of their formation. Several methodologies have been proposed to predict the performance of quantitative traits in endogamic soybean populations, with some of these meth-odologies being based on estimates of genetic variance in early generations (Toledo, 1987; Triller and Toledo, 1996) or on the mean components obtained from diallel crosses
(Pulcinelli, 1997). However, such methodologies can only be employed when the populations have already been ob-tained and after intermediate endogamy levels have been achieved, so although the predictions are effective they re-quire a significant amount of time and effort to produce.
The genetic diversity among the potential parental lines may supply useful data on derived endogamic popula-tions. The coefficient of parentage (CP) is the most frequent estimator of genetic diversity in soybean breeding pro-grams and measures the quantity of loci occupied by alleles identical by descent. This information is obtained from the genealogies of the lines, but the CP is not a suitable mea-sure when the genealogies of the parental lines are incom-plete or even unknown.
Genetic distance (GD) based on DNA markers mea-sures the quantity of loci occupied by specific marker al-leles alike in state and is a wider measure of the diversity than the CP and can be obtained for any set of lines. In the-ory, genetic distance based on molecular markers has a greater potential for predicting the performance of soybean populations, but the literature shows an apparent depend-ence on the population set used (Helmset al., 1997; Kisha
Send correspondence to I.O.Geraldi. Departamento de Genética, ESALQ /USP, Caixa Postal 83, 13.400-970 Piracicaba, SP, Brazil. E-mail: [email protected]. Part of the thesis submitted by the first author in partial fulfillment of the requirement for the Doctor de-gree at ESALQ/USP.
et al., 1997; Manjarrez-Sandovalet al., 1997). The study reported in the current paper was carried out to verify whether the genetic distance based on RAPD markers is useful for predicting the performance of soybean popula-tions derived from two-way crosses for a set of parents that include adapted and non-adapted inbred lines, in a diallel scheme.
Material and Methods
RAPD markers
RAPD markers were obtained for eight soybean lines, five lines [Gaúcha (1), LA-4910-215 (2), OC-79230 (3), BR-80-8858 (4) and BR-80-14853 (5)] that are lines adapted to Brazilian conditions, with seed yield similar to cultivars recommended for the Brazilian state of São Paulo, while three lines [123439 (6), 165896 (7) and PI-239235 (8)] were non-adapted lines from a North American germplasm bank.
About 500 mg of leaf tissue was used to extract and purify genomic DNA (Rogers and Bendich, 1985), which was quantified in 0.8% (w/v) agarose gels by comparison with known quantities of the lambda phage DNA. Amplifi-cation reactions were carried out in medium containing PCR buffer (10 mM Tris-HCl pH 8.3, 50 mM KCl), 4 mM of MgCl2, 0.2µM primer, 1.5 units of Taq DNA
polymer-ase, 0.2 mM of dNTP and genomic DNA from the soybean lines (Vieiraet al., 1997). Ninety-six primers from the A, B, C, D, E, and F kits of a commercial supplier (Operon Tech-nologies) were used. Forty-five amplification series were carried out after the initial denaturation at 94 °C for 5 min, with each cycle consisting of DNA denaturation at 94 °C for 1 min, primer annealing at 35 °C for 1 min and DNA amplification at 72 °C for 2 min with a 5 min extension at 72 °C at the end of the 45 cycles. Two concentrations of genomic DNA (40 ng and 60 ng) were used for each geno-type/primer combination and only the results confirmed in both reactions were considered in the genotype analysis. Amplification products were separated by electrophoresis in 1.4% (w/v) agarose gel, using TBE buffer (0.09 M Tris, 0.09 M boric acid and 2 mM EDTA), and the gels were stained with ethidium bromide and evaluated under UV light.
Marker analysis
Genetic distance estimates were obtained by evaluat-ing markers polymorphic for at least one line, and the ge-netic similarity between lines was calculated using the Simple Matching (SM) coefficient (Sneath and Sokal, 1973) and converted to genetic distance (GD), with GD = 1 - SM. Resampling was carried out by bootstrapping to check if the number of polymorphic markers was suffi-cient to supply precise estimates of the genetic distances (Tivanget al. 1994). Sample size and mean coefficient of variation were used in the construction of a scatter-plot.
The genetic distances (GD) for the 28 combinations were partitioned into a mean component (GD), a general component (general genetic distance, GGD) and a specific component (specific genetic distance, SGD) according to Griffing’s Model I Method 4, for diallel analysis, i.e.
GDij = GD + GGDi+ GGDj+ SGDij (Melchingeret al.,
1990).
Correlation between population parameters and diversity estimates based on RAPD analysis
Pearson correlation coefficients were calculated for GD, the sum of the general genetic distances (GGDi +
GGDj) and the SGD with the population mean (PM), the
genetic variance (GV) and the proportion of progenies with the mean above the general population mean (PS), for seed yield and plant height at maturity. The seed yield and plant height phenotypic data were obtained by Pulcinelli (1997) in a population set comprised of 25 out of 28 populations derived from two-way crosses among the eight parents (in-complete diallel set, since the crosses 1x4, 2x7 and 3x4 were not available). The populations were derived from F2
plants according to the “bulk within progenies method” for six generations. The evaluation trials were carried out from the F2:8to F2:11generations (four years) in a 5x5 triple lattice
design, each generation being represented by a random sample of 20 progenies. Therefore, plots consisted of 20 progenies, each one represented by one 1.0 m long row spaced by 0.5 m, with 17 plants after thinning. Data were recorded for each row (sub-plots) for the traits seed yield and plant height at maturity. The analysis of variance was performed on a plot-mean basis for each year and combined across the four years. For each cross (population) data of population mean (PM), genetic variance among progenies (GV) and the proportion of superior progenies (PS) were estimated. The percentage of progenies with the mean above the general mean of all crosses (general population mean) from the combined analysis was considered for PS.
Results and Discussion
Parental line analyses using RAPD markers
Analysis of the eight parental lines with the 96 prim-ers resulted in 213 polymorphic markprim-ers out of a total of 1,139 RAPD markers, a polymorphism rate of 18.7%. The mean number of loci sampled per primer was 11.87 and the mean polymorphism was 2.22. The mode of the number of polymorphic loci sampled by the primers was two, with ex-tremes of zero and seven.
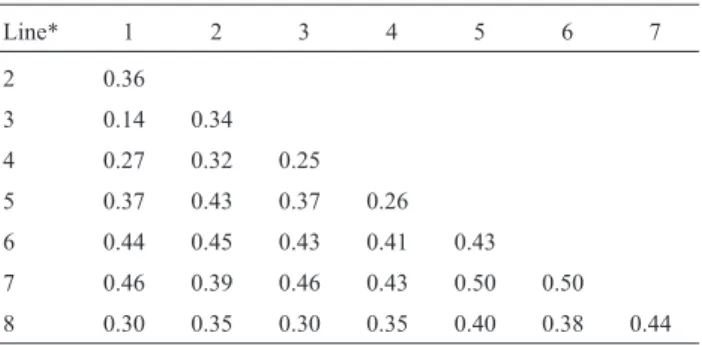
The genetic distances (GD) between soybean lines have shown that the smallest GD (0.14) was between Gaú-cha and OC-79230 lines while the greatest GD (0.50) was between BR-80-14853 and PI-165896 lines and between PI-123439 and PI-165896 lines (Table 1).
the number of markers increased, as expected. The de-crease was at a rate of more than 0.5% up to 103 markers, with the CV reaching about 5% with 213 markers, indicat-ing that this was a sufficient number to obtain reliable GD estimates between the eight lines.
The general genetic distance estimates (GGD) were usually greater than the specific genetic distance estimates (SGD), although the SGD was higher than the GGD in some combinations,e.g.Gaúcha and OC-79230 (Table 2). Since GGD accounted for 74% and SGD for 26% of the GD variability (data not shown), the greater part of the variabil-ity measured by the markers was due to the GGD.
Correlation between genetic distances and genetic variances
Table 3 shows that GD and SGD were not good pre-dictors of the genetic variance (GV) of the populations, with non-significant correlation coefficients for seed yield and plant height for most of the generations. There was a week correlation (p < 0.05) for plant height in the F2:9
gen-eration, but the magnitude (0.44) is not useful in predicting the population genetic variances. Other studies carried out on soybeans show that the magnitude of the correlation
be-tween GD as estimated by molecular markers and GV de-pends on the population set and the environmental condi-tions under which the GV is estimated (Helmset al. 1997; Kishaet al., 1997; Manjarrez-Sandovalet al., 1997).
The GV estimates showed broad confidence intervals (Pulcinelli, 1997) and, according to Gumberet al. (1999), the error associated with such estimates may cause the lack of correlation with GD. Natural selection in the selfing gen-erations may also have caused bias in the estimates and it is possible that the present errors and bias may have changed the magnitude of the GV estimates so that the correlation with the GD could not be detected.
It is assumed that the GD based on RAPD markers provides data covering the whole genome (Ferreira and Grattapaglia, 1998) and that GV is composed exclusively of quantitative trait loci (QTL) effects which are segregat-ing in the populations. Since the distribution of RAPD markers and QTLs responsible for GV might be different, it is probable that some of the QTLs are not linked to any marker and some of the markers are unlinked to QTLs. The-oretical studies have shown that when this occurs there is a reduction in the association between GD and heterosis
Figure 1- Mean coefficients of variation of the genetic distances between lines, estimated by the bootstrap procedure for different marker sample sizes.
Table 1- Genetic distances (GD) between soybean lines.
Line* 1 2 3 4 5 6 7
2 0.36
3 0.14 0.34
4 0.27 0.32 0.25
5 0.37 0.43 0.37 0.26
6 0.44 0.45 0.43 0.41 0.43
7 0.46 0.39 0.46 0.43 0.50 0.50
8 0.30 0.35 0.30 0.35 0.40 0.38 0.44
*1: Gaúcha, 2: LA-4910-215, 3: OC-79230, 4: 8858, 5: BR-80-14853, 6: PI-123439, 7: PI-165896 and 8: PI-239235.
Table 2- Mean component (GD), general genetic distance (GGDi) for each line and specific genetic distance (SGDij) between lines.
SGDij
GGDi 1* 2 3 4 5 6 7
GD 0.376
1 -0.051
2 0.001 0.035
3 -0.059 -0.131 0.020
4 -0.056 -0.002 -0.002 -0.008
5 0.023 0.018 0.028 0.031 -0.077
6 0.068 0.048 0.001 0.042 0.020 -0.035
7 0.092 0.038 -0.074 0.051 0.020 0.012 -0.034
8 -0.018 -0.007 -0.007 -0.004 0.050 0.023 -0.041 -0.013
*1: Gaúcha, 2: LA-4910-215, 3: OC-79230, 4: 8858, 5: BR-80-14853, 6: PI-123439, 7: PI-165896 and 8: PI-239235.
Table 3- Correlation coefficients between genetic variances (GV) and ge-netic distances (GD) and specific gege-netic distances (SGD) for seed yield and plant height, for F2:8to F2:11soybean generations and for the combined analysis.
Seed yield Plant height
Generation GD SGD GD SGD
F2:8 -0.13 -0.10 0.10 0.25
F2:9 -0.20 -0.32 0.44* 0.30
F2:10 -0.05 -0.26 0.35 0.26
F2:11 0.19 -0.05 0.35 0.13
Combined -0.04 -0.15 0.37 0.31
(Bernardo, 1992; Charcosset and Essioux, 1994), which should be valid for genetic variances as well. It is probable that GV can only be predicted if the diversity estimate is ob-tained by markers linked to segregating QTLs rather than by a set of markers obtained by a random sampling of the genome (Helmset al., 1991).
Correlation between genetic distances and population means
The correlation between plant height and GD and be-tween plant height and GGDi+ GGDjwas very low for all
generations and in the combined analysis (Table 4). How-ever, for seed yield these correlations were very high and negative (r = -.074** and -0.78**, respectively in the com-bined analysis). Genetic distance tended to be low between adapted lines, intermediate between the adapted lines and the non-adapted lines and high between non-adapted lines themselves (Table 1). Pulcinelli (1997) found that seed yield generally was greater in populations derived from adapted parents, intermediate when one of the parents was adapted and the other non-adapted, and lower when both parents were non-adapted. The negative correlation with mean seed yield found in the present study may be ex-plained by the two types of parents (adapted and non-adapted) used to develop the populations.
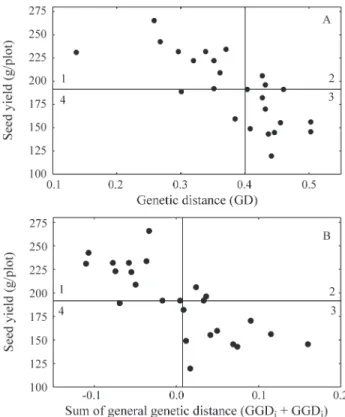
Figure 2A shows the relationship between seed yield and genetic distances (GD), while 2B shows the relation-ship between seed yield and the sum of the general genetic distances (GGDi+ GGDj). The graphs were divided into
quadrants based on the median for seed yield and GD (Fig-ure 2A) or the median for seed yield and GGDi+ GGDj
(Figure 2B). Using the median of the diversity estimates as selection limits, the populations selected fall in the rants 1 and 4 and the unselected populations fall in quad-rants 2 and 3. Populations with mean seed yield equal or higher than the median yield value were plotted in quad-rants 1 and 2. Considering that it is desirable to keep only those populations that yielded equal or more than the me-dian, those populations that fall into quadrants 2 and 4 would be mis-unselected or mis-selected, respectively, if
the selection were based on GD. Figure 2A shows 19 popu-lations in quadrants 1 and 3, while Figure 2B shows 21 pop-ulations in the same quadrants, indicating that GD and GGDi+ GGDjcan be used as indicators of the potential of
the populations. It therefore seems that selections based on GGDi+ GGDjwere somewhat superior to those based on
GD. Although these differences were small they were enough to slightly improve the predictive capacity. It should be pointed out, however, that this conclusion is re-stricted to this population set, and more studies are needed to verify whether or not the use of GGDi+GGDjprovides
any advantage.
Correlation between genetic diversity and population mean are not usually estimated because it is generally thought that genetic diversity can predict the variance but not the mean. However, when soybean populations are de-rived from adapted and non-adapted genotypes the mean is often considered more important than the variance in deter-mining the potential of the populations (Aschoener and Fehr, 1979; Velloet al. 1984; Inindaet al. 1996). It seems that there is a strong tendency for the alleles present in adapted lines to contribute to increase mean seed yield of the populations, while alleles present in non-adapted lines seem to decrease yields. In the specific case of soybean in Brazil, the genetic base of the adapted materials is narrow (Hiromoto and Vello, 1986) and the high degree of
parent-Table 4- Correlation coefficients between population means (PM) and genetic distances (GD) and the sum of general genetic distances (GGDi+ GGDj) for seed yield and plant height, for F2:8to F2:11soybean generations and for the combined analysis.
Seed yield Plant height
Generation GD GGDi+ GGDj GD GGDi+ GGDj
F2:8 -0.61** -0.62** 0.09 0.03
F2:9 -0.64** -0.64** 0.09 0.07
F2:10 -0.77** -0.83** 0.04 -0.10
F2:11 -0.77** -0.83** -0.05 -0.02
Combined -0.74** -0.78** 0.05 0.00
**Significant at p = 0.01.
age between the genotypes leads to smaller genetic dis-tances. When both these factors are present it is probable that the estimates of parental diversity and population means are correlated.
Correlation between genetic distances and the proportion of superior progenies
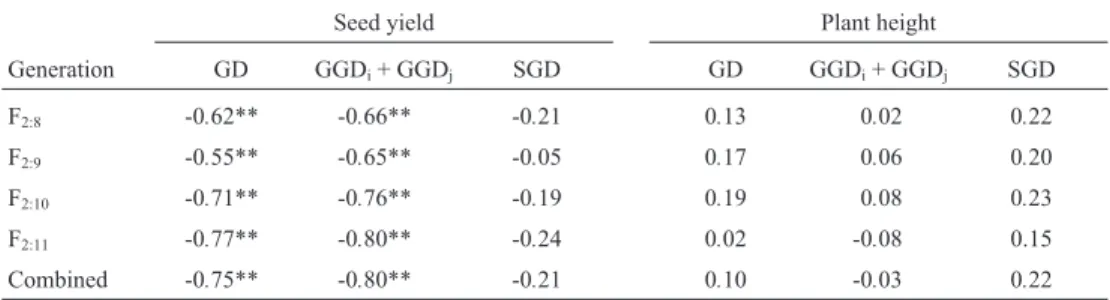
Although no correlations were found for plant height, the proportion of superior progenies for seed yield was highly correlated with GD and GGDi+ GGDj, but not with
SGD (Table 5). The GD and GGDi+GGDjcorrelations for
seed yield were negative (r = -0.75** and -0.80**, respec-tively in the combined analysis) and similar to those ob-tained with the population means (Table 4), while the SGD correlations were similar to those obtained with the genetic variances (Table 3). This is a strong indication that the pop-ulation potential was determined almost exclusively by the mean and that the genetic variance had little influence.
The GD and the GGDi+ GGDjcorrelations were high
enough for reliable prediction of the seed yield of the popu-lations. Both GD and GGDi+ GGDjpredict that some
pop-ulations derived from crosses between adapted and non-adapted parents may have greater potential for breed-ing purposes than populations obtained exclusively from adapted parents. This is an important characteristic of this population set, since the populations derived from the OC-79230 X PI-239235 (3x8) and BR-80-8858 X PI-239235 (4x8) crosses were among the five populations with the highest proportion of progenies with superior seed yield (Pulcinelliet al., 1997).
Figure 3 shows the relationship between the propor-tion of superior progenies for seed yield and GD (Figure 3A) and the proportion of superior progenies and GGDi+ GGDj (Figure 3B). The correlation was a little
stronger for GGDi+ GGDjsince only one population falls
outside quadrants 1 and 3, while for GD three populations fall outside these quadrants. These results are similar to those obtained for the correlation between genetic distances and seed yield (Figure 2). Therefore, the small increases in the correlation coefficients which occurred after separating
the different genetic distance components were sufficient to increase the predictive capacity for estimating the seed yield potential of the populations.
These results show that genetic distance and general genetic distance as analyzed by RAPD marker analysis were able to predict the seed yield potential of soybean crosses, for the population mean and the proportion of su-perior progenies, but not for plant height at maturity. It is probable that populations with similar characteristics can have their potential predicted by genetic diversity esti-mates.
Figure 3- Relationship between the proportion of superior progenies for seed yield as estimated in the combined analysis with (A) genetic dis-tances (GD) and (B) the sum of general genetic disdis-tances (GGDi+ GGDj). Quadrants are numbered 1-4 (see text for explanations).
Table 5- Correlation coefficients between the proportion of superior progenies (PS) and genetic distances (GD), the sum of general genetic distances (GGDi+ GGDj) and specific genetic distances (SGD) for seed yield and plant height at maturity, for F2:8to F2:11soybean generations and for the combined analysis.
Seed yield Plant height
Generation GD GGDi+ GGDj SGD GD GGDi+ GGDj SGD
F2:8 -0.62** -0.66** -0.21 0.13 0.02 0.22
F2:9 -0.55** -0.65** -0.05 0.17 0.06 0.20
F2:10 -0.71** -0.76** -0.19 0.19 0.08 0.23
F2:11 -0.77** -0.80** -0.24 0.02 -0.08 0.15
Combined -0.75** -0.80** -0.21 0.10 -0.03 0.22
Acknowledgments
The authors are grateful to CAPES for the grant to the first author, to the biologist Carlos Alberto de Oliveira for his help in obtaining the laboratory data and to Dr. Vera Maria Quecini for the reviewing of the English text.
References
Bernardo R (1992) Relationship between single-cross perfor-mance and molecular markers heterozigosity. Theor Appl Genet 83:628-634.
Charcosset A and Essioux L (1994) The effect of population struc-ture on the relationship between heterosis and heterozy-gosity at marker loci. Theor Appl Genet 89:336-343. Ferreira ME and Grattapaglia D (1998) Introdução ao uso de
marcadores moleculares em análise genética. Embrapa, Bra-sília, 220 p.
Gumber RK, Schill B, Link W, Kittlitz EV and Melchinger, AE (1999) Mean, genetic variance, and usefulness of selfing progenies from intra- and inter pool crosses in faba beans (Vicia fabaL.) and their prediction from parental parame-ters. Theor Appl Genet 98:569-580.
Helms T, Orf J and McClean P (1997) Genetic variance, coeffi-cient of parentage, and genetic distance of six soybean popu-lations. Theor Appl Genet 94:20-26.
Hiromoto DM and Vello NA (1986) The genetic base of Brazilian soybean (Glycine max(L.) Merrill) cultivars. Braz J Genet 9:295-306.
Ininda J, Fehr WR, Cianzio S and Schnebly, S (1996) Genetic gain in soybean populations with different percentages of plant introduction parentage. Crop Sci 36:1470-1472.
Kisha TJ, Sneller CH and Diers BW (1997) Relationship between genetic distance among parents and genetic variance in pop-ulations of soybean. Crop Sci 37:1317-1325.
Manjarrez-Sandoval P, Carter Jr TE, Webb DM and Burton JW (1997) RFLP Genetic similarity and coefficient of parentage as genetic variance predictors for soybean yield. Crop Sci 37:698-703.
Melchinger AE, Lee M, Lamkey KR and Woodman WL (1990) Genetic diversity for restriction fragment length poly-morphisms: relation to estimated genetic effects in maize inbreds. Crop Sci 30:1033-1040.
Pulcinelli CE (1997) Avaliação de cruzamentos dialélicos de soja em gerações avançadas de endogamia. PhD Thesis, ESALQ, Universidade de São Paulo, Piracicaba, 167 p.
Rogers SO and Bendich AJ (1985) Extraction of DNA from milli-gram amounts of fresh, herbarium, and mummified plant tis-sues. Plant Mol Biol 5:69-76.
Schoener CS and Fehr WR (1979) Utilization of plant introduc-tions in soybean breeding populaintroduc-tions. Crop Sci 19:185-188. Sneath PHA and Sokal RR (1973)Numerical taxonomy. W.H.
Freeman and Company, San Francisco, 573 p.
Tivang JG, Nienhuis J and Smith OS (1994) Estimation of sam-pling variance of molecular marker data using bootstrap pro-cedure. Theor Appl Genet 89:259-64.
Toledo JFF (1987) Predicting the inbreeding and the outcrossing potential of soybean (Glycine max(L.) Merrill) varieties. Braz J Genet 10:543-558.
Triller C and Toledo JFF (1996) Using the F3generation for
pre-dicting the breeding potential of soybean crosses. Braz J Genet 19:289-294.
Vello NA, Fehr WR and Bahrenfus JB (1984) Genetic variability and agronomic performance of soybean populations devel-oped from plant introductions. Crop Sci 24:511-514. Vieira ML, Fungaro MHP, Jubier MF and Lejeune B (1997)