Robustness
Christopher Priester1*, Sebastian Schmitt2, Tiago P. Peixoto3
1Institut fu¨r Festko¨rperphysik, Technische Universita¨t Darmstadt, Darmstadt, Germany,2Honda Research Institute Europe GmbH, Offenbach am Main, Germany,3Institut fu¨r Theoretische Physik, Universita¨t Bremen, Bremen, Germany
Abstract
We investigate the trade-off between the robustness against random and targeted removal of nodes from a network. To this end we utilize the stochastic block model to study ensembles of infinitely large networks with arbitrary large-scale structures. We present results from numerical two-objective optimization simulations for networks with various fixed mean degree and number of blocks. The results provide strong evidence that three different blocks are sufficient to realize the best trade-off between the two measures of robustness, i.e. to obtain the complete front of Pareto-optimal networks. For all values of the mean degree, a characteristic three block structure emerges over large parts of the Pareto-optimal front. This structure can be often characterized as a core-periphery structure, composed of a group of core nodes with high degree connected among themselves and to a periphery of low-degree nodes, in addition to a third group of nodes which is disconnected from the periphery, and weakly connected to the core. Only at both extremes of the Pareto-optimal front, corresponding to maximal robustness against random and targeted node removal, a two-block core-periphery structure or a one-block fully random network are found, respectively.
Citation:Priester C, Schmitt S, Peixoto TP (2014) Limits and Trade-Offs of Topological Network Robustness. PLoS ONE 9(9): e108215. doi:10.1371/journal.pone. 0108215
Editor:Jesus Gomez-Gardenes, Universidad de Zarazoga, Spain
ReceivedMay 23, 2014;AcceptedAugust 26, 2014;PublishedSeptember 24, 2014
Copyright:ß2014 Priester et al. This is an open-access article distributed under the terms of the Creative Commons Attribution License, which permits unrestricted use, distribution, and reproduction in any medium, provided the original author and source are credited.
Data Availability:The authors confirm that all data underlying the findings are fully available without restriction. All relevant data are within the paper and its Supporting Information files.
Funding:TPP was funded by the University of Bremen, zentrale Forschunsfo¨rderung Linie 04. The funders had no role in study design, data collection and analysis, decision to publish, or preparation of the manuscript. Honda Research Institute Europe GmbH provided support in the form of salaries for authors CP and SS, but did not have any additional role in the study design, data collection and analysis, decision to publish, or preparation of the manuscript. The specific roles of these authors are articulated in the ‘author contributions’ section.
Competing Interests:Honda Research Institute Europe GmbH provided support in the form of salaries for authors CP and SS. This does not alter the authors’ adherence to PLOS ONE policies on sharing data and materials.
* Email: [email protected]
Introduction
The theoretical investigation of complex networks has proven to be a valuable tool for the study of many real-world systems [1–6]. One important aspect is how the topological properties of networks are linked to their function and robustness [7,8]. Robustness is defined as the correct functioning in the presence of disturbances, and it is a desired property of many empirical network systems. The robustness of networks to topological disturbances is a very active field of research [8–11], since it is often assumed that it is a necessary ingredient for higher-order forms of robustness associated with specific network dynamics [12– 16].
One popular way to address topological robustness is by removing nodes from a given network and then analyzing how connected the network remains as function of the number of nodes removed [7,17,18]. In this way, the problem of robustness is mapped to the classical phenomenon of percolation, and the formation of a giant component in the remaining network after the node removals.
Recent studies focused on the optimization of the topological robustness of networks, when a given set of constraints are imposed [11,19–25]. Most recent works have focused on optimization according to different robustness criteria, such as
targeted attacks [11,25,26] and random failure [25,26]. However, most real systems are subject to simultaneous types of perturba-tions, which individually require different, and thus competing strategies to mitigate failure. In order to properly access the inherent trade-offs in such situations, one needs to combine multiple robustness criteria. A standard technique is to chose a weighted sum of the relevant criteria as the objective function to be minimized or maximized. However, such an approach can be ineffective if the goal is to map all possible trade-off values between these objectives. In addition, it also bears the difficulty to define properly scaled objective functions for each criterion, such that a weighted sum really reflects the relative importance the multiple criteria.
core group, possessing a high average degree, which is also internally connected [25]. Although being maximally robust against random failure, this core-periphery topology is minimally robust against targeted attacks, since the removal of the few core node immediately leads to the vanishing of the giant component. This robustness-fragility duality is a common feature of real networks with heterogeneous structure; a famous example of which is the Internet [31].
In order to investigate this multi-objective optimization scenario, we follow Ref. [25] and focus on large-scale topological features, as parametrized by a stochastic block model [32,33]. This parametrization allows for arbitrary large-scale mixing patterns, such as assortativity, dissortativity, community structure, core-peripheries, etc., as well as arbitrary local degree distributions. This model is also convenient, since it allows the exact computation of the percolation properties of the system in the limit of large networks [25,34].
By analyzing the Pareto-optimal fronts according to the two robustness criteria, we observe that a minimal number of three blocks is sufficient to obtain the optimal fronts, and that in most cases the best trade-off is realized by a hybrid structure composed of a core-periphery and a third ‘‘secluded’’ group, which is strongly connected internally and marginally connected to the core nodes. The two-block core-periphery of Ref. [25] and the fully random network are recovered at the two extremes of the Pareto fronts, for maximum robustness against random and targeted node removal, respectively.
This paper is organized as follows. In Sec. 1, we define the stochastic block model and in Sec. 2 our robustness criteria. In Sec. 3, the evolutionary multi-objective optimization algorithm is described briefly. Sec. 3 presents the results of the optimization for several parameter choices, including the Pareto-optimal fronts and the resulting topologies. In Sec. 5.3, we finalize with an overall discussion.
Materials and Methods
1 Stochastic block model
The stochastic block model defines an ensemble of random networks, in which nodes belong to different groups (also called ‘‘blocks’’), and the probability of an edge existing between nodes is a function of the block membership of each node. Each block holds a fractionnrof the N nodes of the whole network, where r[½1,B enumerates these blocks and Bis the total number of blocks, such thatPB
r~1nr~1. Following Ref. [33], each of theB blocks is characterized by an independent degree distributionpr
k, which specifies the fraction of nodes with degreekin blockr.
The connections between the blocks are described with a matrix e, where the elements ers specify the number of half-edges per node in blockrconnecting to nodes in blocks. For simplicity of notation, the diagonal elements err encode twice the number of edges per node within blockr.
In the framework of the stochastic block model, the network structure becomes locally tree-like when the number of nodesNnr inside each block is sufficiently large. Since the probability of an edge existing between any two nodes of groupsrandsscales as is Eers=NnrNns*O(1=N), withnr*1=Band ers*1=B2, the prob-ability of an edge existing between any two chosen neighbours will become vanishingly small as N??. Therefore, since local substructures such as triangles are not generated by the model, predictions based on block model calculations can only be accurate for (large) locally tree-like networks without these local substructures. However, global and meso-scale properties such as community structure [33], assortativity [35], bipartite,
core-periphery structures [25], or any other arbitrary mixing pattern are well captured.
Each block of the network can in principle have an arbitrary degree distribution pr
k. However, in this work we restrict the degree distribution of each block to be a modified Poisson degree distribution,
pMPk ~(1{dk,0)
kk
(ek{1)k!, ð1Þ
where dij is the Kronecker delta function. Thereby nodes with zero degree (k~0) are explicitly excluded, since they can never belong to the giant component. In contrast to a regular Poisson distribution pP
k~kke{k=k!, where the mean degree is directly given byk, the mean degree of the modified Poisson distribution is given bySkTMP~k=(1{e{k), which always is greater thank. In particular, the mean degree cannot be less than one,SkTMP§1. It is important to note that although the use of the modified Poisson distribution as displayed in Eq. (1) may seem like a strong imposition on the network structure, in reality it is not. A large variety of nearly-arbitrary degree distributions of the complete network can be obtained by composing many blocks with different sizes and average degrees.
The percolation properties of a random network with the modified Poisson degree distribution of Eq. (1) differ slightly from an Erdo˝s-Re´nyi network, i.e. a random network with a regular Poisson distribution. In the Erdo˝s-Re´nyi network the percolation transition where a macroscopic connected component emerges as a function of the mean degree occurs atSkTC
P~1. In the case of the modified Poisson distribution, the transition is shifted to
SkTC
MP~e=(e{1)&1:58, as can be seen in Fig. 1. This is a direct consequence of the fact that no nodes with degree k~0 are allowed in the later case. For a modified Poisson network to have low mean degree,SkTMP&>1, a large fraction of nodes needs to
have degree one. In order to achieve this, many of thek{1nodes form pairs and are thus isolated from the rest of the network. Additionally, the number of nodes with degree greater than one is strongly reduced compared to the regular Poisson distribution (see inset of Fig. 1). This prohibits the existence of a macroscopic connected component if the mean degree is close to one (SkTMP&>1). Only when the fraction of nodes with k~1
diminishes, a macroscopic giant component can form. In this case, the nonexistence of disconnectedk~0nodes results in larger connected components in general and leads to the stronger increase of the size of the giant components as can be seen in Fig. 1.
Apart from the degree distribution of each block, pr k, more parameters need to be specified in order to define a realization of a block model ensemble. These are the total number of blocksB, the relative size of each blocknr, the mean degree of each blockSkTr, as well as the edges connecting the blocks given by ers. These parameters are, however, not completely independent as the relative sizesnrof all blocks must add up to one,P
rnr~1, and the sum of all the edges incident to one block is related to its mean degree,SkTr~Psers=nr. Since we will always consider networks with a given total mean degreeSkT, the following constraint will need to be fulfilled,SkT~P
rnrSkTr.
2 Node removal and robustness
second is targeted removal where nodes with higher degree are more likely to be removed.
Both types of failures are inspired by real-world technical networks. Random removal is considered to model fatigue of parts or other random influences. Targeted removal is inspired by the fact that highly loaded nodes are more likely to fail or, in the context of critical infrastructure, malicious damage is preferably brought to important nodes.
In the context of block models, where we only model representative nodes in an statistical ensemble, we employ a slight variation of the targeted removal which was also used in Ref. [25]. The targeted criterion is only applied to the selection of blocks where the fraction of nodes to be removed from block r is proportional toeSkTr and thus increases with the mean degree of the block. However, within each block no further targeted removal of nodes is performed and nodes are removed at random. In case of all blocks having the same mean degree targeted removal is identical to random node removal.
As a measure of robustness of a network we use the size of the macroscopic componentS(q)after a finite fractionqof nodes has been removed. Instead of focusing on the robustness when removing a single fraction q, all possible values 0ƒqƒ1 are considered to obtain a sensible measure for the overall robustness of a network. Therefore, we define the robustness as it was proposed in Ref. [11] as
R~2 ð1
0
S qð Þdq, ð2Þ
where the factor of 2 serves to adjust the range ofRto be½0,1. The limiting case R~0 is achieved by networks without a macroscopic component, even when no nodes are removed at all. The opposite limiting case of R~1 requires a fully connected network whereS(q)~1{q.
Following Ref. [25] using the generating function formalism [36] the size of the macroscopic component is calculated usingur, which is the probability that a node in blockris not connected to the macroscopic component via one of its neighbors. These
probabilities for all blocks have to fulfill a system of B self-consistent coupled equations:
ur~X
s
mrs 1zws
ks
g0,s’ ð Þus {1
, ð3Þ
wheremrs:ers nrkr
is the fraction of edges in blockrleading to block
s,nrandSkTrare the relative number of nodes and mean degree of block r, respectively, and g0,r(z)~Pkpr
kzk is the generating function of the degree distribution of block r and
g0,r’ (z)~L
Lzg0,r(z) is its derivative. wr[½0,1 is the fraction of nodes notremoved from block r. The wr have to be chosen in accordance with the node removal strategy, for example,wr~wfor random removal orwr!e{SkTr for targeted removal. Since the total fraction of removed nodes is given byq, thewrneed to satisfy the relationq~1{Ps wsns. Due to this requirement, thewrfor targeted removal need to be determined by numerically solving
0~1{q{P
r nrexp ({SkTr(1{x)=x) for x and using the solutionxto getw
r~exp ({SkTr(1{x)=x).
The solutions of these equationsurallows for the calculation of the size of the giant connected componentS(q),
S(q)~X ½1{ ð Þu : ð4Þ
At this point, a few remarks about the interpretation of the value ofS(q) should be made. Since we are parametrizing the system with intensive quantities (ers,nr,ur, etc.) which specifyfractionsof nodes and edges in infinitely large systems, we cannot differentiate between the existence of single or multiple macroscopic compo-nents for a given value ofS(q). In other words, if two macroscopic components are connected by a single edge (or more generally, any intensive number of edges) the probability of edges between them vanishes in the infinite size limit. Thus, this situation cannot be distinguished from two truly disconnected macroscopic components where no edges exists between the two components. For the purposes of this work, we consider this issue to be unimportant, and we focus on the existence of macroscopic components in the more abstract sense as given by the value of S(q)directly.
For each node removal strategy, Eqs. (3) have to be solved for all qin order to calculate the robustnessRof a specific block model ensemble. In our case, this leads to two different measures of robustness,RRandomandRTargeted, for random and targeted node removal, respectively.
3 Evolutionary optimization
In order to consider both robustness measures, RTargeted and RRandom, at once, we utilize a multi-objective [27–30] evolutionary optimization [37,38] algorithm. Unlike in the optimization of a single objective, where it is always possible to state if a certain solutionAis better, worse or equally good compared to a solution B, this is not necessarily possible in multi-objective optimization. If a solutionAperforms better than a different solution Bin one objective, but worse in a second objective, no statement is possible which of the solutions is better. Only if solutionAis better thanB in at least one objective and not worse in any objective it can be considered generally better and it is then said thatAdominatesB. Sets in which no solution dominates any other solution are called Figure 1. Giant connected component of a Erdo˝s-Re´nyi random
network with a Poisson (dashed green) and modified Poisson (solid red) degree distribution (excluding nodes withk~0) as function the average mean degree of the network. The inset shows the regular and modified Poisson distribution for a mean degree ofSkT~1:2with the same color coding.
doi:10.1371/journal.pone.0108215.g001
n φs g0
s
non-dominating. In general, a multi-objective optimization will not result in a single best solution but in a set of non-dominating solutions which ideally is close to the best possible set of dominating solutions, the Pareto-optimal front. These non-dominating sets are very useful to study the trade-off relation between the robustnessRTargetedandRRandomand their relation to the structure of optimal networks.
The algorithm we use here is the so calledS-metric selection evolutionary multi-objective optimization algorithm(SMS-EMOA) [39]. It is a population based evolutionary stochastic search algorithm which does not utilize any gradient information and is well suited for non-convex and noisy optimization problems. The algorithm does not optimize the objectives directly but instead maximizes the hypervolume in objective-space dominated by the population and bound by a reference point. In the present case of two objectives, the hypervolume is given by the area under the Pareto-curves as, for example, shown in Fig. 2. At each iteration the solution whose removal leads to the lowest decrease in the dominated hypervolume is removed from the population and a new solution is generated by recombination and mutation (for more details see [40]).
Repeating the steps of removing the least contributing solution and generating a new solution not only shifts the solution set closer to the Pareto-optimal front but also leads to a broad distribution along the front, two desired properties of an optimal set of solutions. For completeness, we state the parameters used for the SMS-EMOA: A population size of 50 is used, the crossover probability is pc~1, the crossover distribution parameter is
gm~20, the mutation probability is pm~1, and the mutation distribution parameter isgc~15.
For each optimization run, we fix the number of blocksBand the mean degree of the complete network,SkT. Each block has a modified Poisson distribution as its degree distribution (cf. Eq. (1)), but the average mean degree of each block can vary. Therefore, the free variables subject to optimization, i.e. the search
parameters, are the relative size of each block, nr, the mean degree of each block,kr, and the entries in the matrix containing edges within and between the blocks,ers. With the sum rules and constraints stated at the end of Section 1, this results in
1
2B(Bz1)zB{2independent search parameters. Results
4 Trade-off curves
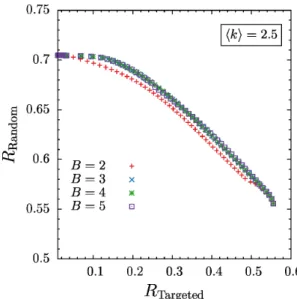
In Fig. 2 we show robustness values obtained from different optimizations for several numbers of blocks (B~2,3,4,5), but all with a fixed mean degree ofSkT~2:5. The Pareto-optimal fronts for optimizations withB~3,4, and 5 blocks match exactly. Only the B~2 result deviates and yields lower robustness over large parts of the Pareto-optimal front.
The network structures corresponding to the Pareto-optimal solutions forB~3,4, and5blocks (not shown) are also identical. (Two structures with differentB values are considered identical when their structural entropy is the same. See Sec. 5 for more details.) The same behavior was found for other values of the mean degree SkT, where the results for B§3 were identical and deviations were only observed forB~2.
This leads to the conclusion that three blocks are sufficient to describe networks which are maximally robust against random and targeted node removal. At both extremes of the Pareto-optimal fronts all curves coincide, which means that for optimizing only with respect to one objective (i.e. single-objective optimiza-tion),Bƒ2is sufficient to achieve maximal robustness (see Section 5). This is in accordance with the results of Ref. [25], where single-objective optimization was performed, and aB~2core-periphery and aB~1fully random structures were found as optimum for random and targeted node removal, respectively. This is also consistent with the findings of Valente et al. [26] who showed two-and three-peak degree distributions to be optimal when minimiz-ing percolation thresholds of networks subject to random and targeted removal of nodes.
The Pareto-optimal fronts of optimized block model networks with three blocks (B~3) and a mean degreeSkTbetween1:5and
Figure 2. Pareto-optimal fonts of robustness against targeted and random removal of nodes for mean degreeSkT~2:5and various number of blocks.For three, four and five blocks the curves match exactly which implies that no more than three blocks are necessary to achieve the best robustness values. Since at the and of the curves all of them match only two or even one block is enough to achieve best robustness.
doi:10.1371/journal.pone.0108215.g002
Figure 3. Pareto-optimal fronts ofRRandom versus RTargeted for optimal block model networks withB~3and for various mean degrees (colored symbols).ForSkTw2, the smaller gray symbols to the left of each Pareto front indicate solutions which maximizeRRandom
for fixedRTargetedbut which are not Pareto-optimal (see main text).
3:5are shown in Fig. 3. As intuitively expected, the general trend where the robustness increases with the mean degree is observed. For small values of the mean degree,SkT=2:5, the two types of robustness are in strong trade-off relation: Increasing the robustness against targeted removal strongly decreases the robustness against random removal (and vice-versa).
Pareto-optimal solutions of networks withSkT=2and with the highest robustness against random removal are always found to be most fragile with respect to targeted removal, i.e. atRTargeted~0. But forSkTw2, networks with the maximal value ofRRandomshift to have a finite robustness against targeted removal,RTargetedw0. In this case, networks with lower robustness against targeted removal are not accessible via the multi-objective optimization, since they are not Pareto-optimal (i.e. they are dominated by the solutions with maximal RRandom, see Refs. [27–30]). However, they can be found by performing an optimization with the value of RTargeted fixed, and such results are shown as the smaller gray symbols in Fig. 3. The Pareto optimal front together with these additional solutions form the whole trade-off curve for eachSkT. With increasing mean degree, the trade-off curves become very flat, indicating that a slight sacrifice on the robustness with respect to random removal yields a great enhancement in the robustness against targeted removal. Additionally, the curves increasingly approach the diagonal where RRandom~RTargeted, which means that there are solutions which are equally good in both measures. In generalRRandomis always greater or equal toRTargeted, and forSkT>2:5, the Pareto-optimal fronts extend to the diagonal. In random networks, nodes with high degree are important for the size of the giant component since they naturally are more likely to connect different components. Due to this, a removal mechanism targeting high degree nodes is able to degrade the giant component easily by removing a relatively small amount of high degree nodes. Therefore, making the degree distribution of a network narrow should increase the robustness against targeted removal since there are less high-degree nodes. In a block model with several blocks a narrow degree distribution implies that all blocks have the same mean degree SkTr~SkT. Since, in this work, targeted removal only differentiates between blocks but not between nodes inside the block, targeted and random removal are identical if all blocks have the same mean degree. As a consequence, the robustness values are then equal, RRandom~RTargeted.
In contrast, for SkT=2:0, the Pareto-optimal fronts do not extend to the diagonal, which is a consequence of the percolation properties of fully randomB~1networks (cf. Section 1). For low mean degrees, the giant connected component of a fully random network is very small even without node removal (q~0). Due to the steep increase of the giant component with increasing mean degree (cf. Fig. 1), it is beneficial to have two blocks with differing mean degree, one higher and the other lower than the total average mean degree SkT. The block having a mean degree greater thanSkT, also has a substantial larger giant component, while the giant component of the other block is still small (or even zero). Therefore, the argument presented above for SkT>2:5, where a finite giant component at q~0 always exists, is not effective forSkT=2. It is always beneficial to have (at least) two blocks in order to have increase the size of the giant component for q~0.
5 Network structures
In our approach, the number of blocksBis set a priori and kept fixed during a single optimization procedure. However, networks with different values ofBcould have equivalent topologies. This can happen if one or more blocks have a vanishing size nrand
mean degreeSkTr, or when two or more blocks can be merged together without altering the ensemble of generated networks.
For a clearer visualization and analysis of block model structures, we reduce the number of blocks by removing insignificant blocks and by merging multiple blocks into one if they are equivalent. For two blocks to be equivalent, we require that the entropy of the merged and the original network ensembles differ by a very small amount. The entropy of the stochastic block model ensemble is simply the logarithm of the total number of networks which can be generated given a specific parametrization, i.e. choices of nr and ers. The entropy is a signature of the ensemble, and determines how random it is. If the entropy remains the same after two blocks are merged into one, this means that these two groups correspond simply to an arbitrary subdivision of a larger group, and they do not in fact constrain the topology in any way. The entropy of block model networks is calculated as described in Ref. [41]. We emphasize that, since the topologies in this case are in fact equivalent, the effect of the merging process on the robustness values was found to be negligible.
We now consider the Pareto fronts separately for different values of the mean degree.
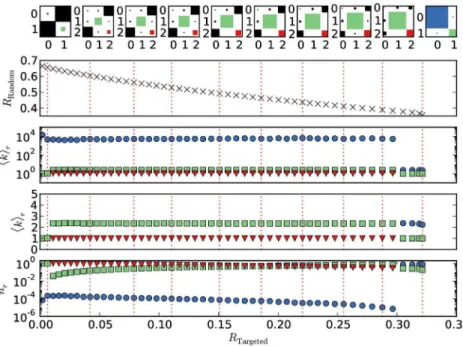
5.1 Networks with intermediate mean degree SkT~2:5. In Figure 4, the structure and parameters of opti-mized networks for SkT~2:5 are depicted. The merging procedure is reflected in the fact that the number of blocks indicated by the number indices on the axis and the number of possible squares in the top-row Hinton-plots varies between one and three.
ForRTargeted?0we recover the core-periphery structure found in Ref. [25] where the optimal solution consists of only two blocks. One block is the very large periphery block which contains nearly all the nodes (nperiphery&1) and which has the lowest mean degree possible in this kind of structureSkTperiphery&SkT=2~1:25. The core block contains only very few (ncore*10{3) but very high-degree nodes (SkTcore*103). Almost all of the edges are between the core and the periphery.
The core is central for forming the giant component, but takes up only a very small fraction of the network. Therefore, random removal will almost always affect periphery nodes and the giant component will shrink approximately linearly with the number of removed nodes, which is as slow as possible.
On the other hand, the core-periphery structure is maximally fragile with respect to targeted removal, since removing the core completely removes the giant component.
With increasing robustness against targeted removal, a third block emerges forSkT>0:07in addition to the core and periphery block. This new block, which we will call thesecluded blockis first of medium size (nsecluded&0:16) and has a mean degree of
SkTsecluded&4. In contrast to the core and the periphery block, it has a substantial amount of edges internally, i.e. edges between nodes within this block (green square in the Hinton plots). The secluded block is only lightly connected to the core block and no edges exist between secluded and periphery block.
Considering the complete Pareto-optimal set of solutions, the dominant structure is a three-block structure with a small but very high degree core, a large but low degree periphery and an additional secluded block which has a medium mean degree. Connections only exist between the core and the periphery, and between the core and the secluded block. The structure is best qualified as a modified core-periphery with a regular Erdo˝s-Re´nyi network attached to the core. The relative size of the secluded Erdo˝s-Re´nyi block compared to the core-periphery structure grows with an increased robustness against targeted node removal. 5.2 Networks with low mean degree SkT~2. The struc-tures of Pareto-optimal networks with a low mean degree of
SkT~2are shown in Figure 5. The resulting structures are overall quite similar to the previously discussed case withSkT~2:5. For RTargeted?0a core-periphery structure results, with an additional secluded Erdo˝s-Re´nyi block emerging asRTargetedis increased.
However, a striking difference to the situation forSkT~2:5is that the number of edges within the periphery does not vanish but is finite for all structures.
The periphery block always has a mean degree very close to one,SkTperiphery>1, which implies that the majority of nodes has exactly degree one. Therefore, most edges within the periphery produce an isolated pair of two nodes not connected to any macroscopic component (cf. discussion of the modified Poisson distribution in Section 1).
At first glance, this seems contradictory as the giant component is already reduced without any node removal (q~0). However, this is beneficial for the overall robustness as it allows for the rest of the nodes to have a higher mean degree putting it further above the percolation threshold. As can be seen from Fig. 1, this is especially effective for increasing the macroscopic component of the secluded block as its mean degree ofSkTsecluded&2:3is close to the steep increase in the size of the giant component. This may be
viewed simply as an artifact of the specific constraints we have imposed. Perhaps a more realistic scenario would be to impose additionally that the size of the largest component cannot decrease for any value of qafter the optimization. However, this would make the analysis significantly more complicated, and would only affect the outcome of very sparse networks.
Interestingly, this holds for the two-block core-periphery structure as well forRTargeted~0. A pure core-periphery structure is especially expected forSkT~2, since then the extreme topology of a star can be realized (the corresponding Hinton plot is not shown in Fig. 5). However, a very slight increase in the robustness against targeted removal toRTargeted&0:006, leaves the two-block core-periphery structure intact, but produces a significant amount of pairs in the periphery (see leftmost Hinton plot of Fig. 5). The size of the core jumps fromncore&7|10{5toncore&20|10{5 while its mean degree is reduced from SkTcore&14|103 to
SkTcore&4:6|103. With this structural change, a little robustness against random removal is lost, but the a finite number of edges is realized within the core which provides a finite robustness against targeted removal.
As expected from the discussion at the end of Section 4, the structure with a maximalRTargetedconsists of two blocks, one with a mean degree SkT0wSkT and another with SkT1vSkT. Both blocks in fact form largely independent components since there are very few connections between them. This is a situation similar to the ‘‘onion-like’’ structure found in Ref. [11] when optimizing against targeted node removal while preserving a heterogeneous degree sequence. There, the nodes with higher degree are kept isolated from the rest of the network, hence effectively functioning simply as ‘‘bait’’ for the targeted removal, whereas the rest of the system remains intact.
It is very remarkable that forSkT~2the mean degree of the three blocks stay constant over the complete range of the Pareto-Figure 4. Parameters of the optimized networks as a function ofRTargeted obtained from a three-block optimization withSkT~2:5. The upper row shows the elements of the edge matrixers, where the areas of the squares is proportional to the logarithm of the element. The
optimal front (apart from the far extremes). The optimal trade-off between the two robustness measures can be achieved by only changing the connection matrix and the relative sizes of the blocks. 5.3 Networks with high mean degree SkT~3:5. The
network structures for a higher mean degree of SkT~3:5 is shown in Fig. 6. The Pareto-optimal part of the front, that is for RTargeted>0:48, displays the same three-block structures as for
SkT~2:5and also reduces to a single block for maximalRTargeted whereRTargeted~RRandom (cf. Fig. 4).
For the part of the trade-off curve to the left of the maximum of RRandom (i.e. for RTargeted=0:42), the structures change signifi-cantly. A three-block structure prevails but the secluded block ceases to exist. No block has a significant amount of internal edges and all edges connect different blocks. The largest block incorporates most of the nodes,n>0:9, and has the lowest mean Figure 5. Parameters of the networks along the trade-off curve for the five block optimization withSkT~2:0.The rows show the elements of the edge matrixers, the trade-off curve already displayed in Fig. 2, the mean degree of the blocks on a logarithmic and on a linear scale,
as well as the relative sizes of the blocks, from top to bottom, respectively. See caption of Fig. 4 for more details on the coloring and box sizes. doi:10.1371/journal.pone.0108215.g005
Figure 6. Parameters of the networks along the trade-off curve for the five block optimization withSkT~3:5.The rows show the elements of the edge matrixers, the trade-off curve already displayed in Fig. 2, the mean degree of the blocks on a logarithmic and on a linear scale,
degree of SkT&2. A second block is very small with
10{5vnv10{2 and has a high degree 102vSkTv104 and therefore strongly resembles the core block. The third block is of intermediate size and degree, 10{2vnv10{1 and
10vSkTv102, respectively. The mid-sized and the small block are only connected via the largest block since there are no direct edges between them.
For very low robustness against targeted removal,RTargeted>0, most of the edges are between the core and the largest block with
SkT~2. With increasing robustness against targeted removal the number of edges between core and theSkT~2block decreases while more edges emerge between theSkT~2block and the mid-sized block. At aroundRTargeted&0:19the same number of edges exist from theSkT~2block to both of the other two blocks. For higherRTargetedmore edges exist between the SkT~2block and the mid-sized block.
This structural evolution can be understood by noting that the largest part of the network always has a mean degree very close to two and acts a connecting layer between the core and the mid-sized block. For low RTargeted, very few edges are between the block withSkT~2and the mid-sized block, so that a connecting path between two different nodes of the mid-sized block is very likely to traverse one of the few core nodes. Therefore, removing the core quickly fragments the network into small components. On the other hand, increasing the number of edges between the
SkT~2and the mid-sized block, a connecting path between nodes within the mid-sized block is more likely to involve no nodes from the core. The core becomes increasingly unimportant and therefore the robustness with respect to targeted removal increases.
Discussion
In this paper we investigated the trade-offs between topological robustness of networks against random and targeted node removals. We used the stochastic block model to parametrize arbitrary mixing patterns, and a multi-objective optimization algorithm to obtain the Pareto-optimal fronts. It was found that in order to achieve a Pareto-optimal combination of robustness against random and targeted removal, a network composed of at most three different blocks is sufficient. In many cases the networks along the Pareto-optimal fronts are composed of a hybrid topology, comprised of a core-periphery structure, in addition to a secluded group, which is only sparsely connected to the core of the network, and not at all with the periphery.
At the edges of the Pareto-fronts, where one of the two robustness criteria is maximized, one or two blocks suffice to obtain optimal networks: A two-block structure is maximally robust against random failure, and a fully random network with one block is sufficient in the case of targeted removal. This reproduces the results of Ref. [25], and is also consistent with the earlier findings of Valente et al. [26] who found two- or three-peak degree distributions to be optimal when minimizing percolation thresholds, with networks which are otherwise fully random.
For low mean degrees of the overall network, the optimal robustness values are generally lower than for higher mean degrees and a significant trade-off exists between robustness against random and targeted removal. With increasing mean degree the strong trade-off diminishes and it is increasingly possible to obtain a high robustness with respect to both criteria. This implies that a network optimized against one type of failure does not necessarily
lose much of its robustness when it is subsequently optimized against the other type of failure or attack. Hence this shows that increasing the overall connectivity of the network not only has the expected trivial effect of increasing each robustness criterion individually, but to a large extent also allows for them to be fulfilled simultaneously. This suggests that the simple strategy of increasing the total number of edges in the network, if combined with the optimal large-scale structures present in the Pareto-optimal front, can be much more beneficial than could be expected otherwise.
A comparison of the large-scale structures we find with the ones observed in empirical systems [31,42,43] is a natural and important extension of this work, and one we intend to pursue in the future. The most appropriate approach is to search for precisely the same type of model we are using in the analysis, which can be done by inferring the parameters of the stochastic block model itself from empirical data, which is a very active field of research [32,33,44,45]. In fact, core-periphery structures have already been detected, such as the topology of the Internet at the autonomous systems level presented recently in [46]. However, to our knowledge, an empirical verification of the specific structures we have found has not yet been made.
In this work we have considered maximally robust networks that are obtained when very few constraints are imposed. This gives us fundamental limits on the multi-objective optimization against random failures and targeted attacks. However, in empirical systems, exogenous constraints are almost always present, such as geographical confinement, and restrictions due to functional performance. In previous studies [11,47], the optimization against targeted node removal was considered when the degree sequence of an empirical network is preserved. It was found that an assortative structure emerges as the optimum in this case, where nodes become connected with other nodes with similar degree. This has been obtained as well by imposing similar constraints with the block model approach in Ref [25]. However, it is still unknown how the multi-objective optimization would behave when these constraints (and other more realistically motivated ones) are simultaneously imposed. We leave these questions for future work.
Supporting Information
Dataset S1 Compressed file containing the final results of all optimizations shown here. The name of each file contains the respective number of blocks and the mean degree of the network. The columns inside each file are aranged in the following order: both robustness values, mean degree of each block, relative sizes of the blocks, elements of the connection matrix.
(7Z)
Acknowledgments
The authors acknowledge fruitful discussions with Barbara Drossel. C.P. and S.S. additionally acknowledge the support and discussions with colleagues at the Honda Research Institute Europe GmbH.
Author Contributions
Conceived and designed the experiments: CP SS TPP. Performed the experiments: CP. Analyzed the data: CP SS TPP. Wrote the paper: CP SS TPP.
References
1. Albert R, Barabasi AL (2002) Statistical mechanics of complex networks. Reviews of Modern Physics 74: 47.
3. Boccaletti S, Latora V, Morenod Y, Chavez M, Hwang DU (2006) Complex networks: Structure and dynamics. Physics Reports 424: 175–308.
4. Carvalho R, Buzna L, Bono F, Gutie´rrez E, Just W, et al. (2009) Robustness of trans-european gas networks. Phys Rev E 80: 016106.
5. Cornelius SP, Kath WL, Motter AE (2013) Realistic control of network dynamics. Nature Communications 4: 1942.
6. Albert R, Albert I, Nakarado GL (2004) Structural vulnerability of the north american power grid. Phys Rev E 69: 025103.
7. Callaway DS, Newman MEJ, Strogatz SH, Watts DJ (2000) Network robustness and fragility: Percolation on random graphs. Physical Review Letters 85: 5468– 5471.
8. Buldyrev SV, Parshani R, Paul G, Stanley HE, Havlin S (2010) Catastrophic cascade of failures in interdependent networks. Nature 464: 1025–1028. 9. Rosas-Casals M, Valverde S, Sole RV (2007) Topological vulnerability of the
european power grid under errors and attacks. I J Bifurcation and Chaos 17: 2465–2475.
10. Hines P, Cotilla-Sanchez E, Blumsack S (2010) Do topological models provide good information about electricity infrastructure vulnerability? Chaos 20: 033122.
11. Schneider CM, Moreira AA, Andrade JS Jr, Havlin S, Herrmann HJ (2011) Mitigation of malicious attacks on networks. PNAS 108: 3838.
12. Szejka A, Drossel B (2010) Evolution of boolean networks under selection for a robust response to external inputs yields an extensive neutral space. Phys Rev E 81: 021908.
13. Li F, Long T, Lu Y, Ouyang Q, Tang C (2004) The yeast cell-cycle network is robustly designed. Proceedings of the National Academy of Sciences of the United States of America 101: 4781–4786.
14. Scott DM, Novak DC, Aultman-Hall L, Guo F (2006) Network robustness index: A new method for identifying critical links and evaluating the performance of transportation networks. Journal of Transport Geography 14: 215–227.
15. Dodds PS, Watts DJ, Sabel CF (2003) Information exchange and the robustness of organizational networks. Proceedings of the National Academy of Sciences 100: 12516–12521.
16. Peixoto TP (2012) Emergence of robustness against noise: A structural phase transition in evolved models of gene regulatory networks. Physical Review E 85: 041908.
17. Cohen R, Erez K, ben Avraham D, Havlin S (2000) Resilience of the internet to random breakdowns. Physical Review Letters 85: 4626.
18. Cohen R, Erez K, ben Avraham D, Havlin S (2001) Breakdown of the internet under intentional attack. Physical Review Letters 86: 3682–3685.
19. Mathias N, Gopal V (2001) Small worlds: How and why. Phys Rev E 63: 021117.
20. i Cancho RF, Sole RV (2003) Optimization in Complex Networks, Springer (Berlin). Lecture Notes in Physics. pp.114–125.
21. Colizza V, Banavar JR, Maritan A, Rinaldo A (2004) Network structures from selection principles. Phys Rev Lett 92: 198701.
22. Netotea S, Pongor S (2006) Evolution of robust and efficient system topologies. Cell Immunol 244: 80.
23. Brede M (2010) Coordinated and uncoordinated optimization of networks. Phys Rev 81: 066104.
24. Brede M, de Vries BJ (2009) Networks that optimize a trade-off between efficiency and dynamical resilience. Physics Letters A 373: 3910.
25. Peixoto TP, Bornholdt S (2012) Evolution of robust network topologies: Emergence of central backbones. Phys Rev Lett 109: 118703.
26. Valente AXCN, Sarkar A, Stone HA (2004) Two-peak and three-peak optimal complex networks. Phys Rev Lett 92: 118702.
27. Deb K (2001) Multi-objective optimization using evolutionary algorithms, volume 16. John Wiley & Sons.
28. Coello CAC, Van Veldhuizen DA, Lamont GB (2002) Evolutionary algorithms for solving multi-objective problems, volume 242. Springer.
29. Coello CAC (2005) Recent trends in evolutionary multiobjective optimization. In: Evolutionary Multiobjective Optimization, Springer. pp.7–32.
30. Ishibuchi H, Tsukamoto N, Nojima Y (2008) Evolutionary many-objective optimization: A short review. In: Proc. of 2008 IEEE Congress on Evolutionary Computation (World Congress on Computational Intelligence). IEEE, p. 2419– 2426.
31. Doyle JC, Alderson DL, Li L, Low S, Roughan M, et al. (2005) The robust yet fragile nature of the internet. Proceedings of the National Academy of Sciences of the United States of America 102: 14497–14502.
32. Holland PW, Laskey KB, Leinhardt S (1983) Stochastic blockmodels: First steps. Social Networks 5: 109–137.
33. Karrer B, Newman MEJ (2011) Stochastic blockmodels and community structure in networks. Phys Rev E 83: 016107.
34. Bujok M, Fronczak P, Fronczak A (2014) Percolation in the classical blockmodel. arXiv: 14042580 [cond-mat, physics:physics].
35. Newman MEJ (2003) Phys Rev E 67: 026126.
36. Newman MEJ, Strogatz SH, Watts DJ (2001) Random graphs with arbitrary degree distributions and their applications. Phys Rev E 64: 026118. 37. Ba¨ck T, Hammel U, Schwefel HP (1997) Evolutionary computation: comments
on the history and current state. IEEE Trans Evolutionary Computation 1: 3– 17.
38. Simon D (2013) Evolutionary Optimization Algorithms. John Wiley & Sons. 39. Beume N, Naujoks B, Emmerich M (2007) Sms-emoa: Multiobjective selection
based on dominated hypervolume. European Journal of Operational Research 181: 1653–1669.
40. Deb K, Agrawal RB (1994) Simulated binary crossover for continuous search space. Complex Systems 9: 1–34.
41. Peixoto TP (2012) Entropy of stochastic blockmodel ensembles. Phys Rev E 85: 056122.
42. Albert R, Albert I, Nakarado GL (2004) Structural vulnerability of the north american power grid. Physical Review E 69: 025103.
43. Verma T, Arajo NaM, Herrmann HJ (2014) Revealing the structure of the world airline network. Scientific Reports 4.
44. Decelle A, Krzakala F, Moore C, Zdeborov L (2011) Inference and phase transitions in the detection of modules in sparse networks. Physical Review Letters 107: 065701.
45. Peixoto TP (2013) Parsimonious module inference in large networks. Physical Review Letters 110: 148701.
46. Peixoto TP (2014) Hierarchical block structures and high-resolution model selection in large networks. Physical Review X 4: 011047.