www.atmos-chem-phys.net/14/9871/2014/ doi:10.5194/acp-14-9871-2014
© Author(s) 2014. CC Attribution 3.0 License.
Lightning NO
x
, a key chemistry–climate interaction:
impacts of future climate change and consequences
for tropospheric oxidising capacity
A. Banerjee1, A. T. Archibald1,2, A. C. Maycock1, P. Telford1,2, N. L. Abraham1,2, X. Yang1,2,*, P. Braesicke1,2,**, and J. A. Pyle1,2
1Department of Chemistry, University of Cambridge, Cambridge, UK
2NCAS-Climate, Department of Chemistry, University of Cambridge, Cambridge, UK *now at: British Antarctic Survey, Cambridge, UK
**now at: Karlsruhe Institute of Technology, Institute for Meteorology and Climate Research, Karlsruhe, Germany
Correspondence to:A. Banerjee ([email protected])
Received: 16 February 2014 – Published in Atmos. Chem. Phys. Discuss.: 31 March 2014 Revised: 30 July 2014 – Accepted: 14 August 2014 – Published: 18 September 2014
Abstract. Lightning is one of the major natural sources of NOx in the atmosphere. A suite of time slice experiments
using a stratosphere-resolving configuration of the Unified Model (UM), containing the United Kingdom Chemistry and Aerosols sub-model (UKCA), has been performed to inves-tigate the impact of climate change on emissions of NOx
from lightning (LNOx)and to highlight its critical impacts on
photochemical ozone production and the oxidising capacity of the troposphere. Two Representative Concentration Path-way (RCP) scenarios (RCP4.5 and RCP8.5) are explored. LNOx is simulated to increase in a year-2100 climate by
33 % (RCP4.5) and 78 % (RCP8.5), primarily as a result of increases in the depth of convection. The total tropospheric chemical odd oxygen production (P(Ox)) increases linearly
with increases in total LNOxand consequently, tropospheric
ozone burdens of 29±4 Tg(O3) (RCP4.5) and 46±4 Tg(O3) (RCP8.5) are calculated here. By prescribing a uniform sur-face boundary concentration for methane in these simula-tions, methane-driven feedbacks are essentially neglected. A simple estimate of the contribution of the feedback reduces the increase in ozone burden to 24 and 33 Tg(O3),
respec-tively. We thus show that, through changes in LNOx, the
ef-fects of climate change counteract the simulated mitigation of the ozone burden, which results from reductions in ozone precursor emissions as part of air quality controls projected in the RCP scenarios. Without the driver of increased LNOx,
our simulations suggest that the net effect of climate change would be to lower free tropospheric ozone.
In addition, we identify large climate-change-induced en-hancements in the concentration of the hydroxyl radical (OH) in the tropical upper troposphere (UT), particularly over the Maritime Continent, primarily as a consequence of greater LNOx. The OH enhancement in the tropics increases
oxi-dation of both methane (with feedbacks onto chemistry and climate) and very short-lived substances (VSLS) (with im-plications for stratospheric ozone depletion). We emphasise that it is important to improve our understanding of LNOxin
order to gain confidence in model projections of composition change under future climate.
1 Introduction
Lightning is one of the primary sources of nitrogen oxides (NOx=NO+NO2) in the troposphere and the only
natu-ral source remote from the Earth’s surface. Emissions of NOx from lightning (LNOx) in the mid and upper
tropo-sphere (UT), where the NOx lifetime is longer than at the
surface, exert a disproportionately large influence on tro-pospheric chemistry. Lightning occurs predominantly in re-gions of strong convection. These rere-gions, and hence LNOx,
therefore has the potential to be a particularly important fac-tor in chemistry–climate interactions.
LNOx has several roles relevant to both the
composi-tion and the radiative properties of the troposphere. NOx
from lightning induces production of ozone (O3) in the mid
to upper troposphere (e.g. Williams, 2005; Schumann and Huntrieser, 2007; Barret et al., 2010), where ozone can ex-ert a particularly strong radiative forcing (Forster and Shine, 1997). The production can be large enough to affect the tro-pospheric column ozone over or downwind of LNOx,
par-ticularly when other natural sources of NOx (e.g. biomass
burning) are absent (Ryu and Jenkins, 2005).
Concentrations and partitioning of other important trace gases are also affected. For example, the partitioning of the HOx(HOx=OH+HO2) family can be altered by the
con-version of HO2 to OH via the reaction between HO2 and
NO. In addition, formation of HOxcan be induced indirectly,
as lightning-produced ozone is subsequently photolysed to form O(1D), which then reacts with water vapour to generate OH. In contrast, HOxloss ensues when OH and NO2react
to form nitric acid, which can then be deposited to the sur-face (Brasseur et al., 2006; Schumann and Huntrieser, 2007). Any changes in HOx can affect the lifetime of methane,
whose loss depends primarily on OH (Holmes et al., 2013; Murray et al., 2014). Since methane is the second most im-portant greenhouse gas in terms of radiative forcing, this rep-resents an important chemistry–climate feedback resulting from changes in LNOx.
Changes in climate can also exert a direct influence on LNOx where, generally, global LNOx is found to increase
in a warmer climate (Grenfell et al., 2003; Zeng and Pyle, 2003; Brasseur et al., 2006; Zeng et al., 2008; Hui and Hong, 2013). However, given the large uncertainty that sur-rounds present-day LNOx estimates (generally between 2
and 8 Tg(N) yr−1), its vertical distribution and generation mechanisms (Schumann and Huntrieser, 2007; Wong et al., 2013), future projections are also highly uncertain (Price, 2013). A large part of the uncertainty in future changes arises from deficits in our understanding of the processes that drive modelled changes in convection. Chadwick et al. (2013) analysed tropical convective mass fluxes in the models contributing to the recent Coupled Model Intercom-parison Project phase 5 (CMIP5) and found both a climato-logical weakening and a deepening of convection to be ro-bust responses to a warmer climate. The depth of convection is likely to increase due, at least in part, to an uplifting of the tropopause with climate change. However, the mechanisms behind the changes in convection are complicated by sev-eral potential contributing factors and are still under debate. These factors might include: increasing sea-surface temper-atures (SSTs) (Ma et al., 2012; Ma and Xie, 2013; Chad-wick et al., 2013), spatial changes in SST patterns (Xie et al., 2010), increases in the static stability of the lower atmo-sphere (as the upper tropoatmo-sphere warms more than the lower troposphere) (Chadwick et al., 2012) and increases in the
depth of convection itself (Chou et al., 2009; Chou and Chen, 2010). With these uncertainties in mind, it is nonetheless im-portant to explore the possible feedback processes involving LNOxin a future climate.
To do this, we use a stratosphere-resolving configura-tion of the Unified Model (UM) containing the United Kingdom Chemistry and Aerosols (UKCA) sub-model with both stratospheric and tropospheric chemistry, to perform a series of sensitivity experiments perturbing perpetual year-2000 conditions to year-2100. In these experiments, we explore climate change using two Representative Con-centration Pathway (RCP) scenarios: RCP4.5 and RCP8.5 (IPCC, 2013); we also change the concentrations of ozone-depleting substances (ODSs) and tropospheric ozone pre-cursor emissions. The focus in this study lies in examining changes in LNOx and subsequent impacts on tropospheric
composition. We do not attempt to provide a detailed descrip-tion of all the changes associated with the applied perturba-tions; that will form the basis of a future publication.
The following sections are organised as follows. Section 2 describes the experimental set-up and the method in which LNOxis calculated in UM-UKCA. Section 3 then discusses
the impacts of future climate change on LNOx. The
associ-ated changes in tropospheric ozone and oxidising capacity are highlighted. Section 4 concludes with a summary of the results.
2 Model description
2.1 Experimental set-up
We use UM-UKCA in its atmosphere-only set-up at N48L60 resolution (3.75◦×2.5◦with 60 hybrid-height levels
extend-ing up to 84 km). The dynamical core is described by Hewitt et al. (2011). The model is forced by prescribed SSTs and sea ice. A uniform concentration for CO2is assumed while
uniform surface boundary conditions are prescribed for the remaining greenhouse gases (GHGs) and ozone-depleting substances (ODSs) (N2O, methane and halogen-containing
species). These can be varied independently within the radi-ation and chemistry schemes. There are surface emissions of nine species (NO, CO, HCHO, C2H6, C3H8, CH3COCH3,
CH3CHO, C5H8 and biogenic CH3OH) and multi-level
emissions for NOxemitted from aircraft.
The chemistry scheme used is a combination of the well-established tropospheric (O’Connor et al., 2014) and strato-spheric (Morgenstern et al., 2009) schemes. It includes the Ox, HOxand NOxchemical cycles and the oxidation of CO,
We perform a series of time-slice integrations with fixed boundary conditions. For each, we allow the model to spin up for 10 years and integrate for a further 10 years. Through a total of 10 different simulations, we evaluate the response of the model to three types of perturbations and their combi-nations. The full set of simulations is summarised in Table 1. The Base run is defined by year-2000 boundary conditions.
The separate perturbations are described as follows: i. Climate change (CC) – The climate is changed by
vary-ing concentrations of GHGs (CO2, methane, N2O,
chlo-rofluorocarbons – CFCs – and hydrochlorofluorocar-bons – HCFCs) in the radiation scheme, and prescribed SST/sea ice fields. The changes in GHGs are not im-posed in the chemistry scheme. We adopt three dif-ferent realisations for climate: (a) year 2000, (b) year 2100, RCP4.5, and (c) year 2100, RCP8.5. For year 2000, GHGs are fixed at historical concentrations for this year according to the RCP data set (van Vuuren et al., 2011); the SST/sea ice fields are obtained from the observational HadISST data set (Rayner et al., 2003) and are averages over the years 1998–2002. For year 2100, GHG concentrations are specified according to the concentrations in the RCP4.5 or RCP8.5 scenar-ios; the SST/sea ice fields are obtained from simu-lations using the HadGEM2-CC coupled atmosphere– ocean model for these respective scenarios (Martin et al., 2011) and are averages over the years 2081–2100 (RCP4.5) and 2091–2100 (RCP8.5).
ii. Ozone-depleting substances (ODSs) – Changes in ODSs are imposed only within the chemistry scheme; for radiatively active ODSs (e.g. CFC-11 and CFC-12), these changes are decoupled from the radiation scheme. We only consider future changes in halogen-containing species, while N2O and methane, which are source
gases for ODSs, are left unchanged. For year 2000, we apply historical surface concentrations obtained from the RCP data set; for year 2100, we apply the concen-trations projected by the RCP4.5 scenario.
iii. Ozone precursor emissions (O3pre) – We consider a future reduction in the anthropogenic components of emissions relative to year-2000 values as accord-ing to the RCP4.5 scenario. Emissions from natu-ral sources, including isoprene emissions, remain un-changed. Methane is also not changed in the chemical scheme.
We aim to isolate the impact of LNOx from other effects
of climate change by performing two further simulations in which we fix LNOx but allow climate (and its
influ-ence on convection) to vary between them. These are the Base(fLNOx)and1CC8.5(fLNOx) simulations which are
run under year-2000 and year-2100 RCP8.5 climate, respec-tively. In these, both the amount and distribution of LNOx
are fixed to that of the Base run. To do this, we switch off the interactive calculation of LNOx (see Sect. 2.2) and
in-stead impose a monthly mean climatology of these emissions obtained from the Base run, which is linearly interpolated to 5-day averages. The Base(fLNOx) and Base runs should
be identical; indeed, there are negligible differences in tem-perature, tropospheric ozone and OH between these runs, providing validation for the method of imposing an LNOx
climatology. It is therefore also valid to present results of 1CC8.5(fLNOx) as differences from Base (as with all other
perturbations in this study), with the confidence that there are no differences generated from the contrasting experimental set-ups. Base(fLNOx) will henceforth not be discussed and
1CC8.5(fLNOx) will be referred to as the “fixed-LNOx”
run.
2.2 Lightning NOxparameterisation
LNOxis calculated every hour in UM-UKCA following the
method applied in the p-TOMCAT model. Details of the methodology are provided in Barret et al. (2010) and refer-ences therein but a brief description is provided here. Light-ning flash frequencies are parameterised according to the Price and Rind (1992, 1994a) scheme (henceforth abbrevi-ated as PR92):
Fc=3.44×10⁻⁵H4.9 (1)
Fm=6.40×10⁻⁴H1.73, (2)
whereFc andFmare continental and marine lightning
fre-quencies (flashes min−125 km−2), respectively, andHis the cloud-top height (kilometres above ground level), which is determined from the model convection scheme. The PR92 method for calculating the proportion of cloud-to-ground (CG) and intra-cloud (IC) flashes is incorporated, but here, the energy per flash is constant regardless of the type of flash. 1026 molecules of NO are produced per flash and the flash frequencies are scaled to match observations of the present day (Barret et al., 2010), resulting in 6 Tg(N) yr−1of total, global LNOx for the year 2000. The scaling factor is
un-changed between runs, such that LNOxwill vary only with
changes in convective cloud-top height through changes in convection. The molecules of NOxproduced in each column
are then distributed evenly in log-pressure coordinates from 500 hPa to the cloud top and the ground to 500 hPa for IC and CG flashes, respectively.
Implementation of the PR92 scheme varies in its details from model to model, generally with an aim to generate light-ning flash frequencies and distribution for the present-day at-mosphere (as within the development of UM-UKCA) or for a particular choice of total, global LNOx. In a model study,
Labrador et al. (2005) have demonstrated that, in addition to the overall magnitude of LNOx, concentrations of
vertical distribution of LNOx. However, they were unable to
select a best-fitting distribution due to the low number of ob-servational campaigns and the large scatter in existing data. Compared to other vertical LNOxdistributions, such as those
suggested by Pickering et al. (1998) and Ott et al. (2010), UKCA distributes LNOxmore evenly by mass in the
verti-cal. As a result, UKCA would simulate lower ozone and OH in the mid and upper troposphere for a given magnitude of total LNOx, relative to these distributions. In the lower
tro-posphere and the boundary layer, where NOx lifetimes are
short, trace gas concentrations are far less sensitive to LNOx
(Labrador et al., 2005).
Convection itself is also parameterised at the horizontal resolution used in this model and in most current chemistry– climate and chemical transport models (CCMs, CTMs). Russo et al. (2011) showed that although a high vertical model resolution is needed to match the vertical distribution of clouds to observations, a low horizontal resolution is suf-ficient to capture the geographical distribution.
As in many sensitivity studies, we bear these caveats in mind and use our parameterisations as reference schemes rel-ative to which we study changes. Our goal is thus to under-stand the mechanisms by which climate change could drive changes in chemistry, with a focus on the role of LNOx,
rather than attempt to predict the future state of the atmo-sphere.
3 Results
We primarily address changes related to LNOxbetween the
runs outlined in Sect. 2.1. We will first discuss changes in the LNOx amount and distribution with climate change in
Sect. 3.1. Then, in Sect. 3.2, we will show the resulting impacts on the tropospheric, global odd oxygen budget. In Sect. 3.3, we will address consequences for the OH radical, which principally determines the oxidising capacity of the troposphere, and finally, we will discuss the associated im-pacts on methane and other trace gases in Sect. 3.4.
3.1 Changes in LNOx
The fifth column in Table 1 shows that experiments with a warmer climate simulate greater LNOx. Relative to the
year-2000 climate, there are substantial increases in LNOxof
2 Tg(N) yr−1(33 %) and 4.7 Tg(N) yr−1(78 %) between runs for which only the climate changes, according to the RCP4.5 and RCP8.5 scenarios, respectively. This corresponds to a sensitivity of 0.96 Tg(N) K−1or 16 % K−1although the rela-tionship between LNOxand global mean surface temperature
is not quite linear (not shown). This sensitivity is stronger than that reported by some previous model studies: 9 % K−1 (Brasseur et al., 2006), 12 % K−1(Grenfell et al., 2003), 5– 6 % K−1(Price and Rind, 1994b). This could reflect differ-ences in the specific tuning of the PR92 parameterisation
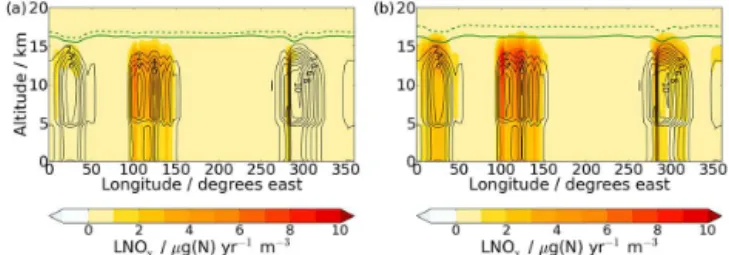
Figure 1.Annual mean, longitude–altitude cross sections of tropi-cally averaged (20◦S–20◦N) LNOx(contours) of the Base run and
changes (shading) from Base to(a)1CC4.5 and(b)1CC8.5. Re-gions which show notable changes in LNOxare: Central Africa (0–
50◦E), the Maritime Continent (100–150◦E) and South America (280–320◦E). Solid (Base run) or dashed (future runs) green lines indicate the height of the thermal tropopause, which is calculated Based on the WMO lapse rate definition (WMO, 1957).
(used in all of these cited studies), in convection schemes and/or in the model resolutions.
With regard to its geographical distribution, LNOxoccurs
predominantly over the tropics in regions which show high convective activity: South America, Central Africa and the West Pacific/Maritime Continent. Figure 1 shows changes in the tropically averaged (20◦S–20◦N), annual mean distribu-tion of LNOxbetween Base and the runs which change
cli-mate only (Fig. 1a:1CC4.5 and Fig. 1b:1CC8.5). Increases in LNOx occur primarily over the Maritime Continent for
1CC4.5.1CC8.5 displays, in addition, large increases over Central Africa and South America, highlighting the potential importance of all three regions with respect to future changes in LNOx. In contrast to the study of Hui and Hong (2013), in
which the Maritime Continent displays the weakest increases in LNOx by 2050 (except in boreal winter when they are
comparable to the increases over South America), this region is associated with the largest changes in LNOxin UM-UKCA
for all months of the year and both RCP scenarios. These op-posing results might be attributable to a difference in model resolutions. Compared to UM-UKCA, the coarser-resolution (4◦×5◦) GEOS-Chem model used by Hui and Hong (2013) is less able to resolve the islands and peninsulas of the Mar-itime Continent, which may result in systematic biases in LNOxover this region.
Changes in LNOxcan result from changes in both the
Table 1.List of model simulations. The final two columns are averages over the 10-year simulation periods.
Scenario Climate (SSTs, ODSs: Cly, Brby Anthropogenic LNOx/ Tg(N) yr−1 Tropospheric ozone
sea ice, GHGsa) ozone precursor emissionsc burden / Tg(O3)
Base 2000 2000 2000 6.04 326
1ODS 2000 2100 (RCP4.5) 2000 5.98 344
1O3pre 2000 2000 2100 (RCP4.5) 5.98 292
1(ODS+O3pre) 2000 2100 (RCP4.5) 2100 (RCP4.5) 6.05 308
1CC4.5 2100 (RCP4.5) 2000 2000 8.08 356
1(CC4.5+ODS) 2100 (RCP4.5) 2100 (RCP4.5) 2000 7.97 374
1(CC4.5+O3pre) 2100 (RCP4.5) 2000 2100 (RCP4.5) 8.01 319
1CC8.5 2100 (RCP8.5) 2000 2000 10.7 369
1(CC8.5+ODS) 2100 (RCP8.5) 2100 (RCP4.5) 2000 10.6 393
1(CC8.5+O3pre) 2100 (RCP8.5) 2000 2100 (RCP4.5) 10.6 337
Base(fLNOx) 2000 2000 2000 6.04d 325
1CC8.5(fLNOx) 2100 (RCP8.5) 2000 2000 6.04d 307
aThese are the changes in GHGs imposed within the radiation scheme only.
bRelative to Base, runs containing1ODS include total chlorine (Cly)and total bromine (Bry)reductions at the surface of 2.3 ppbv (67 %) and 9.7 pptv (45 %), respectively. cRelative to Base, runs containing1O3pre include average global and annual emission changes of: NO(−51 %), CO (−51 %), HCHO(−26 %), C
2H6(−49 %), C3H8(−40 %), CH3COCH3(−2 %), CH3CHO (−28 %).
dLNO
xis not interactively calculated but imposed by applying a monthly mean climatology of the Base run.
Maritime Continent and Africa, respectively, but a decrease of 5.2 % over South America in1CC8.5. Since the PR92 pa-rameterisation for LNOxis highly sensitive to the magnitude
of CTH, it is the increases in the depth of convection, scaling with the climate forcing, which primarily lead to increases in LNOxin our simulations. The effect of the
parameterisa-tion is highlighted over South America in 1CC8.5, where, although convection occurs less often on average, LNOxstill
increases due to an increase in the depth of convection. The largest increases in LNOxoccur over the Maritime Continent
because this region is associated with the largest increases in both the frequency and depth of convection.
3.2 Changes in ozone
As a global measure of changes in ozone, we have analysed the tropospheric budget of odd oxygen (Ox), of which
chem-ical production (P(Ox)) represents one term. Since LNOxis
one driver ofP(Ox), we first study the correlation between
P(Ox) and LNOx, shown in Fig. 2a. For each set of
ex-periments (i.e. climate change; climate change plus changes in ODSs; and climate change plus changes in tropospheric ozone precursors), a highly linear fit between the changes in P(Ox) and LNOxis found. Within this ensemble of
simula-tions, we find that increases in LNOxwith climate change are
concurrent with increases inP(Ox) of 413±28 Tg(O3)yr−1
and 979±33 Tg(O3)yr−1for the RCP4.5 and RCP8.5 sce-narios, respectively, where the reported ranges represent the interannual variability as one standard deviation.
Figure 2a allows for an assessment of the importance of climate-change versus non-climate-change-related im-pacts on P(Ox). Reductions in P(Ox) of approximately
100 Tg(O3)yr−1 due to removal of ODSs (green line,
Figure 2.Correlation between(a)P(Ox) and LNOxand(b)
tropo-spheric ozone burden and LNOx. Linear fits in(a)and connecting
lines in(b)are drawn between runs which differ only in their cli-mate states. Error bars indicate±1 standard deviation.
Fig. 2a) are small in magnitude relative to climate-change-driven increases. Runs containing reduced emissions of an-thropogenic ozone precursors (red line, Fig. 2a) show ap-proximately 800 Tg(O3)yr−1lowerP(Ox) than
correspond-ing runs without (blue line). However, for the RCP8.5 sce-nario, this reduction is more than cancelled by the ef-fect of climate change on LNOx, such that P(Ox) in
1(CC8.5+O3pre) is greater than in Base.
P(Ox) represents one of four contributing terms to the
global burden of ozone in the troposphere, the others be-ing chemical loss (L(Ox)), deposition and stratosphere–
troposphere exchange (STE). A future publication will dis-cuss the effect of the applied perturbations on these terms in detail. Here, we simply note that LNOx-driven increases in
P(Ox) induced by climate change represent a significant
for RCP4.5 and 46±4 Tg(O3) for RCP8.5, as shown in
Ta-ble 1 and Fig. 2b. In contrast to P(Ox), the changes in
ozone burden and LNOxare non-linearly related, since
sev-eral factors, and not just LNOx, contribute significantly to
changes in the burden in a warmer climate. From Fig. 2b, it is also evident that the decrease in burden of 34±4 Tg(O3) due to 1O3pre is just outweighed by the increase in 1(CC8.5+O3pre), although by using a fixed methane sur-face concentration in these simulations, the additional feed-backs on ozone and OH are not included (see Sect. 3.4). Nev-ertheless, it appears that reductions in the ozone burden due to emission policies could be counteracted by future changes in climate.
To confirm that LNOx is the dominant factor leading to
increases in P(Ox) and the ozone burden, we examine the
1CC8.5(fLNOx) simulation, which includes RCP8.5
cli-mate forcings but with LNOxtaken from the Base run rather
than calculated online. Table 2 shows numerical changes in the tropospheric Ox budget terms for the 1CC8.5 and
1CC8.5(fLNOx)runs relative to Base. With fixed LNOx,
P(Ox) increases by only 7.0 % as compared to 20.1 % when
LNOxis allowed to vary with climate. There is strong
buffer-ing in the response of the burden by the loss terms: fix-ing LNOx also leads to smaller magnitude changes in loss
through L(Ox) and deposition. Overall however, there is a
greater decrease in net chemical production (P(Ox) minus
L(Ox)) from Base for1CC8.5(fLNOx)than for1CC8.5.
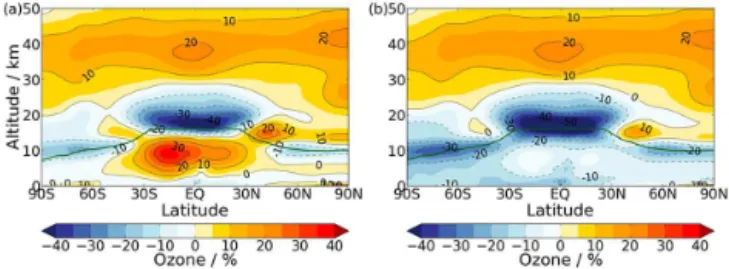
Table 2 shows that we also find a smaller increase in STE when fixing LNOx. Comparing Fig. 3a and b gives one
possible explanation: without increases in LNOxand
conse-quently upper tropospheric ozone, the amount of ozone in the lower stratosphere is reduced (following entry into the trop-ical lower stratosphere and quasi-horizontal mixing). In the mid-latitudes, this would reduce the STE of ozone back into the troposphere. Thus, in our model, we estimate that the in-crease in LNOxwith climate change at RCP8.5 contributes
6.4 % to the increase in STE.
Importantly, the balance between the budget terms means that, without inclusion of changes in LNOx, there results a
slight decrease (−5.8 %) rather than an increase (13.2 %) in the ozone burden with climate change at RCP8.5. In fact, the decrease in ozone is seen throughout the troposphere in the zonal and annual mean (Fig. 3b), primarily due to increased humidity in a warmer climate (e.g. Thompson et al., 1989). Hence, these results suggest that climate change would en-hance possible future mitigation of free tropospheric ozone if LNOxwere not to increase in a warmer climate.
3.3 Changes in OH
The impacts of LNOx extend to other chemical species.
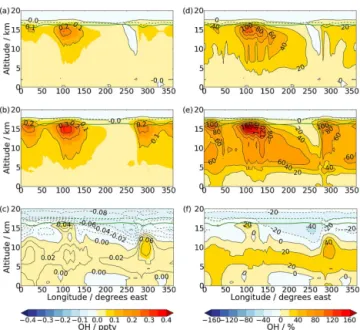
Figure 4 illustrates changes in the tropically averaged (20◦S–20◦N), annual mean distribution of OH for1CC4.5, 1CC8.5 and1CC8.5(fLNOx)as absolute (a–c) and relative
differences (d–f) from Base. Regions of OH enhancement in
Figure 3. Annual mean, zonal mean changes (shading and contours) in ozone (%) relative to Base for (a) 1CC8.5 and (b)1CC8.5(fLNOx). Solid green lines indicate the height of the
thermal tropopause of the Base run.
Fig. 4 correspond to regions of increased LNOx in Fig. 1.
The Maritime Continent, which experiences the greatest in-creases in LNOx in these simulations, also displays the
strongest enhancements in OH. Figure 4 shows that these changes are large, with a peak of over 0.2 pptv (100 %) for1CC4.5 and 0.3 pptv (160 %) for1CC8.5. An analysis of species concentrations and reaction fluxes indicates that these changes in OH are due to a combination of:
1. direct chemical conversion of HO2to OH via NO
emit-ted from lightning;
2. deeper convection transporting water vapour into these regions of the UT and hence inducing OH production through O(1D)+H2O;
3. feedbacks through other chemical species: e.g. ozone produced following process (i) can photolyse to produce O(1D) and induce OH production, once again, through O(1D)+H2O.
We examined process (ii) in isolation by switching LNOx
changes off in the model in the1CC8.5(fLNOx)simulation.
So, when LNOxincreases are ignored (Fig. 4c and f), we only
find an increase in OH over the Maritime Continent, amount-ing to about 20 %. OH decreases elsewhere, indicatamount-ing that an increase in water vapour transport into the tropical UT is not the dominant process controlling OH increases with cli-mate change throughout that region. In contrast, our analysis shows that LNOxincreases the flux through HO2+NO
(pro-cess i) and, as a result, also through O(1D)+H2O (process iii) throughout the tropical UT.
3.4 Consequences for methane and other trace gases
Table 2.Tropospheric Oxbudget of the Base run and changes from Base to1CC8.5 and1CC8.5(fLNOx),with absolute values reported to
the nearest integer. The Base methane lifetime and its changes are also reported.
Base 1CC8.5-Base 1CC8.5(fLNOx)-Base
Production / Tg(O3) yr−1 4872 979 (20.1 %) 340 (7.0 %)
Loss / Tg(O3) yr−1 4217 1088 (25.8 %) 499 (11.8 %)
Net chemical production / Tg(O3)yr−1 655 −109 (−16.6 %) −159 (−24.3 %)
Deposition / Tg(O3)yr−1 1015 −8 (−0.8 %) −82 (−8.1 %)
STE inferred∗/ Tg(O3)yr−1 360 101 (28.1 %) 78 (21.7 %)
Burden / Tg(O3) 326 43 (13.2 %) −19 (−5.8 %)
Methane lifetime / yrs 7.60 −1.79 (−23.6 %) −1.04 (−13.7 %)
∗Stratosphere–troposphere exchange calculated as the residual from closure of the Oxbudget.
Figure 4.Annual mean, longitude–altitude cross sections of trop-ically averaged (20◦S–20◦N) changes (shading and contours) in OH volume mixing ratios (pptv) from Base to (a) 1CC4.5(b) 1CC8.5 and (c)1CC8.5(fLNOx); the differences as a
percent-age of the Base values for (d) 1CC4.5 (e) 1CC8.5 and (f) 1CC8.5(fLNOx). Solid (Base run) or dashed (future runs) green
lines indicate the height of the thermal tropopause.
from the 1CC8.5(fLNOx)run. Relative to Base, a
reduc-tion of 1.79 years in the methane lifetime against loss by OH (τCH4+OH)is calculated for1CC8.5; in contrast, a smaller
reduction of 1.04 years is found for 1CC8.5(fLNOx).
In-clusion of changes in LNOx thus contributes 0.75 years to
the reduction inτCH4+OHdue to climate change.
Changes inτCH4+OHwill have implications for both
chem-istry and climate through methane’s role as a tropospheric ozone precursor, an OH sink and a greenhouse gas. However, by fixing a uniform lower boundary condition for methane, such feedbacks are essentially neglected within these experi-ments. If methane concentrations were allowed to respond to decreases in its lifetime with climate change, lower methane
concentrations would be simulated at equilibrium in a fu-ture climate, with a lower increase in ozone burden and an enhanced increase in OH. The strength of the response is determined by the model-dependent methane feedback fac-tor, f (Fuglestvedt et al., 1999). Using a further integra-tion in which methane is increased by 20 % in the chem-istry scheme only (not otherwise discussed here), we derive a value of 1.52 forf in our model, which lies on the up-per end of the large literature range (1.19–1.53) (Prather et al., 2001; Voulgarakis et al., 2013; Stevenson et al., 2013). From this, we obtain an estimate of equilibrium methane con-centrations, following the methodology detailed in Steven-son et al. (2013), and equilibrium ozone burdens, follow-ing Wild et al. (2012). We find that accountfollow-ing for methane adjustments lowers the ozone burden in future climate sim-ulations by, on average, 5 Tg(O3) (RCP4.5) and 13 Tg(O3)
(RCP8.5). The corresponding increases in ozone burden relative to Base are 24 Tg(O3) (RCP4.5) and 33 Tg(O3)
(RCP8.5), which still represent substantial increases with fu-ture climate change and greater LNOx. The adjusted increase
in burden in 1(CC8.5+O3pre) (33 Tg(O3)) is now more comparable to the adjusted decrease in1O3pre (32 Tg(O3)).
4 Summary
We have assessed the impacts of climate change on emissions of NOx from lightning (LNOx) and the consequences for
tropospheric chemistry using UM-UKCA. Using the Price and Rind (1992, 1994a) parameterisation for calculation of LNOx, our year-2000 integrations generate 6 Tg(N) yr−1of
total, global LNOx, which lies within the range of values
simulated in the literature (e.g. Schumann and Huntrieser, 2007) and within 1σ of the ACCMIP multi-model mean (Young et al., 2013). We simulate greater LNOx at the
year 2100 under two scenarios for future climate change: RCP4.5 and RCP8.5, with LNOxincreases of 2 Tg(N) yr−1
(33 %) and 4.7 Tg(N) yr−1(78 %), respectively, primarily in response to increases in the depth of convection. These cor-respond to a greater sensitivity of LNOx to climate than
found in some other studies and the total LNOx simulated
for RCP8.5 is above 1σ of the ACCMIP models. The sen-sitivity will depend upon the treatment of convection and LNOxin the different models; these remain an area of
con-siderable uncertainty. Note that we have not explored other LNOxparameterisations and some studies using alternate
ap-proaches, such as those Based on convective mass fluxes, have found different sensitivities for lightning changes un-der a warmer climate (e.g. Grewe, 2009). However, the PR92 method employed here is commonly adopted in state-of-the-art chemistry–climate models, such as most of the ACCMIP models (Lamarque et al., 2013).
For the simulations which change climate only between the years 2000 and 2100, according to RCP4.5 (1CC4.5) and RCP8.5 (1CC8.5), we also analysed changes in the dis-tribution of LNOxwithin the tropics. Increases in LNOxare
found to occur predominantly over the Maritime Continent for 1CC4.5 but also over Central Africa and South Amer-ica for1CC8.5. The Maritime Continent is associated with the largest increases in both the overall frequency and depth of convection, which explains the largest increases in LNOx
found over this region.
A positive and linear relationship is simulated be-tween the changes in LNOx and global, tropospheric
chemical Ox production (P(Ox)), which increases by
413±28 Tg(O3)yr−1and 979±33 Tg(O3)yr−1for climate change under the RCP4.5 and RCP8.5 scenarios, respec-tively. The tropospheric ozone burden increases corre-spondingly by 29±4 Tg(O3) (RCP4.5) and 46±4 Tg(O3)
(RCP8.5). We confirm through a fixed-LNOxrun that LNOx
plays the major role in these correlations, contributing more than 50 % to the increase inP(Ox) at RCP8.5. We also show
that the effects of climate change, at least for the RCP8.5 scenario, would decrease the ozone burden if this effect on P(Ox) through LNOxwere not present.
To examine the sensitivity of the effects of climate change to the background state of the atmosphere, three sets of experiments were conducted which combined the separate climate forcings with different chemical drivers: (i)
year-2000 chemical boundary conditions, (ii) lower concentra-tions of stratospheric ozone-depleting substances, and (iii) lower emissions of tropospheric ozone precursors. The lin-ear relationship between the increases in LNOx andP(Ox)
and the corresponding increases in tropospheric ozone bur-den under climate change are found to be quantitatively ro-bust under the different chemical background states. Hence, although we find that regulations aimed at air quality im-provement decrease the future tropospheric burden of ozone in the 1O3pre simulation, we suggest that climate change and increased LNOxcould counteract this change.
Changes in LNOximpact on the OH radical. Our1CC4.5
and1CC8.5 simulations show positive anomalies in upper tropospheric OH over Central Africa, South America and the Maritime Continent. The effect is greatest over the Maritime Continent in both these simulations and is particularly large in 1CC8.5, in which an increase of over 160 % is found in this region. The response is not reproduced by the fixed-LNOx run, leading us to conclude that LNOx drives these
changes in OH, although we also find a smaller contribu-tion from deeper conveccontribu-tion over the Maritime Continent. An analysis of reaction fluxes indicates that the dominant reac-tion pathways for increased OH producreac-tion through LNOxin
these regions are HO2+NO (directly, following production
of NOx) and O(1D)+H2O (indirectly, through
photochemi-cal ozone and hence O(1D) production).
Changes in OH could have further important conse-quences. For methane, we quantify the LNOx–OH-driven
impact on its lifetime against loss by OH (τCH4+OH)
us-ing the fixed-LNOx run. LNOx contributes 0.75 years to
the decrease in τCH4+OH projected under climate change
at RCP8.5. The resulting changes in methane concentration and subsequent feedbacks are not simulated by these exper-iments. Since methane is both a tropospheric ozone precur-sor and an OH sink, we expect that a shorterτCH4+OHwould
feedback negatively into LNOx-driven increases in ozone but
positively into increases in OH. For ozone, we have estimated that accounting for adjustments in methane concentration in a changing climate would lead to increases in the ozone bur-den of 24 Tg(O3) (RCP4.5) and 33 Tg(O3) (RCP8.5).
Al-though, as expected, these are smaller than the simulated changes reported above (of 29 and 46 Tg(O3), respectively),
they still represent substantial increases through future cli-mate change. Since methane is a greenhouse gas, we would also expect a negative feedback into climate change through its radiative forcing effect.
In addition, very short-lived substances (VSLS), which have a strong source region in the Maritime Continent and are convectively lifted into the UT, could undergo enhanced ox-idation by OH if the levels of the latter were to increase over this region. Some studies (e.g. Dessens et al., 2009; Hossaini et al., 2012) project an increase in concentrations of VSLS or their oxidised products in the UTLS, which deplete ozone if they remain in the stratosphere. LNOx-derived OH could
We have demonstrated that NOx production from
light-ning, following tropical convection, is a key process through which climate can influence the chemistry of the tropo-sphere. Hence, given its importance, we believe it is cru-cial to strengthen our confidence in model representations of both convection and LNOx. Our results are dependent on the
LNOxand convective parameterisations utilised. In
particu-lar, the vertical profile of LNOxaffects the simulated changes
in ozone and OH, particularly in the UT (Labrador et al., 2005). If we were to employ the vertical distributions of Pick-ering et al. (1998) or Ott et al. (2010), which weight LNOx
more greatly to the UT than is done in UKCA, we postulate that even larger changes in ozone, OH and subsequent feed-backs would occur for a given change in total LNOx.
Acknowledgements. We thank the ERC for support under the ACCI project no. 267 760. ATA was supported by a fellowship from the Herchel Smith Foundation. A. C. Maycock was supported by a postdoctoral fellowship from the AXA Research Fund.
Edited by: P. Jöckel
References
Archibald, A. T., Levine, J. G., Abraham, N. L., Cooke, M. C., Ed-wards, P. M., Heard, D. E., Jenkin, M. E., Karunaharan, A., Pike, R. C., Monks, P. S., Shallcross, D. E., Telford, P. J., Whalley, L. K., and Pyle, J. A.: Impacts of HOxregeneration and recycling
in the oxidation of isoprene: consequences for the composition of past, present and future atmospheres, Geophys. Res. Lett., 38, L05804, doi:10.1029/2010GL046520, 2011.
Barret, B., Williams, J. E., Bouarar, I., Yang, X., Josse, B., Law, K., Pham, M., Le Flochmoën, E., Liousse, C., Peuch, V. H., Carver, G. D., Pyle, J. A., Sauvage, B., van Velthoven, P., Schlager, H., Mari, C., and Cammas, J.-P.: Impact of West African Mon-soon convective transport and lightning NOxproduction upon
the upper tropospheric composition: a multi-model study, At-mos. Chem. Phys., 10, 5719–5738, doi:10.5194/acp-10-5719-2010, 2010.
Brasseur, G. P., Schultz, M. G., Granier, C., Saunois, M., Diehl, T., Botzet, M., and Roeckner, E.: Impact of climate change on the fu-ture chemical composition of the global troposphere, J. Climate, 19, 3932–3951, doi:10.1175/JCLI3832.1, 2006.
Chadwick, R., Wu, P., Good, P., and Andrews, T.: Asym-metries in tropical rainfall and circulation patterns in ide-alised CO2 removal experiments, Clim. Dynam., 40, 295–316, doi:10.1007/s00382-012-1287-2, 2012.
Chadwick, R., Boutle, I., and Martin, G.: Spatial patterns of pre-cipitation change in CMIP5: why the rich do not get richer in the tropics, J. Climate, 26, 3803–3822, doi:10.1175/JCLI-D-12-00543.1, 2013.
Chou, C. and Chen, C.-A.: Depth of convection and the weakening of tropical circulation in global warming, J. Climate, 23, 3019– 3030, doi:10.1175/2010JCLI3383.1, 2010.
Chou, C., Neelin, J. D., Chen, C.-A., and Tu, J.-Y.: Evaluat-ing the “rich-get-richer” mechanism in tropical precipitation
change under global warming, J. Climate, 22, 1982–2005, doi:10.1175/2008JCLI2471.1, 2009.
Dessens, O., Zeng, G., Warwick, N., and Pyle, J.: Short-lived bromine compounds in the lower stratosphere; impact of climate change on ozone, Atmos. Sci. Lett., 10, 201–206, doi:10.1002/asl.236, 2009.
Forster, P. M. d. F. and Shine, K. P.: Radiative forcing and temper-ature trends from stratospheric ozone changes, J. Geophys. Res., 102, 10841–10855, doi:10.1029/96JD03510, 1997.
Fuglestvedt, J. S., Berntsen, T. K., Isaksen, I. S. A., Mao, H., Liang, X.-Z., and Wang, W.-C.: Climatic forcing of nitrogen oxides through changes in tropospheric ozone and methane; global 3-D model studies, Atmos. Environ., 33, 961–977, 1999.
Grenfell, J. L., Shindell, D. T., and Grewe, V.: Sensitivity studies of oxidative changes in the troposphere in 2100 using the GISS GCM, Atmos. Chem. Phys., 3, 1267–1283, doi:10.5194/acp-3-1267-2003, 2003.
Grewe, V.: Impact of Lightning on Air Chemistry and Climate, in: Lightning: Principles, Instruments and Applications, Review of Modern Lightning Research, edited by: Betz, H. D., Schumann, U., and Laroche, P., Springer Science+Business Media B. V., 524–551, doi:10.1007/978-1-4020-9079-0_25, 2009.
Hewitt, H. T., Copsey, D., Culverwell, I. D., Harris, C. M., Hill, R. S. R., Keen, A. B., McLaren, A. J., and Hunke, E. C.: Design and implementation of the infrastructure of HadGEM3: the next-generation Met Office climate modelling system, Geosci. Model Dev., 4, 223–253, doi:10.5194/gmd-4-223-2011, 2011.
Holmes, C. D., Prather, M. J., Søvde, O. A., and Myhre, G.: Fu-ture methane, hydroxyl, and their uncertainties: key climate and emission parameters for future predictions, Atmos. Chem. Phys., 13, 285–302, doi:10.5194/acp-13-285-2013, 2013.
Hosking, J. S., Russo, M. R., Braesicke, P., and Pyle, J. A.: Mod-elling deep convection and its impacts on the tropical tropopause layer, Atmos. Chem. Phys., 10, 11175–11188, doi:10.5194/acp-10-11175-2010, 2010.
Hossaini, R., Chipperfield, M. P., Dhomse, S., Ordóñez, C., Saiz-Lopez, A., Abraham, N. L., Archibald, A., Braesicke, P., Telford, P., Warwick, N., Yang, X., and Pyle, J.: Mod-elling future changes to the stratospheric source gas injection of biogenic bromocarbons, Geophys. Res. Lett., 39, L20813, doi:10.1029/2012GL053401, 2012.
Hui, J. and Hong, L.: Projected changes in NOx Emissions
from lightning as a result of 2000–2050 climate change, At-mos. Oceanic Sci. Lett., 6, 284–289, doi:10.3878/j.issn.1674-2834.13.0042, 2013.
IPCC: Climate Change 2013: The Physical Science Basis. Contri-bution of Working Group I to the Fifth Assessment Report of the Intergovernmental Panel on Climate Change, edited by: Stocker, T. F., Qin, D., Plattner, G.-K., Tignor, M., Allen, S. K., Boschung, J., Nauels, A., Xia, Y., Bex, V., and Midgley, P. M., Cambridge University Press, Cambridge, United Kingdom and New York, NY, USA, 2013.
Labrador, L. J., von Kuhlmann, R., and Lawrence, M. G.: The effects of lightning-produced NOxand its vertical distribution
on atmospheric chemistry: sensitivity simulations with MATCH-MPIC, Atmos. Chem. Phys., 5, 1815–1834, doi:10.5194/acp-5-1815-2005, 2005.
Do-herty, R., Dalsoren, S., Faluvegi, G., Folberth, G., Ghan, S. J., Horowitz, L. W., Lee, Y. H., MacKenzie, I. A., Nagashima, T., Naik, V., Plummer, D., Righi, M., Rumbold, S. T., Schulz, M., Skeie, R. B., Stevenson, D. S., Strode, S., Sudo, K., Szopa, S., Voulgarakis, A., and Zeng, G.: The Atmospheric Chemistry and Climate Model Intercomparison Project (ACCMIP): overview and description of models, simulations and climate diagnostics, Geosci. Model Dev., 6, 179–206, doi:10.5194/gmd-6-179-2013, 2013.
Ma, J. and Xie, S.-P.: Regional patterns of sea surface temperature change: a source of uncertainty in future projections of precip-itation and atmospheric circulation, J. Climate, 26, 2482–2501, doi:10.1175/JCLI-D-12-00283.1, 2013.
Ma, J., Xie, S.-P., and Kosaka, Y.: Mechanisms for tropical tropo-spheric circulation change in response to global warming, J. Cli-mate, 25, 2979–2994, doi:10.1175/JCLI-D-11-00048.1, 2012. Morgenstern, O., Braesicke, P., O’Connor, F. M., Bushell, A. C.,
Johnson, C. E., Osprey, S. M., and Pyle, J. A.: Evaluation of the new UKCA climate-composition model – Part 1: The strato-sphere, Geosci. Model Dev., 2, 43–57, doi:10.5194/gmd-2-43-2009, 2009.
Murray, L. T., Mickley, L. J., Kaplan, J. O., Sofen, E. D., Pfeiffer, M., and Alexander, B.: Factors controlling variability in the ox-idative capacity of the troposphere since the Last Glacial Maxi-mum, Atmos. Chem. Phys., 14, 3589–3622, doi:10.5194/acp-14-3589-2014, 2014.
O’Connor, F. M., Johnson, C. E., Morgenstern, O., Abraham, N. L., Braesicke, P., Dalvi, M., Folberth, G. A., Sanderson, M. G., Telford, P. J., Voulgarakis, A., Young, P. J., Zeng, G., Collins, W. J., and Pyle, J. A.: Evaluation of the new UKCA climate-composition model – Part 2: The Troposphere, Geosci. Model Dev., 7, 41–91, doi:10.5194/gmd-7-41-2014, 2014.
Ott, L. E., Pickering, K. E., Stenchikov, G. L., Allen, D. J., DeCaria, A. J., Ridley, B., Lin, R.-F., Lang, S., and Tao, W.-K.: Production of lightning NOx and its vertical
distribu-tion calculated from three-dimensional cloud-scale chemical transport model simulations, J. Geophys. Res., 115, D04301, doi:10.1029/2009JD011880, 2010.
Pickering, K. E., Wang, Y., Tao, W.-K., Price, C., and Müller, J.-F.: Vertical distributions of lightning NOx for use in regional and
global chemical transport models, J. Geophys. Res., 103, 31203– 31216, 1998.
Prather, M. J., Ehhalt, D., Dentener, F., Derwent, R., Dlugokencky, E., Holland, E., Isaksen, I., Katima, J., Kirchoff, V., Matson, P., Midgley, P., and Wang, M.: Atmospheric chemistry and green-house gases, in: Climate Change 2001: The Scientific Basis, Con-tribution of Working Group I to the Third Assessment Report of the Intergovernmental Panel on Climate Change, Houghton, J. T., Ding, Y., Griggs, D. J., Noguer, M., van der Linden, P. J., Dai, X., Maskell, K., and Johnson, C. A., Cambridge University Press, Cambridge, UK, 329–287, 2001.
Price, C. and Rind, D.: A simple lightning parameterization for calculating global lightning distributions, J. Geophys. Res., 97, 9919–9933, 1992.
Price, C. G. and Rind, D.: Modeling global lightning distributions in a general circulation model, Monthly Weather Rev., 122, 1930– 1939, 1994a.
Price, C. G. and Rind, D.: Possible implications of global climate change on global lightning distributions and frequencies, J. Geo-phys. Res., 99, 10823–10831, 1994b.
Price, C. G.: Lightning applications in weather and climate research, Surv. Geophys., 34, 755–767, doi:10.1007/s10712-012-9218-7, 2013.
Rayner, N. A., Parker, D. E., Horton, E. B., Folland, C. K., Alexan-der, L. V., Rowell, D. P., Kent, E. C., and Kaplan, A.: Global analyses of sea surface temperature, sea ice, and night marine air temperature since the late nineteenth century, J. Geophys. Res., 108, 4407, doi:10.1029/2002JD002670, 2003.
Russo, M. R., Marécal, V., Hoyle, C. R., Arteta, J., Chemel, C., Chipperfield, M. P., Dessens, O., Feng, W., Hosking, J. S., Telford, P. J., Wild, O., Yang, X., and Pyle, J. A.: Representa-tion of tropical deep convecRepresenta-tion in atmospheric models – Part 1: Meteorology and comparison with satellite observations, At-mos. Chem. Phys., 11, 2765–2786, doi:10.5194/acp-11-2765-2011, 2011.
Ryu, J.-H. and Jenkins, G. S.: Lightning-tropospheric ozone con-nections: EOF analysis of TCO and lightning data, Atmos. Envi-ron., 39, 5799–5805, doi:10.1016/j.atmosenv.2005.05.047, 2005. Schumann, U. and Huntrieser, H.: The global lightning-induced nitrogen oxides source, Atmos. Chem. Phys., 7, 3823–3907, doi:10.5194/acp-7-3823-2007, 2007.
Stevenson, D. S., Young, P. J., Naik, V., Lamarque, J.-F., Shindell, D. T., Voulgarakis, A., Skeie, R. B., Dalsoren, S. B., Myhre, G., Berntsen, T. K., Folberth, G. A., Rumbold, S. T., Collins, W. J., MacKenzie, I. A., Doherty, R. M., Zeng, G., van Noije, T. P. C., Strunk, A., Bergmann, D., Cameron-Smith, P., Plummer, D. A., Strode, S. A., Horowitz, L., Lee, Y. H., Szopa, S., Sudo, K., Na-gashima, T., Josse, B., Cionni, I., Righi, M., Eyring, V., Conley, A., Bowman, K. W., Wild, O., and Archibald, A.: Tropospheric ozone changes, radiative forcing and attribution to emissions in the Atmospheric Chemistry and Climate Model Intercompari-son Project (ACCMIP), Atmos. Chem. Phys., 13, 3063–3085, doi:10.5194/acp-13-3063-2013, 2013.
The HadGEM2 Development Team: Martin, G. M., Bellouin, N., Collins, W. J., Culverwell, I. D., Halloran, P. R., Hardiman, S. C., Hinton, T. J., Jones, C. D., McDonald, R. E., McLaren, A. J., O’Connor, F. M., Roberts, M. J., Rodriguez, J. M., Woodward, S., Best, M. J., Brooks, M. E., Brown, A. R., Butchart, N., Dear-den, C., Derbyshire, S. H., Dharssi, I., Doutriaux-Boucher, M., Edwards, J. M., Falloon, P. D., Gedney, N., Gray, L. J., Hewitt, H. T., Hobson, M., Huddleston, M. R., Hughes, J., Ineson, S., In-gram, W. J., James, P. M., Johns, T. C., Johnson, C. E., Jones, A., Jones, C. P., Joshi, M. M., Keen, A. B., Liddicoat, S., Lock, A. P., Maidens, A. V., Manners, J. C., Milton, S. F., Rae, J. G. L., Rid-ley, J. K., Sellar, A., Senior, C. A., Totterdell, I. J., Verhoef, A., Vidale, P. L., and Wiltshire, A.: The HadGEM2 family of Met Of-fice Unified Model climate configurations, Geosci. Model Dev., 4, 723–757, doi:10.5194/gmd-4-723-2011, 2011.
Thompson, A. M., Stewart, R. W., Owens, M. A., and Herwehe, J. A.: Sensitivity of tropospheric oxidants to global chemical and climate change, Atmos. Environ., 23, 519–532, 1989.
van Vuuren, D. P., Edmonds, J., Kainuma, M., Riahi, K., Thom-son, A., Hibbard, K., Hurtt, G. C., Kram, T., Krey, V., Lamarque, J.-F., Masui, T., Meinshausen, M., Nakicenovic, N., Smith, S. J., and Rose, S. K.: The representative concentration pathways: an overview, Clim. Change, 109, 5–31, doi:10.1007/s10584-011-0148-z, 2011.
Voulgarakis, A., Naik, V., Lamarque, J.-F., Shindell, D. T., Young, P. J., Prather, M. J., Wild, O., Field, R. D., Bergmann, D., Cameron-Smith, P., Cionni, I., Collins, W. J., Dalsøren, S. B., Doherty, R. M., Eyring, V., Faluvegi, G., Folberth, G. A., Horowitz, L. W., Josse, B., MacKenzie, I. A., Nagashima, T., Plummer, D. A., Righi, M., Rumbold, S. T., Stevenson, D. S., Strode, S. A., Sudo, K., Szopa, S., and Zeng, G.: Analysis of present day and future OH and methane lifetime in the ACCMIP simulations, Atmos. Chem. Phys., 13, 2563–2587, doi:10.5194/acp-13-2563-2013, 2013.
Wild, O., Fiore, A. M., Shindell, D. T., Doherty, R. M., Collins, W. J., Dentener, F. J., Schultz, M. G., Gong, S., MacKenzie, I. A., Zeng, G., Hess, P., Duncan, B. N., Bergmann, D. J., Szopa, S., Jonson, J. E., Keating, T. J., and Zuber, A.: Modelling fu-ture changes in surface ozone: a parameterized approach, At-mos. Chem. Phys., 12, 2037–2054, doi:10.5194/acp-12-2037-2012, 2012.
Williams, E. R.: Lightning and climate: a review, Atmos. Res., 76, 272–287, doi:10.1016/j.atmosres.2004.11.014, 2005.
WMO: Meteorology – a three-dimensional science: second session of the Commission for Aerology, WMO Bull., 4, 134–138, 1957. Wong, J., Barth, M. C., and Noone, D.: Evaluating a lightning parameterization based on cloud-top height for mesoscale nu-merical model simulations, Geosci. Model Dev., 6, 429–443, doi:10.5194/gmd-6-429-2013, 2013.
Xie, S.-P., Deser, C., Vecchi, G. a., Ma, J., Teng, H., and Wittenberg, A. T.: Global warming pattern formation: sea surface temperature and rainfall, J. Clim., 23, 966–986, doi:10.1175/2009JCLI3329.1, 2010.
Young, P. J., Archibald, A. T., Bowman, K. W., Lamarque, J.-F., Naik, V., Stevenson, D. S., Tilmes, S., Voulgarakis, A., Wild, O., Bergmann, D., Cameron-Smith, P., Cionni, I., Collins, W. J., Dal-søren, S. B., Doherty, R. M., Eyring, V., Faluvegi, G., Horowitz, L. W., Josse, B., Lee, Y. H., MacKenzie, I. A., Nagashima, T., Plummer, D. A., Righi, M., Rumbold, S. T., Skeie, R. B., Shin-dell, D. T., Strode, S. A., Sudo, K., Szopa, S., and Zeng, G.: Pre-industrial to end 21st century projections of tropospheric ozone from the Atmospheric Chemistry and Climate Model Intercom-parison Project (ACCMIP), Atmos. Chem. Phys., 13, 2063– 2090, doi:10.5194/acp-13-2063-2013, 2013.
Zeng, G. and Pyle, J. A.: Changes in tropospheric ozone between 2000 and 2100 modeled in a chemistry-climate model, Geophys. Res. Lett., 30, 1–4, doi:10.1029/2002GL016708, 2003. Zeng, G., Pyle, J. A., and Young, P. J.: Impact of climate change on