online | memorias.ioc.fiocruz.br
Schistosomiasis mansoni is an endemic disease in approximately 54 countries in the Americas and Afri-ca (WHO 1985, Chitsulo et al. 2000). Schistosomiasis is facilitated by the presence of susceptible intermedi-ate host mollusks of the Biomphalaria genus. The snail fauna of the genus Biomphalaria in the state of Minas Gerais (MG) are represented by seven species: Biompha-laria glabrata, Biomphalaria straminea, Biomphalaria tenagophila, Biomphalaria peregrina, Biomphalaria schrammi, Biomphalaria intermedia and Biompha-laria occidentalis (Katz & Carvalho 1983, Carvalho et al. 1987, 1988, 1989, 1994, 1997, 1998). In Brazil, there are three species of Biomphalaria (B. glabrata, B. tenagophila and B. straminea) that are naturally infected by Schistosoma mansoni. Among those found in MG, B. glabrata is considered the most important intermediate host due to its wide geographical distribution, high in-fection indices and efficient transmission of the disease. B. tenagophila is naturally infected by S. mansoni in MG and it is responsible for the maintenance of disease
foci in the city of Itajubá (Katz & Carvalho 1983). B. straminea, although never found to be infected in MG, was considered responsible for the schistosomiasis focus in Paracatu (MG) (Carvalho et al. 1988).
The mollusks of the Biomphalaria genus live in a wide range of habitats, particularly in shallow and slow-running waters, such as lakes, lagoons, wells, cisterns, swamps, brooks, irrigation ditches and drainage ditches, where the substratum can be a muddy or rocky bed and with floating or rooted vegetation. As these mollusks are distributed over large geographic areas and their popula-tions are adapted to different environmental condipopula-tions, they can tolerate large variations in the physical, chemi-cal and biologichemi-cal environment in which they live (Gui-marães et al. 2008).
The presence of mollusks of different species can be viewed as categorical data, which can be obtained by fieldwork. The geostatistical procedures for classifying spatial categorical attributes in a Geographical Informa-tion Systems (GIS) can be used to infer events in areas with no information, based on sample points of the cat-egorical attribute under interest (Felgueiras 1999).
Schistosomiasis distribution in MG is not regular, as areas of high prevalence are close to non-endemic re-gions. Therefore, despite advances in knowledge in the study of schistosomiasis, the disease remains a major public health problem in the country, requiring larger investments in preventive measures such as sanitation and health education, as well as in studies that enable disease control through geoprocessing methodologies (Guimarães et al. 2009).
Financial support: CNPq (302966/2009-9, 490336/2007-8, 380203/2004-9, 308253/2008-6), FAPEMIG (EDP 1775/03, EDT 61775/03), NIH-Fogarty (5D43TW007012)
+ Corresponding author: [email protected] Received 5 February 2009
Accepted 10 February 2010
A geoprocessing approach for studying and controlling
schistosomiasis in the state of Minas Gerais, Brazil
Ricardo José de Paula Souza Guimarães1,2, Corina Costa Freitas3, Luciano Vieira Dutra3, Ronaldo Guilherme Carvalho Scholte1,2, Flávia Toledo Martins-Bedé3,
Fernanda Rodrigues Fonseca3, Ronaldo Santos Amaral4, Sandra Costa Drummond5,
Carlos Alberto Felgueiras3, Guilherme Corrêa Oliveira1,2, Omar Santos Carvalho1/+
1Instituto de Pesquisas René Rachou-Fiocruz, Av. Augusto de Lima 1715, Belo Horizonte, MG, Brasil
2Programa de Pós-Graduação em Clínica Médica e Biomedicina, Santa Casa de Misericórdia, Belo Horizonte, MG, Brasil 3Instituto Nacional de Pesquisas Espaciais, São Paulo, SP, Brasil 4Secretaria de Vigilância em Saúde, Ministério da Saúde, DF, Brasil
5Secretaria de Estado de Saúde de Minas Gerais, Belo Horizonte, MG, Brasil
Geographical information systems (GIS) are tools that have been recently tested for improving our understanding of the spatial distribution of disease. The objective of this paper was to further develop the GIS technology to model and control schistosomiasis using environmental, social, biological and remote-sensing variables. A final regression model (R2 = 0.39) was established, after a variable selection phase, with a set of spatial variables including the pres-ence or abspres-ence of Biomphalaria glabrata, winter enhanced vegetation index, summer minimum temperature and percentage of houses with water coming from a spring or well. A regional model was also developed by splitting the state of Minas Gerais (MG) into four regions and establishing a linear regression model for each of the four regions: 1 (R2 = 0.97), 2 (R2 = 0.60), 3 (R2 = 0.63) and 4 (R2 = 0.76). Based on these models, a schistosomiasis risk map was built for MG. In this paper, geostatistics was also used to make inferences about the presence of Biomphalaria spp. The result was a map of species and risk areas. The obtained risk map permits the association of uncertainties, which can be used to qualify the inferences and it can be thought of as an auxiliary tool for public health strategies.
Key words: schistosomiasis - geographical information system - geostatistical procedures -
Geoprocessing and schistosomiasis • Ricardo JPS Guimarães et al. 525 Because schistosomiasis is a disease determined in
space and time by risk factors, the GIS is a powerful tool that might be used to better understand the disease prev-alence and risk factor distributions. The joint use of GIS and statistical techniques permits the determination of risk factors and geolocalisation of risk areas, leading to the optimisation of resources and to the choice of better strategies for controlling the disease (Beck et al. 1997, 2000, Bavia et al. 2001).
The influence of climate and environmental vari-ables on the distribution of schistosomiasis has been documented by Appleton (1978) and Brown (1994). GIS has also been used to study schistosomiasis in several countries: in Asia (Cross et al. 1996), Brazil (Bavia et al. 2001, Freitaset al. 2006,Guimarãeset al. 2006, 2008, 2009, Martins-Bedé et al. 2009), Chad (Beasley et al. 2002, Brookeret al. 2002), China (Zhouet al. 2001, Seto et al. 2002, Yanget al. 2005), Egypt (Maloneet al. 1994, 1997, Abdel-Rahmanet al. 2001), Ethiopia (Kristensen et al. 2001, Malone et al. 2001), Philippines (Cross et al. 1996), Tanzania (Brooker et al. 2001) and Uganda (Kabatereineet al. 2004).
The main objectives of this paper were to develop ge-oprocessing methods and tools to characterise the spatial distribution of schistosomiasis to construct representative scenarios of potential schistosomiasis areas and to make inferences about the presence of the species of Biompha-laria (B. glabrata, B. tenagophila and/orB. straminea), the intermediate hosts of S. mansoni, in MG, Brazil.
MATERIALS AND METHODS
Schistosomiasis prevalence values were obtained from the Brazilian Schistosomiasis Control Program (SCP) through the Annual Reports of the Secretary of Public Health Surveillance and the Secretary of Health in MG.
The SCP in MG began in 1986 and since 2000 has been under the coordination of the Secretary of Health in MG in collaboration with municipal health systems. The aim of the SCP is to prevent the occurrence of the hepatosplenic form and to prevent its transmission in focus areas (SESMG 2006). The Kato-Katz technique is the method used to determine prevalence, examining one slide per person.
Data on the distribution of Biomphalaria mollusks were provided by the Laboratory of Helminthiasis and Medical Malacology of the René Rachou Research In-stitute. Mollusks were collected in breeding places from different municipalities in MG at different times, using scoops and tweezers and then packed to be transported to the laboratory (Souza & Lima 1990). Specific iden-tification was performed according to the morphology of the shells, reproductive system and renal ridge of the mollusks (Deslandes 1951, Paraense & Deslandes 1955a, b, 1959, Paraense 1975, 1981) and more recently by low stringency polymerase chain reaction and restriction fragment length polymorphism (Vidigal et al. 2000).
Moderate-resolution imaging spectroradiometer (MODIS) images were obtained for MG in two sea-sons, summer (from 17 January-1 February 2002) and winter (from 28 July-12 August 2002). MODIS images with 250 m of spatial resolution, which was used in this
study, encompassed the blue, red, near-infrared and mid-dle infrared bands, the normalised difference vegetation index (NDVI) and the enhanced vegetation index (EVI).
The linear spectral mixture model is an image-processing algorithm that generates sub-pixel images with the appropriate proportion of each component (veg-etation, soil and shade) inside the pixel, which is estimat-ed by minimising the sum of the squares of the errors. In this work the so-called vegetation, soil and shade frac-tion images were generated using the MODIS data and the estimated values for the spectral reflectance compo-nents were also used as an input to the model.
The digital elevation model (DEM) was obtained by the Shuttle Radar Topography Mission (SRTM). SRTM consisted of a specially modified radar system that flew onboard the Space Shuttle Endeavour during an 11-day mission in February 2000. The ground altitude used in this experiment is given by the value of SRTM DEM for each ground pair of coordinates in 90 m of spatial resolution. The local declivity was derived from SRTM DEM by an appropriate filtering approximation of a first-order derivative.
The meteorological variables consisted of total pre-cipitation and the minimum and maximum temperature for summer and winter seasons, which were obtained from the Centro de Previsão de Tempo e Estudos Climáti-cos of the Instituto Nacional de Pesquisas Espaciais, on the same date as MODIS images.
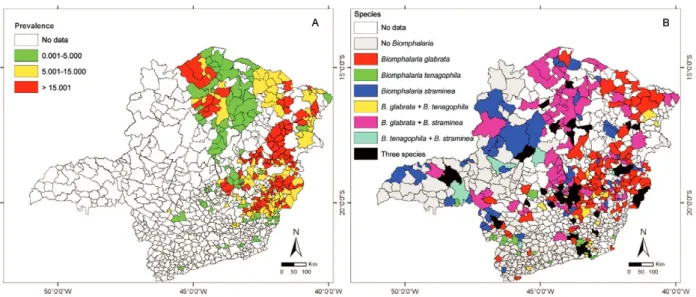
The social variables used were from the Human De-velopment Index (HDI): HDI-income, HDI-longevity and HDI-education for the years 1991 and 2000 (HDIE00). The environmental data (calcareous areas, sanitation and water quality, hydric and health indices) were obtained from the Companhia de Pesquisa de Recursos Minerais, the Brazilian Sistema Nacional de Indicadores Urbanos and the Fundação João Pinheiro. The spatial distribution of schistosomiasis prevalence and the Biomphalaria spp data are presented in Fig. 1A, B, respectively.
Geostatistics methods and multiple linear regression were employed to estimate the presence of the interme-diate host and the schistosomiasis disease, respectively. Geostatistics methods, such as kriging, are techniques to interpolate the value of a random field at an unobserved location from observations of its value at nearby locations (Guimarãeset al. 2009). Regression analysis is a statisti-cal technique that uses the relationship between two or more variables so that one can be predicted by the others (Freitaset al. 2006,Guimarãeset al. 2006, 2008).
Indicator kriging - The research area was situated in MG, with an approximate area of 588,384.30 km² in 853 municipalities. It includes 15 river basins: Bu-It includes 15 river basins: Bu-ranhém, Doce, Grande, Itabapoana, Itanhém, Itapemi-rim, Jequitinhonha, Jucuruçu, Mucuri, Paraíba do Sul, Paranaíba, Pardo, Piracicaba/Jaguari, São Francisco and São Mateus.
at-tributes (class of species and localisation) were distributed along the drainage network of 15 river basins, according to the methodology used by Guimarãeset al. (2009).
The classes used for this paper were defined as B. glabrata, B. tenagophila, B. straminea, B. glabrata + B. tenagophila, B. glabrata + B. straminea, B. tenago-phila + B. straminea, B. glabrata + B. tenagophila + B. straminea and without Biomphalaria.
The class without Biomphalaria included informa-tion about the non-occurrence of Biomphalaria spp or information about non-transmitter species in Brazil, such as B. peregrina, B. schrammi, B. intermedia and B. occidentalis.
Indicator kriging may be defined as a technique of statistical inference, which allows the estimation of val-ues and the uncertainties associated with the attribute during the spatialisation of a sample property (Felguei-ras 1999). It is a nonlinear estimator, which is applied on a sample set of the attribute whose values are modi-fied according to a nonlinear transformation. Accord-ing to Felgueiras (1999), indicator krigAccord-ing is considered non-parametric because it does not use any kind of dis-tribution of a priori probability for a random variable. Instead, it enables the construction of a discretised ap-proximation of the cumulative distribution function of the random variable.
Variogram models were fitted for each class, in each basin, through exploratory analysis, using the geostatis-tical procedures. These procedures involved the cre-ation of experimental semivariograms and fitting them to mathematical theoretical models. The fittings were not automatic but interactive, because the users, after a first fit, check its suitability to the theoretical model (Camargo 1997). After model fitting, indicator kriging procedures were applied to obtain an approximation of the conditional distribution function of the random vari-ables. Based on the estimated function, maps of mollusk spatial distributions along with the corresponding un-certainties for the entire basin were built.
Linear regression models for prevalence risk esti-mation - In this paper, a relationship between schistoso-miasis prevalence and the aforementioned variables was established by using multiple regression models.
Because the prevalence data were provided at the municipality level, all input variables were integrated inside the municipalities’ boundaries using GIS systems (ArcGis, Environment for Visualizing Images) and ex-ported to a standard spreadsheet for statistical analysis and modelling.
The multiple linear regressions were employed based on two approaches: the global model, where a linear re-gression model was established to estimate the disease throughout the state and the regional model, which con-sisted of two steps. In the first step, homogeneous and contiguous regions were determined for the state, using biological variables (related to the mollusk’s habitat) and the Skater algorithm (Assunçãoet al. 2006, Martins 2008). The second step consisted of fitting different lin-ear regression models for each region.
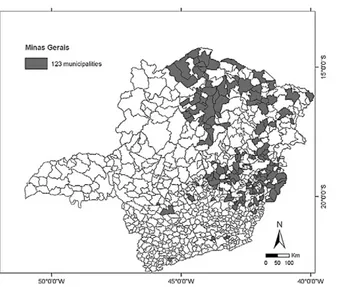
The global and regional models were built using the data from the 123 municipalities, presented in Fig. 2, where prevalence information and presence or absence of B. glabrata are available. The fitted models were then used to build the risk map for the entire MG, by applying the models to the remaining municipalities.
A logarithmic transformation for the dependent vari-able (prevalence, denoted by Pv) was made, as it im-proved the correlation with independent variables.
Because multicollinearity effects among the inde-pendent variables were detected, a variable selection technique was used to choose a set of variables (or trans-formations of them) that better explained the dependent variable. The variable selection was done by the R2
cri-terion, using all possible regression procedures (Neter et al. 1996). This selection technique consists of the identi-fication of a subset with few variables and a coefficient of determination, R2, sufficiently close to that when all
variables are used in the model. Interaction effects were also included in the model.
Geoprocessing and schistosomiasis • Ricardo JPS Guimarães et al. 527
ence or absence of B. glabrata (BG), summer minimum temperature (TNs), winter EVI (EVIw) and water from springs or wells (WP).
The final regression model, with R2 = 0.39, based on
the 123 municipalities, was: ^
Pv= e (-7.18 + 0.49BG + 0.36TNs+ 5.83EVIw+ 0.01WP) - 1
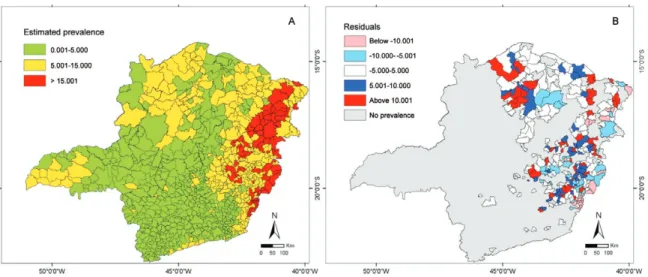
Fig. 4A shows the estimated prevalence for all MG municipalities using the above estimated regression equation. Fig. 4B shows the plot of the residuals, result-ing from the difference between observed (Fig. 1A) and estimated (Fig. 4A) schistosomiasis prevalence. In Fig. 4B, dark colours (red and blue) represent overestimated values, light colours (red and blue) represent underes-timated ones and in white are the municipalities where the estimated prevalence differed very little from the true values.
RESULTS
All aforementioned variables were generated and put in a database using the software TerraView/TerraLib (http://www.dpi.inpe.br/geoschisto/).
Kriging - The indicator kriging procedure, based on the fitted semivariograms, was applied using the sample data presented in Fig. 1B, to generate a regular grid of 250 m of resolution (x, y) over MG. The result was a map of the species distribution and a map of the uncer-tainties associated with the classification. Fig. 3A illus-trates the classes associated with the Biomphalaria spp, with a maximum level of uncertainty of 0.78. The map of uncertainties (Fig. 3B) showed that the higher uncer-tainties were concentrated along class transition areas. Consequently, in regions where several classes may oc-cur, more transitions were found and, therefore, higher uncertainties were obtained.
Multiple linear regressions
Global model - Fifty-one quantitative independent variables were used in the statistical analysis: meteoro-logical, social and biological variables and remote sens-ing data derived from MODIS and SRTM.
Besides quantitative variables, one qualitative vari-able (binary) was also used to represent the presence or absence of B. glabrata:
BG =
1 presence of the B. glabrata 0 otherwise
The analysis of the correlation matrix showed that some variables had non-significant correlations with Pv at a 95% confidence level and some variables were highly correlated among themselves, indicating that the model could be further simplified.
After variable selection using the R2 criterion, the
final chosen model was that with four variables: pres-Fig. 2: schistosomiasis prevalence and the presence (in gray) or not (in white) of the Biomphalaria glabrata from the 123 municipalities.
Fig. 3A: estimated Biomphalaria spp distribution with a maximum
level of uncertainties of ≤ 0.78; B: uncertainties associated with the
Fig. 5A shows the result of the regionalisation. Fig. 5B shows the estimated prevalence for all MG munici-palities using the above estimated regression equation. Fig. 5C shows the plot of the residuals. In this Fig., dark colours (red and blue) represent overestimated values and light colours (red and blue) underestimated ones, and in white are the municipalities where the estimated prevalences differed very little from the true values.
The results indicate that during the summer season the risk of contracting schistosomiasis increases, prob-ably due to high concentrations of the snails in the drain-age, caused mainly by lack of sanitation and high tem-perature, among other factors and by people searching for hydric collections, for either drinking or bathing.
The TN and the EVI were positively correlated with schistosomiasis prevalence. This is consistent with the ad-equate environmental conditions for the development of the intermediate hosts, as the snails settle in places with tem-peratures above 15°C and areas covered by vegetation.
Additionally, our analysis showed that the presence of B. glabrata was directly related to the prevalence of the dis-ease. Furthermore, the positive correlation of the variable WP may be related to the use of WP that is contaminated.
The presence of B. glabrata increased the value of the prevalence compared to the municipal districts where B. glabrata was not found, as can be observed by the fol-lowing calculations:
Estimated increase by averaging the data - From the prevalence data, it is possible to compute the average of the prevalence for the municipalities with B. glabrata (μPG) and without B. glabrata (μPG):
μPG = 13.44 μPG= 9.24 ... μPG / μPG = 1.46
where PG indicates the B. glabrata presence and PG the ab-sence. Therefore, on average, the prevalence of the
munici-palities μPGis 46% larger than the municipalities μPG.
Estimated increase by the regression - From equa-tion (1) for the municipalities where B. glabrata was not found (BG = 0) then
^
PvPG + 1= e (-7.18 + 0.36TN
s + 5.83EVIw+ 0.01WP)
and for the municipalities where B. glabrata was found (BG = 1)
^
PvPG + 1= e (-7.18 + 0.36TN
s + 5.83EVIw+ 0.01WP) e0.49 = (Pv PG + 1)e
0.49
^
Because e0.49 = 1.63, it is possible to say that
(disre-garding the + 1 in the equations), on average, the mu-nicipalities with a prevalence of PG were approximately 63% larger than the municipalities lacking PG, which is not too far from the ratio of the average prevalence found before (1.46).
Regional model - The regionalisation (division of MG into four homogeneous regions) was performed us-ing the followus-ing variables: geology, hydrological index, Biomphalaria spp, EVIW, health necessity index, DEM, accumulated precipitation and average temperature. The result of the regionalisation is shown in Fig. 5A.
The linear regression model for each of the four re-gions was developed with the same 51 variables used in the global model. For each of the four regions, a different number of variables were selected to generate the best regression models.
The final models generated for each of the four re-gions were:
^
Pv1= e (0.92 + 0.28WN- 0.29E) -1 => R2 = 0.97
^
Pv2= e (0.86 + 0.12PCw + 8.3BG*NDVIw - 0.22BG*QTA) - 1 => R2 = 0.60
^
Pv3= e (12.1 - 0.002DEM + 0.68TNs - 0.82TXs + 2.61NHI) - 1 => R2 = 0.63
^
Pv4= e (-3.93 + 0.004DEM + 6.45HDIE00 + 0.07C) - 1 => R2 = 0.76
where WN: percentage of households with another form
of access to water; E: percentage of households with
Fig. 4: global model: A: estimated prevalence using the global regression equation; B: residuals (difference between observed and estimated
Geoprocessing and schistosomiasis • Ricardo JPS Guimarães et al. 529
bathroom or toilet and septic tank; PCW:winter precipita-tion;QTA:water percentage in the municipality; TXS:
sum-mer maximum temperature; NHI: need-of-health index; C:
percentage of housing with bathroom or toiled connected to a ditch.
The equation for Region 1 (R1) reflects the effect of the sanitation and the WN. This region was not an endemic
area; there were only some foci of the disease. In this re -gion, the R2 obtained was 0.97. Model 1 presents a variable
access to water as the general model.
The model described in Region 2 (R2) shows that the PG associated with the effect of vegetation (NDVIW) and QTA were the determining factors for schistosomiasis. The R2 obtained for this model was 0.60.
For Region 3 (R3), the environmental characteristics related to the disease prevalence were DEM, NHI and the effect of the variability of the summer temperature. The R2
for this model was 0.63. The relation between the disease and temperature was expected, as during the summer sea-sons the risk of contracting schistosomiasis increases, due to the aforementioned factors in the global model.
The model described in Region 4 (R4) shows that preva-lence was associated with the DEM, HDIE00 and higher C. The R2 obtained was 0.76. These variables represent aspects
of the topography that may or may not favour the formation of small water collections, where the snails can find propi-tious breeding conditions.
The Table presents the residual sum of squares, sample size, degrees of freedom (sample size minus number of parameters in equation) and the residual mean square for the global model, for each region and for the total regional model. From this Table it can be seen that the residual mean square dropped from 0.55-0.3 (a reduction of more than 45%) when individual models were fitted for each region. This highlights the importance of using regional models.
Overall, the global and regional models had at least one of the following characteristics: (i) the PG, (ii) en-vironmental conditions favourable to disease trans-mission/habitat of the snails and (iii) sanitation. These characteristics are the same as those of epidemiological importance for the occurrence of disease: environmen-tal conditions fostering the presence and development of snails (infection of the intermediate host) and presence or lack of sanitation (water contamination implies the presence of S. mansoni cercariae).
DISCUSSION
The importance of the joint use of GIS and remote sens-ing for disease risk was demonstrated. In addition, we may conclude that the joint use of GIS and statistical techniques permitted the estimation of schistosomiasis prevalence.
The generated results show that kriging is a consistent tool and that the obtained risk map can be used as an aux-iliary tool to formulate proper public health strategies and guide fieldwork, considering the places with a higher prob-ability of occurrence of the most important species. Fig. 5: regional model: A: regionalisation using the Skater algorithm;
Variables from different sources (social, meteoro-logical, remote sensing and biological) were used in this paper. Schistosomiasis prevalence was estimated by two models, a global and a regional, which showed that the PG, sanitation, vegetation index and temperature are important variables, as it appears in both global and re-gional models.
Results of the regression models show that regionali-sation improves disease estimation in MG. Moreover, the global and regional models also confirmed the importance of the use of biological variables to characterise the snail habitat in the endemic area of MG. Most of the selected explanatory variables were related to sanitation and water and health quality or were directly related to the presence of the snail. The use of regionalisation also improved gen-eralisation, especially in the non-endemic areas, where the schistosomiasis prevalence data are scarce.
Martins-Bedé et al. (2009), using socioeconomic vari-ables for regionalisation and applying the same methods cited in this paper, also obtained superior results with the regional model compared to the global model.
It is interesting to note that the variables selected for each region are consistent with the socio-environmental conditions in each of them. R1, the most developed region, is influenced mainly by sanitation. Sanitation is also an important factor for R4, which is the poorest and least developed region. Additionally, these regions have mu-nicipalities with the highest schistosomiasis prevalence in MG. The topographical factors and the temperature effect become important in R3 and R4, where the largest differ-ences in altimetry occur. Factors such as rain, amount of water and vegetation are important in R2, which is the dri-est region of MG.
This paper can contribute significantly to the choice of strategies by public health officials, allowing them, on the one hand, to narrow the set of municipalities in MG for which treatment and sanitation should be priorities and, on the other hand, to focus on preventive measures in the municipalities where transmission can occur.
The next phase of this study will estimate schistoso-miasis prevalence using locality data (localities that have coordinate and prevalence information).
TABLE
Residual analysis for global and regional models
Residual sum of squares Sample size Degrees of freedom Residual mean square
Global model 64.91 123 118 0.550a
Region 1 0.23 8 5 0.047
Region 2 22.28 49 45 0.495
Region 3 8.22 44 39 0.211
Region 4 1.38 22 18 0.077
Total regional 32.12 123 107 0.300a
a: a reduction of more than 45% in the residual mean square, which highlights the importance of using regional models.
ACKNOWLEDGEMENTS
To Dr José Carlos N Epiphanio, Dr Márcio M Valeriano, Dr Eduardo CG Camargo, Dr Fausto L Stefani and Renata PP Amaral.
REFERENCES
Abdel-Rahman MS, El-Bahy MM, Malone JB, Thompson RA, El Bahy NM 2001. Geographic Information Systems as a tool for control program management for schistosomiasis in Egypt. Acta Trop79: 49-57.
Appleton CC 1978. Review of literature on abiotic factors influencing the distribution and life cycles of Bilharziasis intermediate host snails. Malacol Rev11: 1-25.
Assunção RM, Neves MC, Câmara G, Freitas CC 2006. Efficient re-Efficient re-gionalization techniques for socio-economic geographical units using minimum spanning trees. Int J Geogr Inf Sci20: 797-811.
Bavia ME, Malone JB, Hale L, Dantas A, Marroni L, Reis R 2001. Use of thermal and vegetation index data from earth observing satellites to evaluate the risk of schistosomiasis in Bahia, Brazil.
Acta Trop79: 79-85.
Beasley M, Brooker S, Ndinaromtan M, Madjiouroum EM, Baboguel M, Djenguinabe E, Bundy DA 2002. First nationwide survey of the health of schoolchildren in Chad. Trop Med Int Health7: 625-630.
Beck LR, Lobitz BM, Wood BL 2000. Remote sensing and human health: new sensors and new opportunities. Emerg Infect Dis6: 217-227.
Beck LR, Rodriguez MH, Dister SW, Rodriguez AD, Washino RK, Roberts DR, Spanner MA 1997. Assessment of a remote sensing based model for predicting malaria transmission risk in villages of Chiapas, Mexico. Am J Trop Med Hyg56: 99-106.
Brooker S, Beasley M, Ndinaromtan M, Madjiouroum EM, Baboguel M, Djenguinabe E, Hay SI, Bundy DA 2002. Use of remote sensing and a geographical information system in a national helminth con-trol programme in Chad. Bull World Health Organ80: 783-789.
Brooker S, Hay SI, Issae W, Hall A, Kihamia CM, Lwambo NJ, Wint W, Rogers DJ, Bundy DA 2001. Predicting the distribution of uri-nary schistosomiasis in Tanzania using satellite sensor data. Trop Med Int Health6: 998-1007.
Brown DS 1994. Freshwater snails of Africa and their medical impor-tance,2nd ed., Taylor & Francis, London, 609 pp.
Geoprocessing and schistosomiasis • Ricardo JPS Guimarães et al. 531
Camargo ECG 1997. Desenvolvimento, implementação e teste de proce-dimentos geoestatísticos (krigeagem) no Sistema de Processamento de Informações Georeferenciadas (SPRING), MSc Thesis, Instituto Nacional de Pesquisas Espaciais, São José dos Campos, 105 pp.
Carvalho OS, Massara CL, Rocha RS, Katz N 1989. Esquistossomo-se mansoni no sudoeste do estado de Minas Gerais (Brasil). Rev Saude Publica23: 341-344.
Carvalho OS, Massara CL, Silveira Neto HV, Alvarenga AG, Vidigal TH, Chaves A, Katz N, Guerra HL, Santos MA 1994. Schistoso- Schistoso-miasis mansoni in the region of the Triângulo Mineiro, state of Minas Gerais, Brazil. Mem Inst Oswaldo Cruz89: 509-512.
Carvalho OS, Massara CL, Silveira Neto HV, Guerra HL, Caldeira RL, Mendonça CL, Vidigal TH, Chaves A, Katz N 1997. Re-evaluation of schistosomiasis mansoni in Minas Gerais, Brazil - II. Alto Para-Alto Para-naíba Mesoregion. Mem Inst Oswaldo Cruz92: 141-142.
Carvalho OS, Nunes IM, Caldeira RL 1998. First report of
Biomphalaria glabrata in the state of Rio Grande do Sul, Brazil.
Mem Inst Oswaldo Cruz93: 39-40.
Carvalho OS, Rocha RS, Massara CL, Katz N 1987. Expansão da esquistossomose mansoni em Minas Gerais. Mem Inst Oswaldo Cruz82 (Suppl. IV): 295-298.
Carvalho OS, Rocha RS, Massara CL, Katz N 1988. Primeiros casos autóctones de esquistossomose mansoni no município de Para-catu, noroeste do estado de Minas Gerais (Brasil). Rev Saude Publica22: 237-239.
Chitsulo L, Engels D, Montresor A, Savioli L 2000. The global status of schistosomiasis and its control. Acta Trop77: 41-51.
Cross ER, Newcomb WW, Tucker CJ 1996. Use of weather data and remote sensing to predict the geographic and seasonal distribu-tion of Phlebotomus papatasi in southwest Asia. Am J Trop Med Hyg54: 530-536.
Deslandes N 1951. Técnica de dissecção e exame de planorbídeos. Rev Serv Espec Saude Publica4: 371-382.
Felgueiras CA 1999. Modelagem ambiental com tratamento de in-certezas em sistemas de informação geográfica: o paradigma geoestatístico por indicação, PhD Thesis, Instituto Nacional de Pesquisas Espaciais, São José dos Campos, 165 pp.
Freitas CC, Guimarães RJ, Dutra LV, Martins FT, Gouvêa EJ, Santos RA, Moura AC, Drummond SC, Amaral RS, Carvalho OS 2006. Remote sensing and geographic information systems for the study of schis-tosomiasis in the state of Minas Gerais, Brazil, IEEE International Geoscience and Remote Sensing Symposium, Denver, p. 2436-2439.
Guimarães RJ, Freitas CC, Dutra LV, Felgueiras CA, Moura AC, Amaral RS, Drummond SC, Scholte RG, Oliveira G, Carvalho OS 2009. Spatial distribution of Biomphalaria mollusks at São Francisco River Basin, Minas Gerais, Brazil, using geostatistical procedures. Acta Trop109: 181-186.
Guimarães RJ, Freitas CC, Dutra LV, Moura AC, Amaral RS, Drummond SC, Guerra M, Scholte RG, Freitas CR, Carvalho OS 2006. Analysis and estimative of schistosomiasis prevalence for the state of Minas Gerais, Brazil, using multiple regression with social and environmen-tal spatial data. Mem Inst Oswaldo Cruz101 (Suppl. I): 91-96.
Guimarães RJ, Freitas CC, Dutra LV, Moura AC, Amaral RS, Drum-mond SC, Scholte RG, Carvalho OS 2008. Schistosomiasis risk estimation in Minas Gerais state, Brazil, using environmental data and GIS techniques. Acta Trop108: 234-241.
Kabatereine NB, Brooker S, Tukahebwa EM, Kazibwe F, Onapa AW 2004. Epidemiology and geography of Schistosoma mansoni in Uganda: im-plications for planning control. Trop Med Int Health9: 372-380.
Katz N, Carvalho OS 1983. Introdução recente da esquistossomo-se mansoni no sul do estado de Minas Gerais, Brasil. Mem Inst
Oswaldo Cruz78: 281-284.
Kristensen TK, Malone JB, McCarroll JC 2001. Use of satellite re-mote sensing and geographic information systems to model the distribution and abundance of snail intermediate hosts in Africa: a preliminary model for Biomphalaria pfeifferi in Ethiopia. Acta Trop79: 73-78.
Malone JB, Abdel-Rahman MS, El Bahy MM, Huh OK, Shafik M, Ba-via M 1997. Geographic information systems and the distribution of
Schistosoma mansoni in the Nile delta. Parasitol Today13: 112-119.
Malone JB, Huh OK, Fehler DP, Wilson PA, Wilensky DE, Holmes RA, Elmagdoub AL 1994. Temperature data from satellite imag-ery and distribution of schistosomiasis in Egypt. Am J Trop Med Hyg50: 714-722.
Malone JB, Yilma JM, McCarroll JC, Erko B, Mukaratirwa S, Zhou X 2001. Satellite climatology and the environmental risk of Schisto-soma mansoni in Ethiopia and East Africa. Acta Trop79: 59-72.
Martins FT 2008. Mapeamento do risco da esquistossomose no es-tado de Minas Gerais usando dados ambientais e sociais, MSc Thesis, Instituto Nacional de Pesquisas Espaciais, São José dos Campos, 145 pp.
Martins-Bedé FT, Freitas CC, Dutra LV, Sandri SA, Fonseca FR, Drummond IN, Guimarães RJ, Amaral RS, Carvalho OS 2009. Risk mapping of schistosomiasis in Minas Gerais, Brazil, using MODIS and socioeconomic spatial data. IEEE Transactions on Geoscience and Remote Sensing47: 3899-3908.
Neter J, Kutner MH, Nachtssheim CJ, Wasserman W 1996. Applied linear statistical models,4th ed., WCB/McGraw-Hill, Boston, 1408 pp.
Paraense WL 1975. Estado atual da sistemática dos planorbídeos bra-sileiros. Arq Mus Nac 55: 105-111.
Paraense WL 1981. Biomphalaria occidentalis sp. n. from South America (Mollusca Basommatophora Pulmonata). Mem Inst Oswaldo Cruz76: 199-211.
Paraense WL, Deslandes N 1955a. Observations on the morphology of Australorbis glabratus. Mem Inst Oswaldo Cruz53: 87-103.
Paraense WL, Deslandes N 1955b. Observations on the morphology of Australorbis nigricans. Mem Inst Oswaldo Cruz53: 121-134.
Paraense WL, Deslandes N 1959. The renal ridge as a reliable charac-ter for separating Taphius glabratus from Taphius tenagophilus.
Am J Trop Med Hyg8: 456-472.
SESMG - Secretaria de Estado de Saúde de Minas Gerais/Superinten-dência de Epidemiologia 2006. Análise da situação de saúde de Minas Gerais. SESMG, Belo Horizonte, 132 pp.
Seto E, Xu B, Liang S, Gong P, Wu W, Davis GM, Qiu D, Gu X, Spear R 2002. The use of remote sensing for predictive modeling of schisto-somiasis in China. Photogramm Eng Remote Sensing68: 167-174.
Souza CP, Lima LC 1990. Moluscos de interesse parasitológico do Brasil, Série Esquistossomose 1, Centro de Pesquisas René Ra-chou-Fundação Oswaldo Cruz, Belo Horizonte, 79 pp.
Vidigal TH, Caldeira RL, Simpson AJ, Carvalho OS 2000. Further studies on the molecular systematics of Biomphalaria snails from Brazil. Mem Inst Oswaldo Cruz 95: 57-66.
WHO - World Health Organization 1985. The control of schistoso-miasis. World Health Organ Tech Rep Ser 728: 1-113.
Yang GJ, Vounatsou P, Zhou XN, Utzinger J, Tanner M 2005. A re-view of geographic information system and remote sensing with applications to the epidemiology and control of schistosomiasis in China. Acta Trop96: 117-129.