Association of leprosy with HLA-DR2
in a Southern Brazilian population
1Departamento de Análises Clínicas, Universidade Estadual de Maringá,
87020-900 Maringá, PR, Brasil
2Centro de Especialidades do Sistema Único de Saúde,
87013-280 Maringá, PR, Brasil
3Departamento de Genética, Universidade Federal do Paraná,
81531-990 Curitiba, PR, Brasil J.E.L. Visentainer1,
L.T. Tsuneto1,
M.F. Serra2,
P.R.F. Peixoto2 and
M.L. Petzl-Erler3
Abstract
The association between HLA specificities and leprosy was investi-gated in a Southern Brazilian population. One hundred and twenty-one patients and 147 controls were typed for HLA-A, B, Cw, DR and DQ. Patients were subdivided into the following subgroups, accord-ing to clinical, histological and immunological criteria: lepromatous (N = 55), tuberculoid (N = 32), dimorphous (N = 20), and indetermi-nate (N = 14). The frequencies of HLA specificities were compared between the total group of patients and controls, and between the same controls and each subgroup of patients. After correction of the prob-abilities, deviations were not significant, except for the DR2 specific-ity, which presented a frequency of 44.2% in the total group of patients and 56.3% in the subgroup of individuals with the tuberculoid form of the disease, compared to 23.3% in the controls. Stratified analysis showed that the increased DR2 frequency in the total group of patients was due to the subgroups with the tuberculoid and dimorphous forms. The relative risk of tuberculoid leprosy for DR2-positive individuals was 4.2, and the etiologic fraction of DR2 was 0.429. In conclusion, a positive association of the DR2 specificity with the tuberculoid form of leprosy, but not with the lepromatous, dimorphous, or indetermi-nate forms, was demonstrated in this Southern Brazilian population.
Correspondence
J.E.L. Visentainer
Departamento de Análises Clínicas Universidade Estadual de Maringá Av. Colombo, 5790
87020-900 Maringá, PR Brasil
Research supported by Laboratório de Imunogenética and Mestrado em Ciências Biológicas, Universidade Estadual de Maringá, and CNPq.
Received September 13, 1995 Accepted November 6, 1996
Key words
•HLA
•Leprosy
•Mycobacterium leprae
Introduction
Leprosy is a heterogeneous chronic in-fectious disease caused by the bacillus My-cobacterium leprae (M. leprae) (1). The majority of people with leprosy live in tropi-cal regions, but the disease also occurs in regions of temperate climate. It is believed that a long period of contact with M. leprae is necessary for infection to occur. The incuba-tion period normally ranges from 2 to 5 years (2). The route of transmission of M. leprae is not known, but the upper airways, skin, and
breast-feeding are likely routes.
Leprosy is still an important endemic dis-ease in the great majority of countries of Asia, Africa, and Latin America. In 1991, the number of cases in the whole world was approximately 5.5 million, of which 270,000 were in Brazil (3). In adults, leprosy occurs at a proportion of 1.5 to 1.6 males to 1 female. In regard to age, in regions of high incidence, there is a peak in the second de-cade followed by a constant frequency in the period between 30 and 60 years (4).
immu-nological criteria, Ridley and Jopling (5) classified the leprosy spectrum into five groups: tuberculoid (TT), borderline-tuber-culoid (BT), borderline-borderline (BB), borderline-lepromatous (BL) and leproma-tous (LL). According to Seghal et al. (6), it would be convenient to add the indetermi-nate form (I) to this classification. The main signs of leprosy are hypoesthetic cutaneous lesions, dilatation of peripheral nerves and the presence of acid-resistant bacilli in skin lesions (2). The I form is an initial stage in which the clinical and histopathological out-come is uncertain. The lesions observed in the TT form are macular or infiltrated and may reappear or develop from indeterminate macules. In the LL form, the skin lesions are multiple and numerous bacilli can be dem-onstrated in skin lesion biopsies (7). LL may develop from the indeterminate or dimor-phous (D) disease, or may be the first form recognized. Borderline (or dimorphous) lep-rosy is a mixture of several components of the TT and LL forms.
The clinical manifestations of leprosy and their severity seem to depend on the interaction between M. leprae and the im-mune system of the infected host. There is a good correlation between the cell-mediated immunity (CMI) against M. leprae antigens observed in vitro and in vivo and the clinical course of the disease. In the localized and less serious TT form, an efficient CMI to M. leprae developswith low levels of antibod-ies. The LL form, on the other hand, is associated with a flaw in CMI and patients have high antibody levels and a dissemi-nated bacterial increase. High levels of anti-bodies in the LL form may be a consequence of a high bacillar charge (8), but these anti-bodies do not provide any protection against M. leprae (9). The I and D forms of the disease show various degrees of CMI and different levels of antibodies.
The phenotype of susceptibility to infec-tion by M. leprae is complex and is influ-enced by a variety of both host and parasitic
factors, and by the environmental condi-tions. The possible role of genetic factors of the host has been considered for many years. In 1929, Hopkins and Denny (10) postulated genetic variability as a basis for the epide-miologic observations of familial clustering and racial differences in the expression and incidence of the disease. In mice, the resist-ance or susceptibility to infection by many kinds of intracellular pathogens is controlled by the Bcg locus of chromosome 1 (11), while the haplotypes of the H-2 system (the murine MHC) result in variability of the immune response to Mycobacterium leprae-murium (12). Based on the murine model, it has been suggested that a similar mechanism of genetic susceptibility should be operating in man (7,13).
Many investigators have tried to find an association between leprosy and its subtypes with genetic markers, with the purpose of identifying susceptibility genes. More atten-tion has been given to the HLA system, because alleles of its highly polymorphic loci encode class I and II HLA molecules, crucial to cellular interactions in CMI.
Earlier studies have reported increased frequencies of HLA-DR2 and DR3 in TT patients (14-21) and of HLA-DQ1 and DR2 in LL patients (18,22-24), with interpopula-tion heterogeneity. Associainterpopula-tion studies be-tween leprosy and class II HLA genes have not been performed in Brazilian populations. The aim of the present study was to inves-tigate the possible association between HLA and leprosy and/or its subtypes in a Southern Brazilian population. Therefore, the frequen-cies of the HLA phenotypes of 121 patients were compared to those of 147 normal indi-viduals from the same ethnic group.
Material and Methods
Patients and controls
System of the State of Paraná were selected and classified into four distinct subgroups according to Ridley and Jopling (5), includ-ing the I form (6). Fifty-five patients pre-sented the LL form, 32 the TT form, 20 the D form and 14 the I form. Patients with the dimorphous form were classified into one group (D) due to the difficulty to differenti-ate the BT, BB, and BL forms and because of the reduced number of patients. After the exclusion of 3 consanguineous individuals, 118 individuals formed the total group of patients.
Clinical and laboratory diagnoses were established by the observation of the clinical signs of the disease by an experienced der-matologist, and by laboratory tests including bacilloscopy of the earlobes and elbows, skin biopsy and Mitsuda’s reaction. The pa-tients’ response to the skin test with lepro-min (killed M. leprae), known as Mitsuda’s reaction, helps mainly in the classification of leprosy. After inoculation, the individual develops a granulomatous delayed type hypersensibility reaction. The TT patients were highly positive (reaction diameter >5 mm) and the LL and D patients were nega-tive (0-2 mm). Moreover, 12 individuals with the I form were negative while 2 patients were positive.
The control group consisted of 147 normal unrelated individuals, selected ac-cording to ethnic features, age, sex, occupa-tion and geographical origin of the patients. Only individuals with Caucasoid morpho-logical features were included in this study. The occupation of the great majority of the controls and patients was related to farm-ing.
The M/F ratio and average age of the patients were 1.2 and 46.0 ± 15.2 years, respectively, and 1.3 and 44.5 ± 14.0 years for the controls. In the subgroups of patients, these parameters were 2.7 and 49.8 ± 13 for LL, 0.7 and 42.2 ± 17.7 for TT, 0.8 and 49.9 ± 14.7 for subgroup D, and 0.8 and 34.5 ± 8.0 for the patients with the I form.
HLA typing
One hundred and twenty patients and 145 controls were typed for HLA-A, B and Cw, while 116 patients and 146 controls were typed for HLA-DR. Among the latter, 116 patients and 145 controls were also typed for HLA-DQ. Some control individuals were not typed for all the specificities: the size of the samples is shown in Tables 1 to 5.
Typing was performed according to the microlymphocytotoxicity method (25). The proportion of dead cells was evaluated by cytofluorochromasia (26). Three hundred anti-HLA antisera were used to type the following specificities: A1, A2, A3, A9, A23, A24, A10, A25, A26, A11, A28, A29, A30, A31, A33, A34, A36, B5, B51, B52, B7, B8, B12, B44, B45, B13, B14, B64, B65, B15, B62, B63, B16, B38, B39, B17, B18, B21, B49, B50, B22, B27, B35, B37, B40, B60, B61, B41, B42, B70, Cw1, Cw2, Cw3, Cw4, Cw5, Cw6, Cw7, Cw8, DR1, DR2, DR3, DR4, DR5, DR11, DR12, DR6, DR7, DR8, DR9, DR10, DR52, DR53, DQ1, DQ2, DQ3, DQ7 and DQ8/9.
Statistical analysis
Classical methods to study the associa-tion between HLA and disease (27) were used to detect differences in the frequencies of HLA specificities between patients and controls. The chi-square test was used, with Yates’ correction (28) when needed. The P values were multiplied by the number of independent comparisons made (i.e. 66), re-sulting in the corrected P value or PC (29). The relative risks (RR) were calculated ac-cording to Woolf’s method (30).
with other risk factors associated with this marker.
Results
The frequencies of HLA-DR and DQ specificities of the control group and of the total group of patients are listed in Table 1. The frequencies of the same group of con-trols and the LL, TT, D, and I subgroups of patients are compared in Tables 2, 3, 4, and 5, respectively. The frequencies of HLA-A, B and Cw specificities were not included in the tables and they will be mentioned below only for those presenting the greatest devia-tions.
The following class I specificities had increased frequencies in the patients in com-parison with the control group: HLA-A33 (patients = 4.3%, control = 0.0%; P = 0.0395), B5 (patients = 27.4%, control = 17.2%; P = 0.0487), B51 (patients = 26.5%, control = 12.1%; P = 0.0102), B7 (patients = 18.8%, control = 9.0%; P = 0.02), Cw4 (patients = 36.8%, control = 25.5%; P = 0.0496) and Cw7 (patients = 46.2%, control = 31.7%; P =
0.0168). A decrease was observed in the frequencies of HLA-A9 (patients = 17.1%, control = 31.0%; P = 0.0094), A23 (patients = 3.4%, control = 11.0%; P = 0.021), B14 (patients = 5.1%, control = 13.8%; P = 0.0197) and B65 (patients = 3.4%, control = 14.3%; P = 0.00454). However, the cor-rected P values (PC) resulted in probabilities higher than 0.05 for all class I and class II antigens except for HLA-DR2 (PC = 0.0231) (Table 1). The RR was 2.6 for DR2-positive individuals and the EF was 0.272.
Regarding the LL patients, an increase in the frequencies of HLA-B5 (patients = 31.5%, control = 17.2%; P = 0.0286) and B51 (pa-tients = 25.9%, control = 12.1%; P = 0.033) was observed. However, the deviations be-came nonsignificant after correcting the prob-abilities.
In the TT group, the following class I specificities presented increased frequencies: HLA-B5 (patients = 40.6%, control = 17.2%; P = 0.00355), B51 (patients = 34.4%, control = 12.1%; P = 0.00466), B7 (patients = 28.1%, control = 9.0%; P = 0.00742) and Cw7 (pa-tients = 56.3%, control = 31.7%; P = 0.00896), while the frequency for HLA-Cw3 (patients = 6.35%, control = 22.86%; P = 0.0338) was decreased. Again, these devia-tions were nonsignificant after correcting the probabilities, except for DR2 (PC = 0.0132) (Table 3). The calculated RR and the EF for DR2 were 4.2 and 0.429, respec-tively.
The subgroup of patients with the D form of leprosy showed an increase in the fre-quencies of the following class I specifici-ties: HLA-A1 (patients = 35.0%; control = 13.1%; P = 0.0284), A33 (patients = 10.0%, control = 0.0%; P = 0.00612) and Cw7 (pa-tients = 55.0%, control = 31.7%; P = 0.0402), while those with the I form presented an increase in the frequencies of HLA-A28 (pa-tients = 28.6%, control = 7.6%; P = 0.0369) and Cw7 (patients = 64.3%, control = 31.7%; P = 0.0314). After correcting the probabili-ties, none of the deviations were significant.
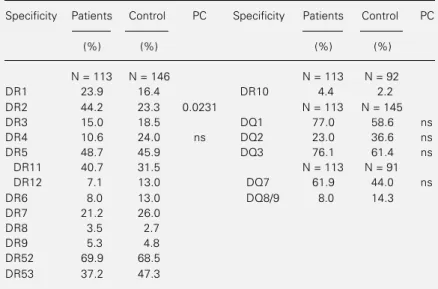
Table 1 - HLA-DR and DQ antigen frequencies in the total sample of patients with leprosy and in the control group.
ns = Nonsignificant (indicated only if P<0.05 before correction); P = probability; PC = corrected probability (Chi-square test).
Specificity Patients Control PC Specificity Patients Control PC
(%) (%) (%) (%)
N = 113 N = 146 N = 113 N = 92
DR1 23.9 16.4 DR10 4.4 2.2
DR2 44.2 23.3 0.0231 N = 113 N = 145
DR3 15.0 18.5 DQ1 77.0 58.6 ns
DR4 10.6 24.0 ns DQ2 23.0 36.6 ns
DR5 48.7 45.9 DQ3 76.1 61.4 ns
DR11 40.7 31.5 N = 113 N = 91
DR12 7.1 13.0 DQ7 61.9 44.0 ns
DR6 8.0 13.0 DQ8/9 8.0 14.3
DR7 21.2 26.0
DR8 3.5 2.7
DR9 5.3 4.8
DR52 69.9 68.5
Discussion
To determine a possible association be-tween HLA specificities and leprosy and/or its clinical forms in a Southern Brazilian population, frequencies of HLA specifici-ties were compared between a group of pa-tients and a group of controls, and between the same controls and each subgroup of pa-tients. Significant associations with the HLA specificity DR2 were shown for leprosy per se and for the tuberculoid form. However, it has been suggested that leprosy per se is not controlled by MHC-linked genes in either humans or mice (7,12). Familial cosegrega-tion and linkage analysis have supported the suggestion that not the susceptibility to lep-rosy, but the host response and the clinical type of leprosy are influenced by HLA-re-lated factors (33). These and other studies indicate that the susceptibility to leprosy per se is controlled by other autosomal, non-MHC-linked genes, while HLA diversity is related to the subtype of leprosy which de-velops in patients after establishment of the infection (7). An explanation for the associa-tion observed in the present study is that it might ensue from the patient sample consti-tution, which comprises individuals with four different forms of leprosy. In the subgroup with the D form, 10 patients (52.6%) were DR2-positive, while in the subgroup with the TT form, 18 patients (56.3%) had this specificity. This contributes to the increase in the frequency of DR2 in the total sample of patients, since 44% of the total group of patients belong to these two groups. Fre-quencies of this specificity were analyzed after excluding individuals with the TT and/ or D forms. After excluding the TT and D forms, the frequencies of DR2 in the samples of patients (35.5%) and controls (23.3%) did not differ significantly (P = 0.0697). This means that primarily the TT and D sub-groups are contributing to the increased fre-quency of DR2 in the total sample of pa-tients.
Table 2 - HLA-DR and DQ antigen frequencies in patients with the LL form of leprosy and in the control group.
ns = Nonsignificant (indicated only if P<0.05 before correction); P = probability; PC = corrected probability (Chi-square test).
Specificity Patients Control PC Specificity Patients Control PC
(%) (%) (%) (%)
N = 51 N = 146 N = 51 N = 92
DR1 21.6 16.4 DR10 2.0 2.2
DR2 33.3 23.3 N = 51 N = 145
DR3 13.7 18.5 DQ1 68.6 58.6
DR4 9.8 24.0 ns DQ2 23.5 36.6
DR5 56.9 45.9 DQ3 80.4 61.4 ns
DR11 45.1 31.5 N = 51 91
DR12 9.8 13.0 DQ7 68.6 44.0 ns
DR6 13.7 13.0 DQ8/9 5.9 14.3
DR7 17.7 26.0
DR8 5.9 2.7
DR9 5.9 4.8
DR52 80.4 68.5
DR53 33.3 47.3
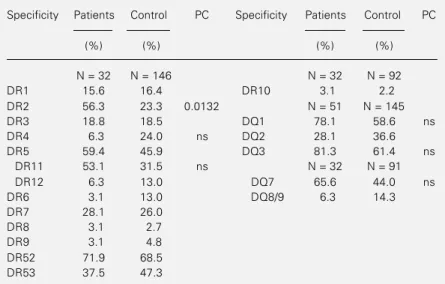
Table 3 - HLA-DR and DQ antigen frequencies in patients with the TT form of leprosy and in the control group.
ns = Nonsignificant (indicated only if P<0.05 before correction); P = probability; PC = corrected probability (Chi-square test).
Specificity Patients Control PC Specificity Patients Control PC
(%) (%) (%) (%)
N = 32 N = 146 N = 32 N = 92
DR1 15.6 16.4 DR10 3.1 2.2
DR2 56.3 23.3 0.0132 N = 51 N = 145
DR3 18.8 18.5 DQ1 78.1 58.6 ns
DR4 6.3 24.0 ns DQ2 28.1 36.6
DR5 59.4 45.9 DQ3 81.3 61.4 ns
DR11 53.1 31.5 ns N = 32 N = 91
DR12 6.3 13.0 DQ7 65.6 44.0 ns
DR6 3.1 13.0 DQ8/9 6.3 14.3
DR7 28.1 26.0
DR8 3.1 2.7
DR9 3.1 4.8
DR52 71.9 68.5
DR53 37.5 47.3
from the North of India was described (24). According to Mutis et al. (34), a specific peptide-HLA class II combination may ex-clusively activate Ts cells in lepromatous leprosy patients. The HLA-DR molecule encoded by allele HLA-DRB1*1503 (a re-cently discovered variant of HLA-DR2) binds and presents a peptide of mycobacterial hsp65 to Ts cells only. Different antigens that stimu-late nonsuppressive T cells were presented by various HLA-DR2 alleles. Nishimura et al. (35) suggested that DQ molecules may control the immune response through the induction of CD8+ T suppressor cells.
In TT patients, differences from controls in the distribution of class I HLA specifici-ties have been shown in many populations (reviewed in Ref. 23). In the great majority of these studies, as in the present one, these associations became nonsignificant when the probabilities were corrected. The strongest and more consistent associations were re-lated to class II HLA specificities, mainly DR. In our population, the association be-tween the HLA-DR2 specificity and the TT form of leprosy was confirmed. An associa-tion between HLA-DR2 and the TT clinical form was observed in a family study in India (15) and was confirmed afterwards in the same population (14). The same association was reported in other populations (18-21). Recently, an increase in the frequency of DRB1*1502 was reported in patients with TT leprosy, suggesting the involvement of this subtype of HLA-DR2 in pathogenesis (36). On the other hand, HLA-DR3 was associated with the TT form of leprosy in Surinam (16) and this was confirmed in Ven-ezuelan families (22). The observation that susceptibility to TT leprosy is associated with DR2 and/or DR3 might be explained by genetic heterogeneity of these molecules in different populations, since particular alle-les of HLA specificity (e.g. of DR2 and DR3) presented in one population might be absent in another one. In such a case, even postulating a direct involvement of HLA
Table 4 - HLA-DR and DQ antigen frequencies in patients with the D form of leprosy and in the control group.
ns = Nonsignificant (indicated only if P<0.05 before correction); P = probability; PC = corrected probability (Chi-square test).
Specificity Patients Control PC Specificity Patients Control PC
(%) (%) (%) (%)
N = 19 N = 146 N = 19 N = 92
DR1 21.1 16.4 DR10 5.3 2.2
DR2 52.6 23.3 ns N = 19 N = 145
DR3 21.1 18.5 DQ1 73.7 58.6
DR4 10.5 24.0 DQ2 21.1 36.6
DR5 36.8 45.9 DQ3 73.7 61.4
DR11 31.6 31.5 N = 19 N = 91
DR12 5.3 13.0 DQ7 57.9 44.0
DR6 5.3 13.0 DQ8/9 10.5 14.3
DR7 21.1 26.0
DR8 0.0 2.7
DR9 5.3 4.8
DR52 63.2 68.5
DR53 36.8 47.3
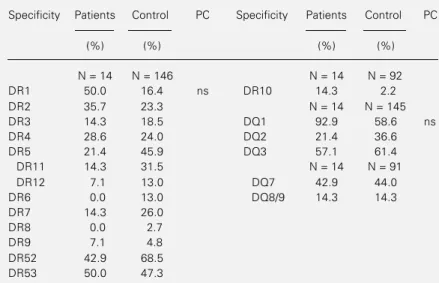
Table 5 - HLA-DR and DQ antigen frequencies in patients with the I form of leprosy and in the control group.
ns = Nonsignificant (indicated only if P<0.05 before correction); P = probability; PC = corrected probability (Chi-square test).
Specificity Patients Control PC Specificity Patients Control PC
(%) (%) (%) (%)
N = 14 N = 146 N = 14 N = 92
DR1 50.0 16.4 ns DR10 14.3 2.2
DR2 35.7 23.3 N = 14 N = 145
DR3 14.3 18.5 DQ1 92.9 58.6 ns
DR4 28.6 24.0 DQ2 21.4 36.6
DR5 21.4 45.9 DQ3 57.1 61.4
DR11 14.3 31.5 N = 14 N = 91
DR12 7.1 13.0 DQ7 42.9 44.0
DR6 0.0 13.0 DQ8/9 14.3 14.3
DR7 14.3 26.0
DR8 0.0 2.7
DR9 7.1 4.8
DR52 42.9 68.5
DR53 50.0 47.3
molecules in pathogenesis, different alleles might be responsible for the susceptibility of different populations. Alternatively, this dis-crepancy could be explained by the action of susceptibility allele(s) of other MHC genes in linkage disequilibrium with a DR2 allele in some populations and with a DR3 allele in other populations.
Anderson et al. (37) identified an M. leprae epitope in a 65-kDa protein of the bacillus, which is restricted to HLA-DR2 and cross-reacts with a DR2 peptide. This particular epitope may be recognized only by T cells from DR2-positive individuals. T cell clones reacting against this peptide were obtained from individuals with the TT form of leprosy. The immune response of these patients is responsible for the immunopatho-logical lesions which result in neural de-struction. Thus, cross-reactivity between M. leprae and DR2 may play a role in the patho-genesis and immunopathology observed in tuberculoid leprosy. If the DR2 association with TT leprosy is due to a particular DR2 subtype has still to be proven. Rani et al. (38) studied allele frequency in patients with lep-rosy from North India using PCR-SSO typ-ing. Both of the DR2 alleles commonly oc-curring in the Indian population, DRB1*1501 and DRB1*1502, were increased in the pa-tients with leprosy, presenting a joint fre-quency of 81.5% in LL and BL patients, 60.7% in the TT group, and 21.3% in con-trols. However, this study is not informative regarding other DR2 alleles, since their fre-quency in the general northern Indian popu-lation is close to zero.
An aspect which may explain the partici-pation of the HLA specificities in the sus-ceptibility to the clinical forms of leprosy is related to the existence of different T cell populations. According to Gillis (39), at the tuberculoid pole, the induction of both Th cell populations (Th1 and Th2) may lead to an efficient immune response and,
conse-quently, to mycobacterium elimination. At the lepromatous pole, Th2 T cells may pref-erably be activated, producing high IL-5 lev-els which would inhibit IL-2 and IFN-γ pro-duction, preventing an adequate immune re-sponse against the pathogen. According to de Vries (40), certain M. leprae peptides presented by particular class II HLA mol-ecules, for example DR2, may preferably be recognized by T cells responsible for DTH. This could explain the association between the TT form of leprosy and DR2.
The D and I forms are rarely investigated. Recently, an increase in the frequencies of the B52, DR9, and DQ7 specificities has been shown in D (more specifically BL) patients from the North of India (24). In the present study, the specificities which presented a tendency to a positive association were dif-ferent. However, the D and I subsamples were too small to allow clear conclusions.
The results obtained in the present study showed a positive association between HLA-DR2 and the tuberculoid form of leprosy, while no significant association between HLA and the LL, D or I forms of leprosy was demonstrable. Analyses at the molecular level may identify the DR2 allele(s) associated with the tuberculoid form in the Brazilian population and may differentiate whether the primary association is with DR2 itself or with alleles of closely linked genes in link-age disequilibrium with HLA-DR2.
Acknowledgments
References
1. Hansen A (1874). Bacillus leprae.Norsk Magazine for Laegevidenskaben,9: 1-21. 2. Meyers WM (1992). Leprosy.
Dermato-logic Clinics, 10: 73-96.
3. Noordeen SK, Lopez Bravo L & Sundaresan TK (1992). Estimated number of leprosy cases in the world. Bulletin of the World Health Organization, 70: 7-10. 4. Noussitou FM (1976). Leprosy in Children.
World Health Organization, Geneva, 11-28.
5. Ridley DS & Jopling WH (1966). Classifi-cation of leprosy according to immunity: A five-group system. International Journal of Leprosy, 34: 255-273.
6. Seghal VN, Jain MK & Srivastava G (1989). Evolution of the classification of leprosy.
International Journal of Dermatology, 28: 161-167.
7. Schurr E, Morgan K, Gros P & Skamene E (1991). Genetics of leprosy. American Journal of Tropical Medicine and Hygiene, 44: 4-11.
8. Saad MHF, Medeiros MA, Gallo MEN & Fonseca LS (1991). Use of the anti-PGL-I antibody ELISA and the Mitsuda reaction in early diagnosis of leprosy. Brazilian Journal of Medical and Biological Re-search, 24: 801-805.
9. Rani R, Zaheer SA, Suresh NR, Walia R, Parida SK, Mukherjee A, Mukherjee R & Talwar GP (1992). Association of HLA an-tigens with differential responsiveness to
Mycobacterium w vaccine in multibacillary leprosy patients. Journal of Clinical Immu-nology,12: 50-55.
10. Hopkins R & Denny OE (1929). Leprosy in the United States. Journal of the Ameri-can Medical Association, 92: 191-198. 11. Skamene E, Gros P, Forget A, Patel PJ &
Nesbitt MN (1984). Regulation of resist-ance to leprosy by chromosome 1 locus in the mouse. Immunogenetics,19: 117-124.
12. Curtis J, Akuffo-Adu H & Turk JL (1984). H-2 linked genes which modify resistance of C57BL/10 mice to subcutaneous infec-tion with Mycobacterium lepraemurium. Infection and Immunity,46: 635-638. 13. Abel L, Demenais F, Baule MS, Blanc M,
Muller A, Raffoux C, Millan J, Bois E, Babron MC & Feingold N (1989). Genetic susceptibility to leprosy on a Caribbean island: Linkage analysis with fine mark-ers. International Journal of Leprosy,57: 465-471.
14. van Eden W, de Vries RRP, Mehra NK, Vaidya MC, DAmaro J & van Rood JJ (1980). HLA segregation of tuberculoid leprosy: Confirmation of the DR2 marker.
Journal of Infectious Diseases, 141: 693-701.
15. de Vries RRP, Mehra NK, Vaidya MC, Gupte MD, Khan PM & van Rood JJ (1980). HLA-linked control of susceptibil-ity to tuberculoid leprosy and association with HLA-DR types. Tissue Antigens, 16: 294-304.
16. van Eden W, de Vries RRP, DAmaro J, Schreuder I, Leiker DL & van Rood JJ (1982). HLA-DR associated genetic con-trol of the type of leprosy in a population from Surinam. Human Immunology, 4: 343-350.
17. van Eden W, Gonzalez NM, de Vries RRP, Convit J & van Rood JJ (1985). HLA-linked control of predisposition to lepromatous leprosy. Journal of Infectious Diseases, 151: 9-14.
18. Izumi S, Sugiyama K, Matsumoto Y & Ohkawa S (1982). Analysis of the immu-nogenetic background of Japanese lep-rosy patients by the HLA systems. Vox Sanguinis, 42: 243-247.
19. Rea TH & Terasaki PI (1980). HLA-DR anti-gens in tuberculoid and lepromatous lep-rosy. Leprosy Review,51: 117-123. 20. Miyanaga K, Jugi TR, Maeda H, Nakajima
S & Kobayashi S (1981). Tuberculoid lep-rosy and HLA in Japanese. Tissue Anti-gens,18: 331-334.
21. Schauf V, Ryan S, Scollard D, Jonasson O, Brown A, Nelson K, Smith T & Vithayasai V (1985). Leprosy associated with HLA-DR2 and DQw1 in the population of North-ern Thailand. Tissue Antigens,26: 243-247.
22. Ottenhoff THM, Gonzalez NM, de Vries RRP, Convit J & van Rood JJ (1984). As-sociation of HLA specificity LB-E12 (MB1, DC1, MT1) with lepromatous leprosy in a Venezuelan population. Tissue Antigens, 24: 25-29.
23. Serjeantson SW (1983). HLA and suscep-tibility to leprosy. Immunological Reviews, 70: 89-112.
24. Rani R, Zaheer SA & Mukherjee R (1992). Do human leukocyte antigens have a role to play in differential manifestation of mul-tibacillary leprosy? A study on multibacil-lary leprosy patients from North India. Tis-sue Antigens, 40: 124-127.
25. Terasaki PI & McClelland JD (1964). Microdroplet assay of human serum cyto-toxins. Nature, 204: 998-1000.
26. Bodmer WF & Bodmer J (1977). Cytofluo-rochromasia. In: Ray JG, Hare DB & Kayhoe DE(Editors), NIAD Manual of Tis-sue Typing Techniques. National Insti-tutes of Health, Bethesda, 31-34. 27. Svejgaard A, Jersild C, Nielsen S &
Bodmer WF (1974). HLA-antigens and dis-ease: statistical and genetical consider-ations. Tissue Antigens, 4: 95-105. 28. Levin J (1978). Estatística Aplicada a
Ciências Humanas. 2nd edn. Harper & Row do Brasil Ltda., São Paulo.
29. Grumet FC, Coukell A, Bodmer JG, Bodmer WF & McDevitt HO (1971). His-tocompatibility (HLA) antigens associated with systemic lupus erythematosus. New England Journal of Medicine, 285: 193-196.
30. Woolf B (1955). On estimating the rela-tion between blood group and disease.
Annals of Human Genetics, 19: 251-253. 31. Miettinen OS (1974). Proportion of
dis-ease caused or prevented by a given ex-posure, trait or intervention. American Journal of Epidemiology, 99: 325-332. 32. Green A (1982). The epidemiologic
ap-proach to studies of association between HLA and disease. II. Estimation of abso-lute risks, etiologic and preventive frac-tion. Tissue Antigens,19: 259-268. 33. de Vries RRP, Serjeantson SW & Layrisse
Z (1984). Leprosy. In: Albert ED, Baur MP & Mayr WR (Editors), Histocompatibility Testing 1984. Springer Verlag, Berlin, 362-367.
34. Mutis T, Cornelisse YE, Datema G, van Del Elsen P, Ottenhoff THM & de Vries RRP (1994). Definition of a human sup-pressor T-cell epitope. Proceedings of the National Academy of Sciences, USA, 91: 9456-9460.
35. Nishimura Y, Kamikawaji N, Fujisawa K, Yoshizumi H, Yasunami M, Kimura A & Sasazuki T (1991). Genetic control of im-mune response and disease susceptibil-ity by the HLA-DQ gene. Research of Im-munology,142: 459-466.
37. Anderson DC, van Schooten WCA, Barry ME, Janson AAM, Buchanan TM & de Vries RRP (1988). A Mycobacterium leprae-specific human T cell epitope cross-reactive with an HLA-DR2 peptide.
Science, 242: 259-261.
38. Rani R, Fernandez-Viña MA, Zaheer KR & Stastny P (1993). Study of HLA class II alleles by PCR oligotyping in leprosy pa-tients from North India. Tissue Antigens, 42: 133-137.
39. Gillis W (1989). T-Helper cell subpopula-tions and the immune spectrum of lep-rosy. International Journal of Leprosy,57: 73-81.