Comparison of RAPD, RFLP, AFLP and SSR markers for diversity studies in
tropical maize inbred lines
Antonio A.F. Garcia
1, Luciana L. Benchimol
2,3, Antônia M.M. Barbosa
1, Isaias O. Geraldi
1,
Cláudio L.Souza Jr.
1and Anete P. de Souza
2,31
Escola Superior de Agricultura “Luiz de Queiroz”, Departamento de Genética, Piracicaba, SP, Brazil.
2Universidade Estadual de Campinas, Centro de Biologia Molecular e Engenharia Genética, Campinas,
SP, Brazil.
3
Universidade Estadual de Campinas, Instituto de Biologia, Departamento de Genética e Evolução,
Campinas, SP, Brazil.
Abstract
In order to compare their relative efficiencies as markers and to find the most suitable marker for maize diversity studies we evaluated 18 tropical maize inbred lines using a number of differentloci as markers. The loci used were: 774 amplified fragment length polymorphisms (AFLPs); 262 random amplified polymorphic DNAs (RAPDs); 185 restriction fragment length polymorphisms (RFLPs); and 68 simple sequence repeats (SSRs). For estimating genetic distance the AFLP and RFLP markers gave the most correlated results, with a correlation coefficient of r = 0.87. Bootstrap analysis were used to evaluate the number ofloci for the markers and the coefficients of variation (CV) revealed a skewed distribution. The dominant markers (AFLP and RAPD) had small CV values indicating a skewed distribution while the codominant markers gave high CV values.The use of maximum values of genetic distance CVs within each sample size was efficient in determining the number ofloci needed to obtain a maximum CV of 10%. The number of RFLP and AFLPloci used was enough to give CV values of below 5%, while the SSRs and RAPD loci gave higher CV values. Except for RAPD, for all the markers genetic distance correlated with single cross performance and heterosis which showed that they could be useful in predicting single cross performance and heterosis in intrapopulation crosses for broad-based populations. Our results indicate that AFLP seemed to be the best-suited molecular assay for fingerprinting and assessing genetic relationships among tropical maize inbred lines with high accuracy.
Key words:diversity studies, genetic distances, maize, molecular markers.
Received: January 20, 2003; Accepted: February 16, 2004.
Introduction
The past limitations associated with pedigree data and morphological, physiological and cytological markers for assessing genetic diversity in cultivated and wild plant spe-cies have largely been circumvented by the development of DNA markers such as restriction fragment length polymorphisms (RFLPs; Botsteinet al., 1980), random am-plified polymorphic DNAs (RAPDs; Williams et al., 1990), amplified fragment length polymorphisms (AFLPs; Zabeau and Vos, 1993) and simple sequence repeats (SSRs, microsatellites; Tautz, 1989). However, these molecular markers have technical differences in terms of cost, speed,
amount of DNA needed, technical labor, degrees of poly-morphism, precision of genetic distance estimates and the statistical power of tests.
Although the discrimination power of RFLPs in di-versity studies has been well documented (Smith et al., 1990; Dudley et al., 1991; Messmer et al., 1993; Benchimolet al., 2000) the limitations related to the routine use of RFLPs stimulated studies with other types of molec-ular markers such as RAPDs which are simpler to use and do not require the use of radioactive materials (Williamset al., 1990). The RAPD technology is well suited to DNA fingerprinting (dos Santos et al., 1994; Thormannet al., 1994) although it does suffer from a certain lack of reproducibility due to mismatch annealing (Neale and Harry, 1994; Demekeet al., 1997; Karpet al., 1997).
Microsatellites (SSRs) occur frequently in most eukaryote genomes and can be very informative,
multi-www.sbg.org.br
Send correspondence to Antonio A.F. Garcia, Escola Superior de Agricultura “Luiz de Queiroz”, Departamento de Genética, Caixa Postal 83, 13400-970 Piracicaba, SP, Brazil. E-mail: aafgarci@ esalq.usp.br.
allelic and reproducible (Voset al., 1995; Senior and Heun, 1993) and were suggested in order to overcome the limita-tions associated with RFLP and RAPD. The application of SSR techniques to plants depends on the availability of suitable microsatellite markers, which have been devel-oped for species such as soybean (Rongwenet al., 1995), rice (Zhao and Kochert, 1993), maize (Taramino and Tingey, 1996) and the common bean (Yu et al., 2000). Morgante and Olivieri (1993) stated that in soybean the amount of information given by SSRloci in relation to a comparable number of RFLPlociis given by the estimated number of alleles (4.25 perlocusfor SSR as opposed to 2.15 perlocusfor RFLP). Wu and Tanskley (1993) stating that the heterozygosity of SSRs is seven to ten times higher than that of RFLPs.
The AFLP technique is more laborious and time con-suming than RAPD methods but is also more reliable, AFLP being able to detect a large number of polymorphic bands in a single lane rather than high levels of polymor-phism at eachlocussuch as is the case for SSR methods. Although this lower sensibility in detecting informative genotypic classes might be associated with the inability to distinguish heterozygotes from homozygotes because of bi-nary scored AFLPs, Gerberet al. (2000) suggest that the high numbers of polymorphiclocirevealed by AFLP meth-ods counterbalance the loss of information resulting from dominance, while Garcia-Mas et al. (2000) showed that AFLPs had higher efficiency in detecting polymorphism than either RAPD or RFLP markers. It is also known that the AFLP technique has lower initial costs and is more transferable across species than SSR methods. Techniques based on AFLPs have been applied to genome mapping (Zimnoch-Guzowska et al., 2000), DNA fingerprinting (Powellet al., 1996), genetic diversity studies (Russellet al., 1997) and parentage analysis (Gerberet al., 2000; Lima
et al., 2001).
Comparisons of different DNA markers for diversity studies in maize (Hahnet al., 1995; Smith et al., 1997; Ajmone Marsan et al., 1998; Pejic et al., 1998), barley (Russell et al., 1997), wheat (Bohn et al., 1999), cruciferous species (dos Santoset al., 1994; Thormannet al., 1994), potato (Mc Gregoret al., 2000), sorghum (Yang
et al., 1996) and rice (Davierwalaet al., 2000) have tried to evaluate the relative efficiencies of the different techniques available. However, in the case of maize, tropical and tem-perate populations differ from each other because tropical populations usually originate from composites with higher genetic variability and, most of the time, it is difficult to al-locate tropical composites to well-defined heterotic groups by phenotypic evaluation. Due to this uniqueness, molecu-lar markers have been very useful in genetic evaluations and assignment of tropical maize inbred lines to heterotic groups.
The objectives of the study described in this paper were: i) compare the level of information provided by
RFLP, RAPD, SSR and AFLP markers for estimating ge-netic similarities in tropical maize inbred lines; ii) evaluate the minimum number oflociof each marker needed to ac-curately represent genetic distance between inbred lines; iii) compare the genetic distances (GD) obtained with the different marker system; iv) compare the usefulness of these four markers in predicting single-cross hybrid perfor-mance by means of genetic distance estimates.
Materials and Methods
Plant material and DNA isolation
Eighteen S3selected inbred lines from two divergent
tropical maize populations (eight from BR-105 and ten from BR-106) previously had their genetic distances sur-veyed using four different marker systems (Lanzaet al., 1997; Benchimolet al., 2000; Barbosaet al., 2003). The BR-105 population is an early-maturing synthetic with or-ange flint kernels while the BR-106 population is an early-maturing composite with yellow dent kernels, both popula-tions having shown high levels of heterosis when crossed and were assigned to distinct heterotic groups by Naspolini Fºet al., (1981) and Souza Jr.et al., (1993). Detailed de-scriptions of these populations are given in Lanzaet al.
(1997) and Rezende and Souza Jr. (2000).
Total genomic DNA was isolated from a bulk of five-week-old leaf tissue taken from 16 plants of each line, then being isolated and purified by the method of Hoisingtonet al.(1994).
Molecular analysis
The way the RAPD data was obtained and a descrip-tion of the data is given in Lanzaet al.(1997). Thirty-two primers showing reproducible polymorphism were selected and used for scoring the 18 inbred lines. When performing RAPD analysis, each band was considered as onelocus. How the RFLP data were obtained and the data itself is given in Benchimolet al.(2000). Briefly, a total of 185 clone-enzyme combinations were analyzed, the maize ge-nome being saturated (20 cM intervals) with at least one RFLP probe selected by its map location on each chromo-some. Each probe-enzyme combination (EPC) was consid-ered a locus and each unique RFLP banding pattern a distinct variant. Barbosa et al.(2003) describes how the AFLP and SSR profiles were obtained and also give the data produced. For the AFLP method 20 primer combina-tions were used and binary scored (1 or 0) with each band being considered alocuswhile for the SSR method 68 poly-morphic primers were used with the binary data being con-verted into a genotypic matrix which was used to identify alleles and their respectiveloci.
Data analysis
in-bred lines using the complement of the Jaccard’s similarity coefficient (Jaccard, 1908) which takes into account the presence or absence of bands. In this method, co-occurrences are divided by the total number of evaluated
loci(excluding the negative co-occurrences) and thus can be interpreted as the proportion of coincidences in relation to the total number of evaluatedloci. Jaccard similarities were calculated using version 2.0j of the NTSYS-PC com-puter package (Exeter software, NY; Rolf, 1997). The ge-netic distances for the codominant markers (RFLP and SSR) were calculated using the modified Roger’s distance (MRD; Goodman and Stuber, 1983) based on the allele fre-quency of eachlocuswhich considers the amount of ge-netic diversity and expresses the quantity of diversity present in eachlocusor allele, calculations being made us-ing version 1.3 of the TFPGA sotware (Miller, 1997).
Pearson’s correlation coefficient was calculated for the genetic distances, single cross performance and heterosis as previously described by Benchimol et al. (2000). The information content of each marker system was calculated for each marker andlocususing the polymor-phism information content (PIC) (Lynch and Walsh, 1998) which provides an estimate of the discriminating power of a
locusby taking into account not only the number of alleles that are expressed but also their relative frequencies. Calcu-lations were made using the following formula:
PIC fi 2 i 1
n = −
=
∑
1 , where fiis the frequency of the ithallele.
Bootstrap analysis was used to verify if the number of polymorphiclocievaluated was high enough to provide ac-curate genetic distance estimates (King et al., 1993; Halldénet al., 1994). To determine the sampling variance of the genetic distances produced by the different molecu-lar data sets we performed bootstrap analysis using a de-creasing number ofloci(for codominant markers) or bands (for dominant markers). For each specific number oflocior bands used the polymorphic markers were submitted to 500 random samplings with replacement (bootstrap samples) and genetic distances were obtained for each bootstrap
sample (Tivanget al., 1994). Each band visualized on the gel was considered to be the re-sampling unit for dominant markers because for these markers each band is related to onelocus. Codominant markers relate each band to an al-lele, and therefore the boostrap was applied amonglocus.
The coefficient of variation (CV) for all 500 genetic distances across the bootstrap samples was estimated for each specific number oflocior bands sampled, a computer program for performing these analyses being set up using the ‘RANNUNI’ function of the SAS system (Version 8.0; SAS Institute, 1999). For each marker system (AFLP, RAPD, RFLP and SSR) the exponential function was ad-justed to estimate the number ofloci needed to obtain a 10% CV. We used the median and maximum coefficient of variation values to evaluate the accuracy of the genetic dis-tance estimates because although the mean coefficient of variation is often used in the literature caution is needed when dealing with molecular marker data for which there is no assurance that the CVs values are distributed symmetri-cally.
Results
Levels of polymorphism
All of the 18 maize inbred lines studied by us had pre-viously been investigated using the four different marker systems (RAPD: Lanzaet al., 1997; RFLP: Benchimolet al., 2000; AFLP and SSR: Barbosaet al., 2003), the esti-mated means and ranges of the genetic distances and the level of polymorphism produced by each of the marker sys-tems for the possible combinations of crosses between lines BR-105 and BR-106 being summarized in Tables 1 and 2. In the work of Lanzaet al. (1997), Benchimolet al. (2000) and Barbosaet al. (2003) the total number of assays ranged from 20 primer combinations for the AFLP method to 185 probe/enzyme combinations for the RFLP method, with the total number of polymorphic bands ranging from 200 for SSR to 973 for RFLP (Table 2). Since the RAPD and AFLP markers were dominant they could only express the theo-retical maximum of two alleles perlocus,whereas because
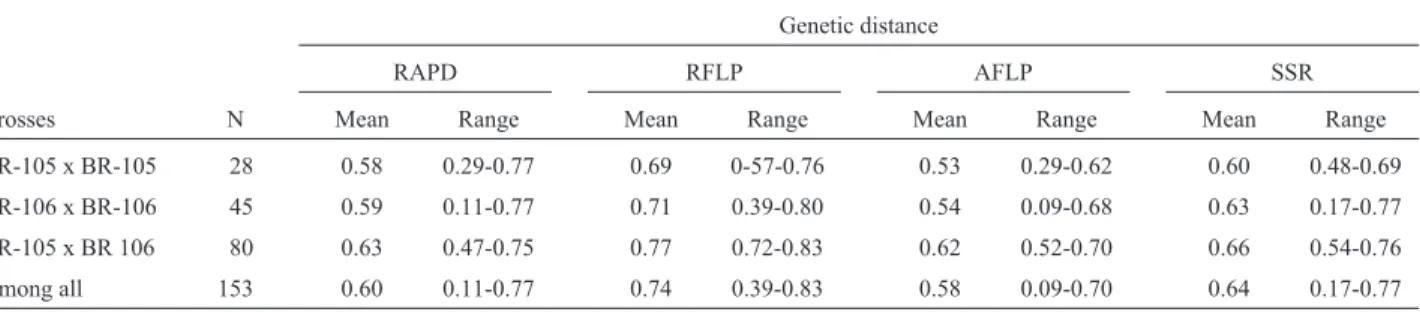
Table 1- Mean and range of the genetic distance values for different maize crosses calculated using data from random amplified polymorphic DNA (RAPD), restriction fragment length polymorphism (RFLP), amplified fragment length polymorphism (AFLP) and simple sequence repeat (SSR) markers. The Jaccard similarity coefficient was used for dominant markers and Roger’s modified distance for codominant markers.
Genetic distance
RAPD RFLP AFLP SSR
Crosses N Mean Range Mean Range Mean Range Mean Range
BR-105 x BR-105 28 0.58 0.29-0.77 0.69 0-57-0.76 0.53 0.29-0.62 0.60 0.48-0.69
BR-106 x BR-106 45 0.59 0.11-0.77 0.71 0.39-0.80 0.54 0.09-0.68 0.63 0.17-0.77
BR-105 x BR 106 80 0.63 0.47-0.75 0.77 0.72-0.83 0.62 0.52-0.70 0.66 0.54-0.76
Among all 153 0.60 0.11-0.77 0.74 0.39-0.83 0.58 0.09-0.70 0.64 0.17-0.77
the RFLP and SSR markers were codominant these mark-ers could express different values of alleles perlocus.
Polymorphism information content
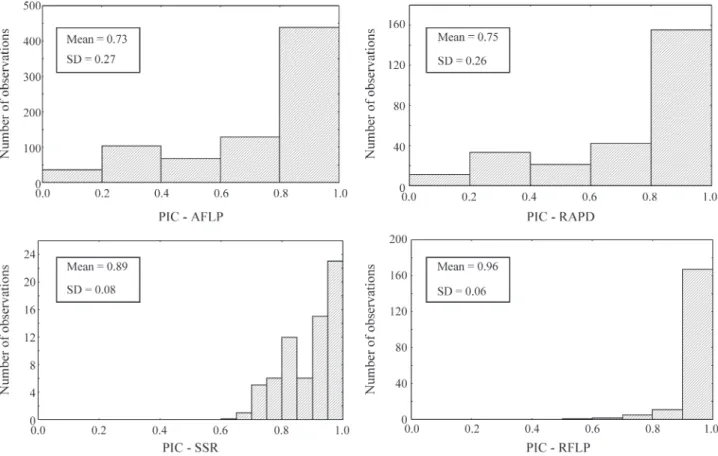
The RFLP and SSR polymorphism information con-tent (PIC) means were higher than the RAPD and AFLP means (Figure 1). Differences in the distribution profiles also occurred between dominant and codominant markers, with dominant markers having higher standard deviations than codominant markers. The differences between mini-mum and maximini-mum PIC values were lower for RFLP and SSR than for AFLP and RAPD. The RFLP markers gave
the highest mean PIC value for allloci(PIC = 0.96) and the SSR markers the second highest (PIC = 0.89), with the dominant RAPD (PIC = 0.75) and AFLP (PIC = 0.73) markers having mean PIC values of almost the same mag-nitude.
Correlations between genetic distances measured with different markers
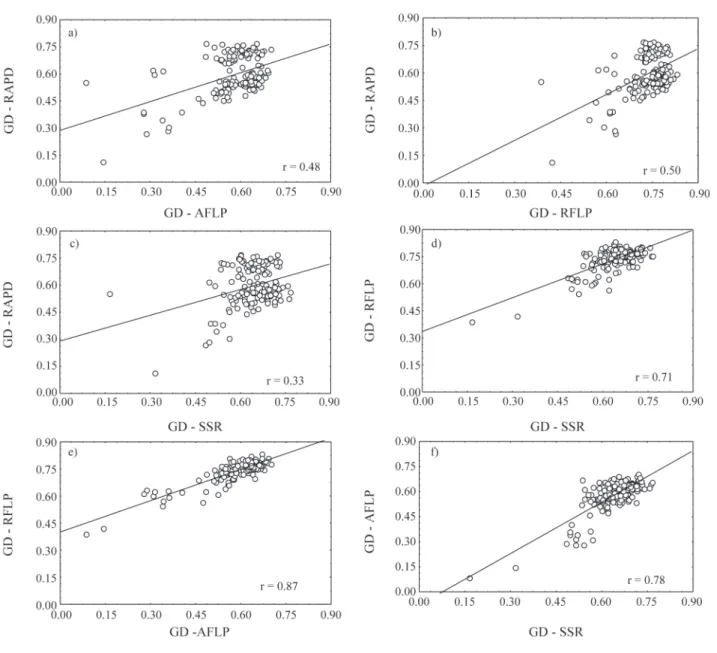
The highest Pearson correlation value (Figure 2) was that between the AFLP and RFLP genetic distances (r = 0.87) and it seems that these two markers are the most similar type of markers in terms of the magnitude of the
ge-Table 2- Levels of polymorphism in 18 maize inbred lines evaluated using random amplified polymorphic DNA (RAPD), restriction fragment length polymorphism (RFLP), amplified fragment length polymorphism (AFLP) and simple sequence repeat (SSR) markers.
Marker system
Parameters RAPD (primers) RFLP (probe/enzymes) AFLP (primer combinations) SSR (primer pairs)
Number of assays 32 185 20 68
Number of polymorphic bands 262 973 774 200
Number of loci 262a 185 774a 68
Average number of alleles per locus 2.0 5.26 2.0 2.94
Data from: RAPD, Lanzaet al.(1997); RFLP, Benchimolet al.(2000); AFLP and SSR, Barbosaet al.(2003). Key: Each band corresponds to a locus for RAPD and AFLP and to an allele for RFLP and SSR.
a
Theoretical maximum number of loci.
netic distances produced. The SSR and AFLP markers pro-duced the second highest correlation value (r = 0.78), followed by SSR and RFLP (r = 0.71), RFLP and RAPD (r = 0.50) RAPD and AFLP (r = 0.48), with the SSR and RAPD markers having the lowest value (r = 0.33). The RAPD markers were clearly the most distinct type of marker because the correlation values involving this marker were equal to or lower than 0.5 while the other markers showed tight association patterns between each other.
Bootstrap analysis
As expected, the magnitude of the coefficient of vari-ation (CV) values decreased as the number of polymorphic
loci(bands) evaluated increased. Within each sample (i.e.
the number oflociexamined for each marker system) the
tance value had a CV of more than 10% (nmaximum); and the
sample size required for all genetic distances to have an av-erage CV of 10% (nmean) (Figure 3). The results obtained
based on the adjusted functions (except for the mean CV) shown in Figure 3 are presented in Table 3.
Correlation of genetic distance with F1grain yield
and heterosis
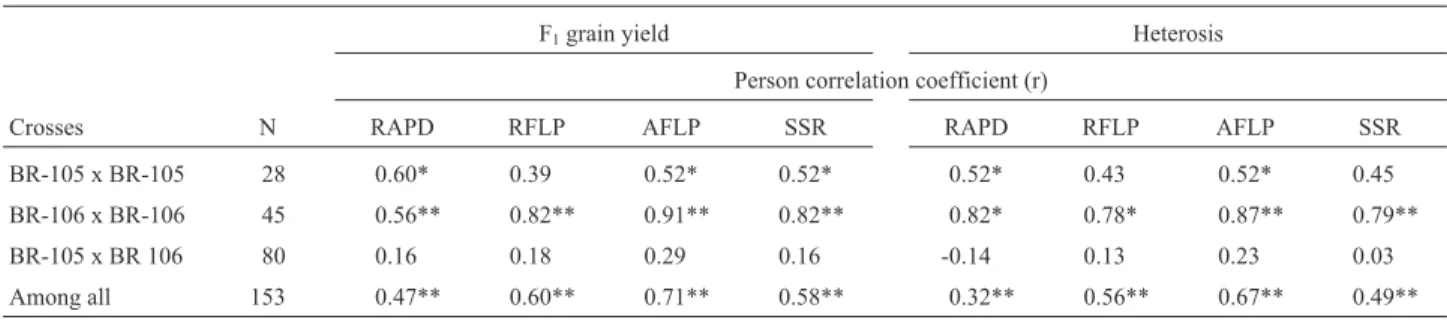
The correlations between genetic distances and grain yield (Table 4) showed a similar pattern for the RFLP, SSR and AFLP markers, correlation being high (0.82 to 0.91, significant at p = 0.01) for intrapopulation BR-106 crosses, moderate (0.39 (not significant) to 0.52, significant at
p = 0.05) for intrapopulation BR-105 crosses and low (0.16 to 0.29, not significant) for the interpopulation BR-105 x BR-106 crosses. For the RAPD markers correlation was moderate for intrapopulation BR-106 crosses (0.56, signifi-cant at p = 0.01) and intrapopulation BR-105 crosses (0.60, significant at p = 0.05) but low (0.16, not statistically sig-nificant) for the interpopulation BR-105 x BR-106 crosses (Table 4). Similar patterns were observed for genetic dis-tance and heterosis.
Discussion
Similar levels of genetic distance estimates were ob-tained using the RAPD, AFLP and SSR markers. The high-est genetic distance values occurred with crosses between inbred lines from different heterotic groups (BR-105 x BR-106), these results agreeing with the high level of heterosis exhibited when these populations are intercrossed (Naspolini Fºet al., 1981; Souza Jr.et al., 1993). Although similar average genetic distance values were obtained for the BR-105 and BR-106 intrapopulation crosses, the BR-106 crosses showed the widest range of genetic dis-tances with all of the four different markers assayed; proba-bly because of the broader genetic base of the BR-106 population. Brazilian breeding programs have exploited the genetic diversity of the BR-106 population and demon-strated that high performance cultivars can be obtained
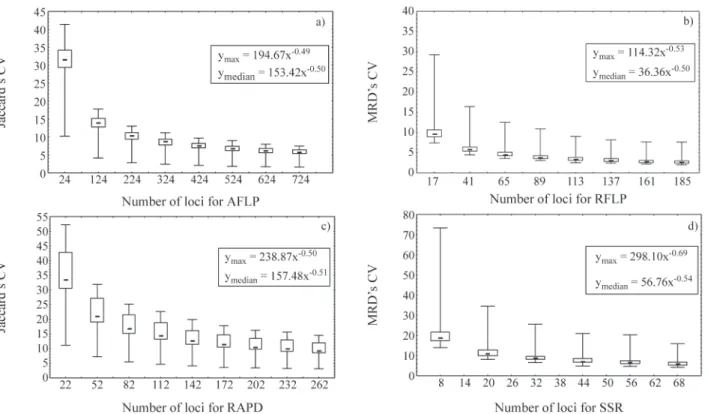
Figure 3- Boxplots showing sampling variation of the genetic distances (GD) values between different maize inbred lines using bootstrap analysis across different marker systems. Key: a, c = dominant markers; b, d = codominant markers; x = number of loci; ymax= exponential function adjusted relative to
the highest coefficient of variation (CV) value; ymedian= exponential function adjusted relative to the median CV value; RAPD = random amplified
poly-morphic DNA; RFLP = restriction fragment length polymorphism; AFLP = amplified fragment length polymorphism; SSR = simple sequence repeat markers.
Table 3- Sample size (number of loci or bands) required so that genetic distance values will have the specified coefficient of variation values.
Sample size
(number of loci or bands sampled)
Coefficient of variation RAPD RFLP AFLP SSR
Average of 10% (nmean) 262 15 232 29
50% less than 10% (nmedian) 229 13 244 26
100% less than 10% (nmaximum) 551 100 407 137
from this population (Gerageet al., 1988, 1989). The corre-lation coefficient values between genetic distance and hy-brid performance for the four markers assayed were similar to the correlation values between genetic distance and heterosis, not only for the inter or intrapopulation crosses but also for all crosses combined.
The RFLP assay reflects restriction size variation spread across the genome, because the use of RFLP mark-ers resulted in the greatest average number of alleles per lo-cusas compared to the other marker systems tested. We found that estimates of polymorphism information content (PIC) based on RFLP measures had the lowest standard de-viations and were the most informative. As expected, the PIC distributions revealed that, in terms of genetic distance, dominant markers had lower levels of polymorphism as compared to codominant markers. However, we also found that SSRs markers gave a more heterogeneous distribution for individual PIC values than RFLP markers, although this might have been due to the low number of polymorphicloci
evaluated for this marker (Barbosaet al., 2003). Although the AFLP markers gave the lowest mean PIC value they provided a similar degree of polymorphism information content to that provided by the RAPD markers, which agrees with the results published by Beckeret al.(1995), Russellet al.(1997) and Pejicet al.(1998).
Comparison of the genetic distances generated by dif-ferent molecular markers in diversity studies have been re-ported by several authors (Hahnet al., 1995; Russellet al., 1997; Yanget al., 1996) and have revealed only moderate agreement between genetic distance estimates made using RFLP and RAPD markers. Pejicet al.(1998) compared dif-ferent molecular markers to assess the genetic similarities between maize inbred lines and found great differences in the RAPD similarity clustering pattern. The results ob-tained in our study showed high agreement between RFLP and AFLP genetic distance estimates, such estimates hav-ing also been highly correlated in other studies (Russellet al., 1997; Melchingeret al., 1998). Indeed, we found that the RFLP and AFLP markers produced sufficient numbers of polymorphic bands to produce reliable genetic distance
estimates with high correlations between these two marker systems, the similarity between the results being explain-able by the fact that they are similar techniques based on re-striction site changes.
Although the SSR and RAPD markers did not result in sufficient numbers of polymorphic bands to produce a mean CV of 10% (Figure 3) it is possible that additional bands would lead to lower CV values and increase the reli-ability of genetic distance estimates. Even though the CV values were not low enough to indicate a high level of pre-cision the SSR markers produced high, and the RAPD markers moderate, correlations between the genetic dis-tance estimates and hybrid performance and heterosis for the BR-106 intrapopulational crosses. Our results points to the need to adopt different strategies for selecting markers and choosing an upper number of SSR and RAPD markers.
An average CV value of 10% is often cited as being necessary to achieve precise genetic distance estimates (dos Santoset al., 1994; Halldénet al., 1994; Thormannet al., 1994; Tivanget al., 1994). Because the box-plots for each of our groups of samples were skewed we used the mean, median and maximum CV values to determine the adequate number of polymorphiclocineeded for acceptable preci-sion. The box-plots (Figure 3) show what happens when the genetic distance CV values, which are different for domi-nant and codomidomi-nant markers, are high. The choice of the appropriate number of polymorphiclocirequired for a reli-able estimation of genetic distance is influenced by the cri-teria used, and it appears that the maximum and median CV values are the best choice for evaluating the precision of the genetic distance estimates based on molecular marker data sets. From the analysis of our data it appears that the maxi-mum CV value appears to be, in most cases, the best guar-antee for producing reliable estimates of genetic distance. For dominant markers, where the distribution is skewed to-wards lower genetic distance CV values, the use of mean or median CV values may lead to errors because some of the genetic distance values will not fall within the required level of precision. For codominant markers, however, the distribution of values within each sample is skewed
to-Table 4- Pearson correlation coefficient (r) between genetic distance (GD) and F1grain yield and heterosis for different maize crosses within and
between heterotic groups as calculated using data from random amplified polymorphic DNA (RAPD), restriction fragment length polymorphism (RFLP), amplified fragment length polymorphism (AFLP) and simple sequence repeat (SSR) markers.
F1grain yield Heterosis
Person correlation coefficient (r)
Crosses N RAPD RFLP AFLP SSR RAPD RFLP AFLP SSR
BR-105 x BR-105 28 0.60* 0.39 0.52* 0.52* 0.52* 0.43 0.52* 0.45
BR-106 x BR-106 45 0.56** 0.82** 0.91** 0.82** 0.82* 0.78* 0.87** 0.79**
BR-105 x BR 106 80 0.16 0.18 0.29 0.16 -0.14 0.13 0.23 0.03
Among all 153 0.47** 0.60** 0.71** 0.58** 0.32** 0.56** 0.67** 0.49**
wards the higher values and it appears that mean or median CV values should be appropriate. We also found extremely high (almost 100%) coefficients of determination for the adjusted equations for both codominant and dominant markers, indicating that extrapolation to outlying points could be done.
Thormannet al.(1994) reported that the number of bands required for a mean CV of 10% was 327 for RAPD and 294 for genomic RFLPs to estimate genetic relation-ships within and between cruciferous species. Pejicet al.
(1998) performed a bootstrap procedure to evaluate the variation in the genetic similarities between temperate maize inbred lines across different marker systems and sug-gested that 150 bands were sufficient for reliable estimates of genetic similarities. Our data indicates that when mea-suring genetic distances 229 RAPD bands would be re-quired to achieve a median CV value of 10% while 526 RFLP bands would be needed for a maximum CV of 10%. Our AFLP and RFLP genetic distance data appeared to have less dispersion, with only 185 RFLPlocibeing needed to produce a median CV of less than 5%.
Our results indicate that, apart from the RAPD mark-ers, the other DNA marker systems provided consistent in-formation for diversity studies on tropical maize populations and produced genetic distance estimates which were in good agreement. The RFLP system appears to be the most robust marker assay in terms of the amount of polymorphism surveyed, although, in practice, it is still a very laborious technique. The SSR markers were promis-ing in terms of the polymorphism and information content revealed, but may involve some additional initial costs as-sociated with primer development. The results also suggest that the number oflocievaluated should be increased.
Our results suggest that AFLP markers are the best choice for the evaluation of diversity and assessing the ge-netic relationships between tropical maize inbred lines with high accuracy. The AFLP system presents good levels of precision in its genetic estimates and single crosses predic-tion. AFLP also correlates highly with results obtained us-ing the RFLP system and is a fast and reliable system capable of supporting a multiplex approach not requiring previous knowledge of DNA sequencing.
Acknowledgments
This work was supported by the Brazilian agency FAPESP (contract 94/1684-8) which also provided a post-graduate fellowship to L.L.B. The Brazilian agency CNPq provided fellowships to C.L.S. Jr. and A.P.S. and a post-graduate fellowship to A.M.M.B.
References
Ajmone Marsan P, Castiglioni P, Fusari F, Kuiper M and Motto M (1998) Genetic diversity and its relationship to hybrid per-formance in maize as revealed by RFLP and AFLP markers. Theor Appl Genet 96:219-227.
Barbosa AMM, Geraldi IO, Benchimol LL, Garcia AAF, Souza Jr CL and Souza AP (2003) Relationship of intra- and inter-population maize single crosses hybrid performance and ge-netic distances computed from AFLP and SSR markers. Euphytica 130:87-99.
Becker J, Vos P, Kuiper M, Salamini F and Heun M (1995) Com-bined mapping of AFLP and RFLP markers in barley. Mol Gen Genet 249:65-73.
Benchimol LL, Souza Jr CL, Garcia AAF, Kono PMS, Mangolim CA, Barbosa AMM, Coelho ASG and Souza AP (2000) Ge-netic diversity in tropical maize inbred lines: Heterotic group assignment and hybrid performance determined by RFLP marker. Plant Breeding 119(6):491-496.
Bohn M, Utz HF and Melchinger AE (1999) Genetic similarities among winter wheat cultivars determined on the basis of RFLPs, AFLPs, and SSRs and their use for predicting prog-eny variance. Crop Sci 39:228-237.
Botstein D, White RL, Skolnick M and Davis RW (1980) Con-struction of a genetic linkage map in man using restriction fragment length polymorphisms. Am J Hum Genet 32:314-331.
Davierwala AP, Chowdari KV, Shiv Kumar, Reddy APK, Ranjekar PK and Gupta VS (2000) Use of three different marker systems to estimate genetic diversity of Indian elite rice varieties. Genetica 108:269-284.
Demeke T, Sasikumar B, Hucl P and Chibbar RN (1997) Random Amplified Polymorphic DNA (RAPD) in cereal improve-ment. Maydica 42:133-142.
dos Santos JB, Nienhuis J, Skroch P, Tivang J and Slocum MK (1994) Comparison of RFLP genetic markers in determining genetic similarity among Brassica oleraceaL. genotypes. Theor Appl Genet 87:909-915.
Dudley JW, Saghai Maroof MA and Rufener GK (1991) Molecu-lar markers and grouping of parents in a maize breeding pro-gram. Crop Sci 31:718-723.
Gerage, AC, Bianco R, Nazareno NRX and de Araújo PM (1988) Avaliação Estadual de Cultivares de Milho Safra 1987/88. IAPAR, PR. Informe de Pesquisa 88.
Gerage AC, Gomes J, Bianco R and Carneiro GES (1989) Avaliação Estadual de Cultivares de Milho safra 19888/89. IAPAR, Paraná, Informe de Pesquisa 89.
Gerber S, Mariette S, Streiff R, Bodénès C and Kremer A (2000) Comparison of microsatellites and amplified fragment length polymorphism markers for parentage analysis. Mol Ecol 9:1037-1048.
Garcia-Mas J, Oliver M, Gómez-Paniagua H and De Vicente MC (2000) Comparing AFLP, RAPD and RFLP markers for measuring genetic diversity in melon. Theor Appl Genet 101:860-864.
Goodman MM and Stuber CW (1983) Races of maize. VI isozyme variation among races of maize in Bolivia. Maydica 28, 273-280.
Hahn V, Blankenhorn K, Schawall M and Melchinger AE (1995) Relationships among early European maize inbreds: III. Ge-netic diversity revealed with RAPD markers and compari-son with RFLP and pedigree data. Maydica 40:299-310. Halldén C, Nilsson NO, Rading IM and Säll T (1994) Evaluation
Hoisington D, Khairallah M and Gonzalez-de-Leon D (1994) Laboratory Protocols: CIMMYT Applied Molecular Genet-ics Laboratory. 2nd edition. CIMMYT, DF, Mexico. Jaccard P (1908) Nouvelles recherches sur la distribuition florale.
Bull Soc Vaud Nat 44:223-270.
Karp A, Edwards K, Bruford M, Vosman B, Morgante M, Seberg O, Kremer A, Boursot P, Arctander P, Tautz D and Hewitt G (1997) Newer molecular technologies for biodiversity eval-uation: Opportunities and challenges. Nature Biotechnol 15:625-628.
King G, Nienhuis J and Hussey C (1993) Genetic similarity among ecotypes ofArabidopsis thalianaestimated by analy-sis of restriction fragment length polymorphisms. Theor Appl Genet 86:1028-1032.
Lanza LLB, Souza Jr CL, Ottoboni LMM, Vieira MLC and Souza AP (1997) Genetic distance of inbred lines and prediction of maize single-cross performance using RAPD markers. Theor Appl Genet 94:1023-1030.
Lima MLA, Garcia AAF, Oliveira KM, Matsuoka S, Arizono H, Souza Jr CL and Souza AP (2002) Analysis of genetic simi-larity detected by AFLP and coefficient of parentage among genotypes of sugar cane (Saccharum spp.). Theor Appl Genet 104:30-38.
Lynch M and Walsh JB (1998) Genetics and Analysis of Quantita-tive Traits. Sinauer Assocs., Inc., Sunderland, MA. Mc Gregor CE, Lambert CA, Greyling MM, Louw JH and
Warnich L (2000) A comparative assessment of DNA fin-gerprinting techniques (RAPD, ISSR, AFLP and SSR) in tetraploid potato (Solanum tuberosum L.) germplasm. Euphytica 113:135-144.
Messmer MM, Melchinger AE, Boppenmaier J and Herrmann RG (1993) Relationships among early European maize (Zea mays L.) inbred Lines: II. Comparison of pedigree and RFLP data. Crop Sci 33:944-950.
Miller M (1997) TFPGA - Tools for population genetic analyses, version 1.3, Northern Arizona University.
Morgante M and Olivieri AM (1983) PCR-amplified microsatellites as markers in plant genetics. The Plant J 3:175-182.
Naspolini FoV, Gama EEG, Vianna RT and Moro JR (1981) Gen-eral and specific combining ability for yield in a diallel cross among 18 maize populations. Rev Bras Genet 4:571-577. Neale DB and Harry DE (1994) Genetic mapping in forest trees:
RFLPs, RAPDs and beyond. Ag Biotech News Inf 6:107N-114N.
Pejic I, Ajmone-Marsan P, Morgante M, Kozumplick V, Catiglioni P, Taramino G and Motto M (1998) Comparative analysis of genetic similarity among maize inbred lines de-tected by RFLPs, RAPDs, SSRs, and AFLPs. Theor Appl Genet 97:1248-1255.
Powell W, Morgante M, Andre C, Hanafey M, Vogel J, Tingey S and Rafalski A (1996) The comparison of RFLP, RAPD, AFLP and SSR (microsatellite) markers for gemplasm anal-ysis. Molecular Breeding 2:225-238.
Rezende GSP and Souza Jr CL (2000) A reciprocal recurrent se-lection procedure outlined to integrate hybrid breeding pro-grams in maize. J Genet Breed 54:57-66.
Rohlf FJ (1997) NTSYS-pc numerical taxonomy and multivariate analysis system, version 2.0. Exeter Publications, N.Y. Rongwen J, Cregan PB, Akkaya MS, Bhagwat AA and Lavi U
(1995) The use of simple sequence repeat DNA markers for
soybean genotype identification. Theor Appl Genet 90:43-48.
Russell RJ, Fuller JD, Macaulay M, Hats BG, Jahoor A, Powell W and Waugh R (1997) Direct comparison of levels of genetic variation among barley accessions detected by RFLPs, AFLPs, SSRs and RAPDs. Theor Appl Genet 95:714-722. SAS Institute (1999) SAS language guide for personal computers.
Release 8.0 edition. SAS Inst., Cary NC, USA.
Senior ML and Heun M (1993) Mapping maize microssatellites and polymerase-chain-reaction confirmation of the targeted repeats using a ct primer. Genome 36:884-889.
Smith OS, Smith JSC, Bowen SL, Tenborg RA and Wall SJ (1990) Similarities among a group of elite maize inbreds as measured by pedigree, F1heterosis, and RFLPs. Theor
Ap-plied Genet 80:833-840.
Smith JSC, Chin ECL, Shu H, Smith OS, Wall SJ, Senior ML, Mitchell SE, Kresovich S and Ziegle J (1997). An evaluation of the utility of SSRlocias molecular markers in maize (Zea maysL.): Comparisons with data from RFLPs and pedigree. Theor Appl. Genet 95:163-173.
Sokal RR and Rohlf FJ (1995) Biometry: The Principles and Prac-tice of Statistics in Biological Research. 3rd edition. Free-man and Company, New York, pp 44-47.
Souza Jr CL, Santos MX, Magnavaca R and Gama EEG (1993) Estimativas de parâmetros genéticos na interpopulação de milho BR-105 x BR-106 e suas implicações no melho-ramento. Pesq Agropec Bras 28:473-479.
Taramino G and Tingey S (1996) Simple sequence repeats for gemplasm analysis and mapping in maize. Genome 39:277-287.
Tautz D (1989) Hypervariability of simple sequences as a general source of polymorphic DNA markers. Nucleic Acids Res 17:6463-6471.
Thormann CE, Ferreira ME, Camargo LEA, Tivang JG and Osborn TC (1994) Comparison of RFLP and RAPD markers to estimating genetic relationships within and among cruciferous species. Theor Appl Genet 88:973-980. Tivang JG, Nienhuis J and Smith OS (1994) Estimation of
sam-pling variance of molecular marker data using the bootstrap procedure. Theor Appl Genet 89:259-264.
Vos P, Rogers R, Bleeker M, Reijans M, Van de Lee T, Hornes M, Fritjers A, Pot J, Peleman J, Kuipe M and Zabeau, M (1995) AFLP: A new technique for DNA fingerprinting. Nucleic Acids Res 23:4407-4414.
Williams JKF, Kubelik AR, Livak KG, Rafalki JA and Tingey SV (1990) DNA polymorphisms amplified by arbitrary primers are useful as genetic markers. Nucl Acids Res 18:6531-6535.
Wu KS and Tanksley SD (1993) Abundance, polymorphism and genetic mapping of microsatellites in rice. Mol Gen Genet 241:225-235.
Yang W, de Oliveira AC, Godwin I, Schertz K and Bennetzen JL (1996) Comparison of DNA marker technologies in charac-terizing plant genome diversity: Variability in Chinese sorghums. Crop Sci 36:1669-1676.
Zhao XP and Kochert G (1993) Phylogenetic distribution and ge-netic mapping of a (GGC)(n) microsatellite from rice (Oryza sativaL.) Plant Mol Biol 21:607-614.
Zimnoch-Guzowska E, Marczewski W, Lebecka R, Flis B, Schäfer-Pregl R, Salamini F and Gebhardt C (2000) QTL
analysis of new sources of resistence toErwinia carotovora
ssp atroseptica in potato done by AFLP, RFLP, and resistence-gene-like markers. Crop Sci 40:1156-1167.