Vol.51, n. 1 : pp.183-192, January-February 2008
ISSN 1516-8913 Printed in Brazil BRAZILIAN ARCHIVES OF
BIOLOGY AND TECHNOLOGY
A N I N T E R N A T I O N A L J O U R N A L
Comparative Analysis of Genetic Diversity Among the
Maize Inbred Lines (Zea mays L.) Obtained by RAPD and
SSR Markers
Silvia Graciele Hülse de Souza1, Valéria Carpentieri-Pípolo1*, Claudete de Fátima Ruas2, Valdemar de Paula Carvalho3, Paulo Maurício Ruas2 and Antônio Carlos Gerage4
1
Departamento de Agronomia; 2Departamento de Biologia; Universidade Estadual de Londrina, C. P. 6001; 86051-990; Londrina - PR - Brasil. 3Departamento de Biologia; Universidade Estadual de Goiás, 75000-000; Anápolis - GO - Brasil. 4Instituto Agronômico do Paraná - IAPAR; C. P. 481; 86001-970; Londrina - PR - Brasil.
ABSTRACT
The RAPD and SSR markers were used to compare the genetic diversity among the 16 maize inbred lines. Twenty-two primers were used in the RAPD reactions, resulting in the amplification of 265 fragments, while 16 pairs of SSR primers resulted in 75 fragments. The similarity based on Dice coefficient for the RAPD ranged from 53 to 84% and for the SSR from 11 to 82%. The dendrogram obtained by the RAPD showed five groups, while dendrogram obtained by the SSR showed three groups and one isolated line. The association constructed from the markers and the principal coordinate’s analysis separated lines into two groups according to endosperm color, either orange or yellow. The RAPD were effective to validate pedigree data, while the SSR were effective to recognize the differences between the quantitative characters. Because they assess the distinct regions of the genome, the selection of one or other marker would depend on the characteristics of the material used and the objectives of the project.
Key words: Corn, distance genetic, microsatellites, molecular markers, polymorphism, RAPD
*
Author for correspondence
INTRODUCTION
The foundation of hybrid development in a maize breeding program basically consists in obtaining lines and evaluating the combination ability between them. Choosing suitable lines is essential for the success of a maize breeding program. In addition, breeding programs demand considerable time and resources, and the pressure for quick development of commercial hybrids encourages the search for alternatives that could be efficient in the short term.
Genetic diversity evaluation is frequently used by the breeders as an alternative germplasm selection
method (Dias et al., 2003 and Diniz et al., 2005), and allows lines to be arranged into groups that, when intercrossed, provide the most promising results, reduce expenses and the time required to perform the hybrid combinations, which would then be unnecessary (Cruz and Vencovsky, 1989 and Verbitskaya et al., 1999).
evaluation by the means of the molecular markers presents some advantages over other methods because, in addition to identifying the high polymorphism, they do not present interactions with the environment, and can be evaluated at any stage of development (Williams et al., 1990). PCR-based techniques such as RAPD (Random Amplified Polymorphic DNA) and microsatellites have been widely used in the corn genetic studies (Heun and Helentjaris, 1993; Gupta et al., 1994; Taramino and Tingey, 1996; Senior et al., 1998 and Pinto et al., 2003).
The RAPD consists in the random amplification of the DNA fragments with a single primer with an arbitrary sequence, resulting in the final synthesis of several DNA fragments, with different sizes. From this set of fragments, it is possible to determine the polymorphism in the DNA sequence, which can be used as a genetic marker (Williams et al., 1990). In the maize, this technique has been widely used in diversity studies because, in addition to its low cost, it allows polymorphism to be detected in a simple and fast manner (Han et al., 1995; Liu et al., 1998; Lübberstedt et al., 2000 and Wu, 2000).
The microsatellite markers have also proved very useful in the breeding programs. Microsatellites or SSR (Simple Sequence Repeats) correspond to the sequences from 2 to 6 base pairs repeated in tandem, and are broadly used because they have a codominant character and are multiallelic, having a high polymorphism information content. These markers provide useful information to the breeders in the breeding programs, generating information for the genotype clustering and for the planning of crosses (Chin et al., 1996; Smith et al., 1997; Senior et al., 1998; Lu and Bernardo, 2001, and Enoki et al., 2002).
Thus, the objective of this work was to estimate the genetic diversity among the 16 maize lines and compare the genetic relatedness values obtained from RAPD and microsatellite analyses.
MATERIAL AND METHODS
In this work, 16 maize lines from the breeding program developed at the Instituto Agronômico do Paraná-IAPAR were used, which belong to five heterotic groups (Hallauer et al., 1988), as can be seen in Table 1:
a) Group A: L69 - line obtained by self-fertilization from the IPTT36 population
introduced by Cimmyt - Center for the Improvement of Maize and Wheat (Mexico); b) Group B: L72 - line obtained by
self-fertilization from a IAPAR’s experimental triple hybrid;
c) Group C: L89, L90, L91, L92, L93, and L94 - all lines were obtained by self-fertilization from a IAPAR’s experimental single hybrid; d) Group D: L95, L96, L97, L98, L99, L100, and
L101 - all lines were obtained by self-fertilization from a IAPAR’s experimental single hybrid;
e) Group E: L102 - line obtained by
self-fertilization within the Amarillo Cristalino variety from Cimmyt
The seeds were placed to germinate in the moistened paper towel. After 7 days, the young leaf was collected, the leaf tissue was macerated in liquid nitrogen, and the genomic DNA was extracted through the extraction protocol described by Ferreira and Grattapaglia (1998). After the extraction, quantification was performed in a Dyna-Quant (Hoefer-Pharmacia) fluorometer and samples were diluted to a final concentration of 10 ng/µl.
The RAPD reactions were carried out in a final volume of 15µl, containing 1× PCR buffer (75
mM Tris-HCl pH 9.0, 50 mM KCl, 20 mM MgCl2
and 20 mM (NH4)2SO4), 0.1 mM of each dNTP,
0.5 mM of primer, 0.7 unit of Taq DNA polymerase (Biotools), and 20 ng DNA, and double-distilled water to complete the volume. Each line was represented by a bulk consisting of an equitable mixture of DNA from 3 individuals. The amplifications were performed in a model PT-100 (MJ Research) thermocycler, programmed to an initial stage of 3 minutes at 94ºC, 47 1 minute cycles at 94ºC (denaturation), 1.45 minutes at 38ºC (annealing), 2 minutes at 72ºC (polymerization), and a final extension stage for 6 minutes at 72ºC. Twenty-two pre-selected decanucleotide primers
acquired from “Operon Technologies” -
The microsatellite reactions were carried out in a final volume of 15µl, containing 1× PCR buffer (75 mM Tris-HCl pH 9.0, 50 mM KCl, 20 mM MgCl2, and 20 mM (NH4)2SO4), 20 mM
(NH4)2SO4), 0.2 mM of each dNTP (dCTP, dGTP,
dTTP, dATP), 0.5 mM of each primer (direct and reverse), 0.7 unit of Taq DNA polymerase (Biotools), 20 ng DNA, and double-distilled water to complete the volume. The amplifications were performed in a model PT-100 (MJ Research) thermocycler, programmed for 40 cycles, with one
cycle consisting of 95ºC (denaturation) for 1 minute, 65ºC (annealing) for 1, minute, and 72ºC (polymerization) for 1.30 minute. A 1°C decrease in annealing temperature occurred at every new cycle. When the annealing temperature reached 55°C, there were another 30 cycles at a temperature of 94°C for 1 minute, 55°C for 1 minute, and 72°C for 1.30 minutes, followed by a final extension cycle of 7 minutes at a temperature of 72°C.
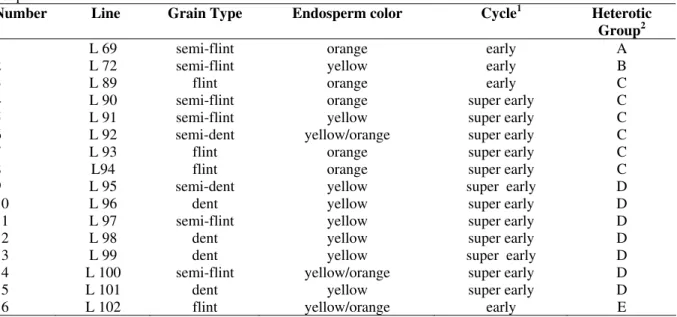
Table 1 - Characterization of lines employed with regard to grain type, endosperm color, cycle, and heterotic groups.
Number Line Grain Type Endosperm color Cycle1 Heterotic Group2
1 L 69 semi-flint orange early A
2 L 72 semi-flint yellow early B
3 L 89 flint orange early C
4 L 90 semi-flint orange super early C
5 L 91 semi-flint yellow super early C
6 L 92 semi-dent yellow/orange super early C
7 L 93 flint orange super early C
8 L94 flint orange super early C
9 L 95 semi-dent yellow super early D
10 L 96 dent yellow super early D
11 L 97 semi-flint yellow super early D
12 L 98 dent yellow super early D
13 L 99 dent yellow super early D
14 L 100 semi-flint yellow/orange super early D
15 L 101 dent yellow super early D
16 L 102 flint yellow/orange early E
1
: temperature requirements for cultivars: 780-830 growing degree days (GDD) – super early; 831-890 GDD - early. 2
: heterotic groups established with reference to source of the material and clustered according to IAPAR.
The sequences for the 16 pairs of primers (direct and reverse) were obtained from the Maize
Genome Database published by Missouri
University (http://www.agron.missouri.edu). The
amplification products were separated by
electrophoresis in 3% agarose gel (50% Gibco-BRL agarose: 50% FMC MetaPhor agarose) stained with ethidium bromide (0.5 µg/ml). The amplified fragments were separated in TAE buffer at 100 volts for 4 h, and visualized under UV light. Gel images were captured using a photographic documentation system for later analysis.
During the gel evaluation, a similarity matrix was constructed where each band was treated as a single character and its presence in an individual was designated by 1 (one) and its absence by 0
(zero). The NTSYS-pc software program
(Numerical Taxonomy and Multivariate Analysis for Personal Computers), version 2.1 (Rohlf, 2000)
was used to evaluate the genetic associations between the samples. Pairwise comparisons were made between the genotypes based on Dice (1945) similarity coefficient. The genetic similarity estimate (GS) between each pair of the genotypes
was calculated using the expression
SGij=2a/(2a+b+c), where a=number of positive
coincidences for each pair, b=number of 1-0 discordances for each pair of genotypes, and
c=number of 0-1 discordances for each pair of the genotypes. The simplified representation of the distances was done using a dendrogram obtained by the agglomerative hierarchical unweighted
pair-group method using arithmetic averages
between the results obtained by the different
markers used was tested using Mantel
correspondence test (Mantel, 1967). This test compared the elements of both matrices and estimated the correlation measure that existed between them.
RESULTS
Twenty-two previously selected RAPD primers were used, and only those showing high ability to produce polymorphic bands were selected for the work. These primers produced a total of 265 amplified fragments – bands, with an average of 12.05 bands per primer. Of these, 237 were polymorphic (89.4%) and 28 were monomorphic (10.6%). The number of polymorphic bands varied from 3 to 18 for the OPAR-11 and OPAR-05 primers, respectively. The bootstrap procedures showed that bands used was large enough for this type of study (CVs=5.9%)
A total of 75 alleles were amplified from the 16 pairs of microsatellite primers used, with a variation from 2 to 8 alleles-bands, and a mean amplification of 4.7 alleles per locus. The bootstrap analyses demonstrated that the number of loci used in this study was sufficient to access the diversity reliably among the 16 lines.
According to Tivang et al. (1994), 20
microsatellite loci were enough to analyze the genotypes with accuracy.
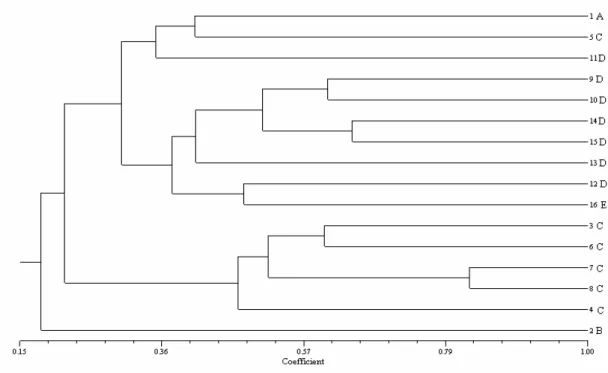
Two independent genetic similarity matrices were constructed from the RAPD and microsatellite data using Dice coefficient (Table 2). The RAPD data similarities ranged from 53% bands in common between the lines 11 and 16 and 84% bands in common between the lines 13 and 14. The similarity coefficient from the microsatellite markers showed a variation from 11% between lines 2 and 10, 6 and 10, and 4 and 16, with maximum similarity observed between lines 7 and 8, with a coefficient of 82%, where these lines showed the same morphological characteristics. These markers, therefore, detected a good level of the diversity between the lines. The similarity values from the microsatellite data, in general showed similarity values below the values of the RAPD-based analyses. The correlation between both the matrices using Mantel test (Mantel, 1967) was 0.54, which was considered a moderate value. Dendrograms based on the similarity values produced from the RAPD and microsatellites were
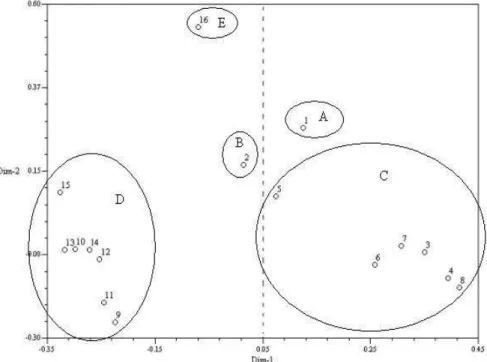
The association between the lines was also examined using the principal coordinates analysis in combination with the RAPD and microsatellite data, and the genetic distances were projected onto a bidimensional plane (Fig. 4). In this analysis, the primary and secondary principal coordinates explained only total variations of 20.7 and 10.2%,
respectively. This procedure was effective to separate the lines into two main groups formed by the lines that showed orange, or yellow endosperm. Therefore, the results observed in the principal coordinates analysis reinforce, the results observed in the dendrogram.
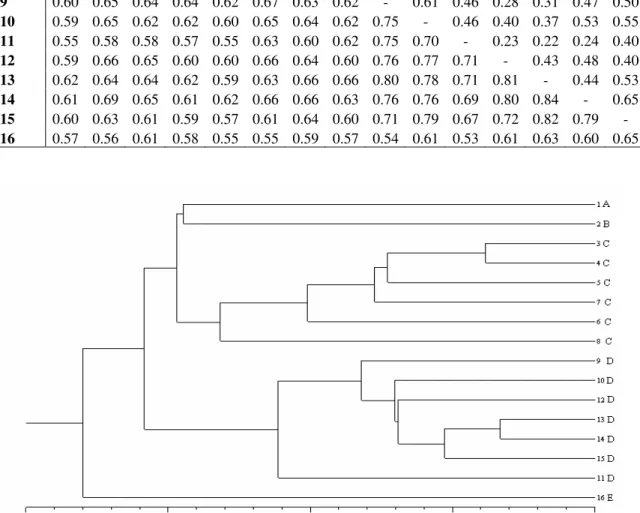
Table 2 - Similarity coefficient values among 16 corn lines obtained by Dice coefficient calculated from RAPD and microsatellite data (above the diagonal line: microsatellites; below the diagonal line: RAPD):
line 1 2 3 4 5 6 7 8 9 10 11 12 13 14 15 16 1 - 0.17 0.18 0.16 0.41 0.35 0.23 0.29 0.22 0.28 0.35 0.29 0.27 0.42 0.57 0.24 2 0.65 - 0.18 0.27 0.28 0.17 0.57 0.17 0.16 0.11 0.23 0.17 0.16 0.12 0.22 0.23 3 0.67 0.64 - 0.57 0.12 0.61 0.42 0.48 0.12 0.59 0.61 0.18 0.17 0.19 0.58 0.62 4 0.62 0.63 0.83 - 0.16 0.38 0.44 0.50 0.37 0.27 0.55 0.17 0.26 0.17 0.16 0.11 5 0.64 0.60 0.73 0.81 - 0.47 0.47 0.41 0.34 0.23 0.35 0.17 0.22 0.12 0.40 0.36 6 0.67 0.68 0.73 0.70 0.72 - 0.59 0.58 0.28 0.11 0.12 0.12 0.27 0.30 0.28 0.18 7 0.65 0.64 0.74 0.78 0.77 0.73 - 0.82 0.34 0.28 0.17 0.35 0.21 0.24 0.28 0.30 8 0.63 0.62 0.66 0.68 0.64 0.64 0.72 - 0.28 0.17 0.12 0.23 0.16 0.24 0.23 0.18 9 0.60 0.65 0.64 0.64 0.62 0.67 0.63 0.62 - 0.61 0.46 0.28 0.31 0.47 0.50 0.35 10 0.59 0.65 0.62 0.62 0.60 0.65 0.64 0.62 0.75 - 0.46 0.40 0.37 0.53 0.55 0.41 11 0.55 0.58 0.58 0.57 0.55 0.63 0.60 0.62 0.75 0.70 - 0.23 0.22 0.24 0.40 0.18 12 0.59 0.66 0.65 0.60 0.60 0.66 0.64 0.60 0.76 0.77 0.71 - 0.43 0.48 0.40 0.48 13 0.62 0.64 0.64 0.62 0.59 0.63 0.66 0.66 0.80 0.78 0.71 0.81 - 0.44 0.53 0.22 14 0.61 0.69 0.65 0.61 0.62 0.66 0.66 0.63 0.76 0.76 0.69 0.80 0.84 - 0.65 0.37 15 0.60 0.63 0.61 0.59 0.57 0.61 0.64 0.60 0.71 0.79 0.67 0.72 0.82 0.79 - 0.41 16 0.57 0.56 0.61 0.58 0.55 0.55 0.59 0.57 0.54 0.61 0.53 0.61 0.63 0.60 0.65 -
Figure 2 - Clustering (UPGMA) of 16 maize inbred lines based on SSR data.
DISCUSSION
The level of polymorphism (89.4%) found in this work was a little above that found by Lanza et al., (1997), who studied the genetic distance between the tropical maize inbred lines using the RAPD markers from the 32 primers, and obtained 80.6% polymorphism. All the 75 alleles produced from the microsatellites were polymorphic, in agreement with Sun et al., (2001), who also obtained 100% polymorphism. One aspect to be considered was that, in this study, taking into account the number and quality of the amplification products, the primers used were rigorously pre-selected, which might have contributed to increase the level of polymorphism. The most important fact that should be taken into consideration is that the variations found in the level of polymorphism could be the result of the distinct regions in the corn genome that were assessed by the selected markers and/or of genotypes differences between the material used (Sun et al., 2001).
The genetic similarity calculated among all the possible pairs for the 16 corn lines ranged from 53 to 84% when obtained from the RAPD data, while those obtained from the microsatellite data ranged from 11 to 82% similarity. This demonstrate that
towards the limited correlation between the results obtained by the RAPD and microsatellites, which could be attributed to the difference between the polymorphisms revealed by both markers used.
RAPD has a dominant character, while
microsatellites have a co-dominant character. It could also be attributed to differences in the effectiveness and/or number of primers used (Liu and Furnier, 1993, Pejic et al., 1998, and Sun et al., 2001).
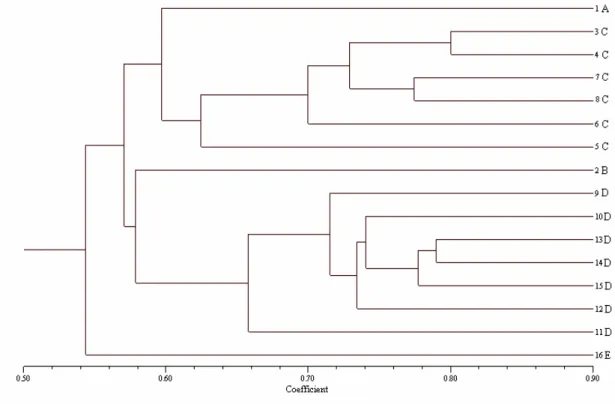
Figure 3 - Clustering (UPGMA) of 16 maize inbred lines based on RAPD and microsatellite data.
The associations shown by the dendrograms, constructed from each marker showed some discrepancies. The RAPD-based markers were in agreement with the information obtained from the pedigrees, while the same was not observed in the dendrogram constructed from the microsatellites. The results found in this work was different from those by Pejic et al., (1998), who compared the genetic similarity between the corn lines from RFLPs, RAPDs, SSRs, and AFLPs, observed that, except for the RAPD, all the other markers were in agreement with the pedigree information. Lanza et al., (1997) described that the RAPD markers were useful to establish the consistent heterotic groups between the corn lines. This corroborate the results obtained in this work, where these markers were effective in establishing the heterotic groups which were in agreement with the pedigree. Russel et al., (1997) also suggested that despite the high polymorphism revealed by the SSRs, these could
not be employed to assess the genetic similarity between the cultivars because, according to Vigouroux et al., (2002, 2005), the microsatellites showed a high mutation velocity, which made the number of repetitions in their sequences varying. Laborda et al., (2005) pointed out that the multiallelism revealed by the microsatellites gave these markers the potential for revealing the genetic diversity in a broad manner, because they not only showed the presence or the absence of a certain allelic variable, but also the different allelic forms that a given locus might contain. Because they display the genetic diversity in an intense manner, the microsatellites favored the genetic differences between two the genotypes under the study, but not their similarities as observed with the RAPD.
between the dendrogram and the principal coordinate’s analysis resulting from the combination between the data showed that the clusters were closer when the lines belonging to the same heterotic group were compared. These
analyses showed a tendency for the lines to cluster together according to the endosperm color; one group consisted predominantly of lines with yellow endosperms while the other showed orange endosperms.
Figure 4 - Principal coordinate analysis obtained by RAPD and microsatellite markers, where lines showed a tendency to separate into two groups according to endosperm color. Primary and secondary coordinates explained 20.66% and 10.23% of genetic variation, respectively.
This type of material coud be used as the potential sources of new alleles to broaden and diversify the genetic base of the breeding programs. Carvalho et al., (2002, 2004) used the ISSR markers and observed that the landrace corn varieties also clustered according to the endosperm color, allowing them to be separated into two main groups, one consisting of varieties with the yellow endosperm and the other with the white endosperm. Similar results were obtained with the RAPD markers in the analyses. The authors pointed out that the endosperm color was an important agronomic trait and also that both the ISSR and RAPD could be effective to assess the genetic variability in this type of germplasm. In conclusion, the results presented in this work demonstrated that the RAPD markers provide consistent information for the pedigree data identification and validation. The most important aspect in this study was the demonstration, by means of the corn lines employed, that these
ACKNOWLEDGEMENTS
This work was supported by the Conselho Nacional de Desenvolvimento Científico e Tecnológico (CNPq).
RESUMO
RAPD e SSR foram utlizados para comparar a diversidade genética entre 16 linhagens de milho. Nas reações de RAPD foram utlizados 22 primers que resultaram na amplificação de 265 fragmentos, enquanto que 16 pares de primes de SSR resultaram em 75 fragmentos. A similaridade baseada no coeficiente de Dice variou de 53% a 84% para o RAPD; para o SSR variou de 11% a 82%. O dendrograma obtido a partir do RAPD mostrou 5 grupos enquanto que o dendrograma obtido a partir do SSR mostrou 3 grupos e uma linhagem isolada. A associação construída a partir dos marcadores e a análise de coordenadas principais separaram as linhagens em dois grupos de acordo coloração de endosperma alaranjado ou amarelo, os marcadores RAPD foram eficientes para a validação dos dados de pedigree enquanto os de microssatélites para reconhecerem diferenças entre caracteres quantitativos. Por acessarem regiões distintas do genoma a escolha de um ou outro marcador vai depender das características do material utilizado e dos objetivos do trabalho.
REFERENCES
Carvalho, V.P.; Ruas, P.M.; Ruas, C.F.; Ferreira, J.M. and Moreira, M.P. (2002), Assessment of genetic diversity in maize (Zea mays L.) landraces using Inter Simple Sequence Repeat (ISSR) markers. Crop Breeding and Applied Biotecnology, 2, 557-568. Carvalho, V.P.; Ruas, P.M.; Ruas, C.F.; Ferreira, J.M.
and Moreira, M.P. (2004), Genetic diversity among maize (Zea mays L.) landraces assessed by RAPD markers. Genetics and Molecular Biology, 27, 228-236.
Chin, E.C.L.; Senior, M.L.; Shu, H. and Smith, J.S.C. (1996), Maize simple repetitive DNA sequences: abundance and allele variation. Genome, 39, 866-873.
Coelho, A.S.G. (2001), DBOOT - Avaliação dos erros associados a estimativas de distâncias/similaridades genéticas através do procedimento de bootstrap com número variável de marcadores, versão 1.1. Departamento de Biologia Geral, Instituto de Ciências Biológicas, Universidade Federal de Goiás. Goiânia, GO.
Cruz, C.D. and Venkovsky, R. (1989), Comparação de alguns métodos de análise dialélica. Revista Brasileira de Genética, 12, 425-438.
Dias, L.A.S.; Marita, J.; Cruz, C.D.; Barros, E.G. and Salomão, T.M.F. (2003), Genetic distance and its association with heterosis in cacao. Brazilian Archives of Biology and Technology, 43-3, p.339-347.
Dice, L.R. (1945), Measures of the amount of ecologic association between species. Ecology, 26, 297-302. Diniz, L.E.C.; Ruas, C.F.; Carvalho, V.P., Torres F.M.;
Ruas, E.A.; Santos, M.O.; Sera T. and Ruas, P.M. (2005), Genetic Diversity Among Forty Coffee Varieties Assessed by RAPD Markers Associated with Restriction Digestion, Brazilian Archives of Biology and Technology, 48-4, p.511-521.
Duvick, D.N. (1984), Genetic diversity in major farm crops on the farm and in reserve. Econ. Bot., 38, 157-174.
Enoki, H.; Sato, H. and Koinuma, K. (2002), SSR analysis of genetic diversity among maize inbred lines adapted to cold regions of Japan. Theor. Appl. Genet., 104, 1270-1277.
Ferreira, M.E. and Grattapaglia, D. (1998), Introdução ao uso de marcadores moleculares em análise
genética. 3 rd ed. Brasília:
EMBRAPA-CENARGEM, pp.220. (EMBRAPA-CENARGEM. Documento, 20).
Goodman, M.M. and Bird, R.McK. (1977), The races of maize IV: tentative grouping of 219 Latin American races. Econ. Bot., 31, 204-221.
Gupta, M.; Chyi, Y.S.; Romero-Severson, J. and Owen, J.L. (1994), Amplification of DNA markers from evolutionarily diverse genome using single primers of simple sequence repeats. Theor. Appl. Genet., 89, 998-1006.
Hahn, V.; Blankenhorn, K.; Schwall, M. and Melchinger, A.E. (1995), Relationships among early European maize inbreds. III. Genetic diversity revealed with RAPD markers and comparison with RFLP and pedigree data. Maydica, 40, 299-310. Hallauer, A.R.; Russel, W.A. and Lamkey, K.R. (1988),
Corn breeding. In: Sprague, G.F., Dudley, J.W. (eds)
Laborda, P.R.; Oliveira, K. M.; Garcia, A. A. F.; Paterniani, M. E. A. G. Z. and Souza, A. P. (2005), Tropical maize germplasm: what can we say about its genetic diversity in the light of molecular markers?
Theor. Appl. Genet.,111, 1288-1299.
Lanza, L.L.B.; Souza Jr., C.L.; Ottoboni, L.M.M.; Vieira, M.L.C. and de Souza, A.P. (1997), Genetic distance of inbred lines and prediction of maize single-cross performance using RAPD markers.
Theor. Appl. Genet., 94, 1023-1030.
Liu, XinZhi; Peng, ZeBin; Fu, JunHua; Huang, ChangLing; Liu, X.Z.; Peng, Z.B.; Fu, J.H. and Huang, C.L. (1998), Maize inbred line grouping by using cluster analysis of RAPD molecular marker, phenotype and heterosis. Acta Agriculturae Boreali Sinica,13, 36-41.
Liu, Z. and Furnier, G.R. (1993), Comparison of allozyme, RFLP and RAPD markers for revealing genetic variation within and between trembling aspen and bigtooth aspen. Theor. Appl. Genet., 87, 97-105. Lu, H. and Bernardo, R. (2001), Molecular marker
diversity among current and historical maize inbreds.
Theor. Appl. Genet., 103, 613-617.
Lübberstedt, T.; Melchinger, A.E.; Duble, C.; Vuylsteke, M. and Kuiper, M. (2000), Relationships among early European maize inbreds: IV. Genetic diversity revealed with AFLP markers and comparison with RFLP, RAPD and pedigree data.
Crop Sci., 40, 783-791.
Mantel, N. (1967), The detection of disease clustering and a generalized regression approach. Cancer Res.,
27, 209-220.
Pejic, I.; Ajmone-Marsan, P.; Morgante, M.; Kozumplick, V.; Castiglioni, P.; Taramino, G. and Motto, M. (1998), Comparative analysis of genetic similarity among maize inbred lines detected by RFLPs, RAPDs, SSRs and AFLPs. Theor. Appl. Genet., 97, 1248-1255.
Pinto, L.R.; Vieira, M.L.C.; Souza Jr, C.L. and Souza, A.P. (2003), Reciprocal recurrent selection effects on the genetic structure of tropical maize populations assessed at microsatellite loci. Genetics and Molecular Biology, 26, 355-364.
Rohlf, F.J. (2000), NTSYS-pc Numerical Taxonomy and Multivariate Analysis System version 2.1. Owner manual.
Russel, J.R.; Fuller, J.D.; Macaulay, M.; Hatz, B.G.; Jahoor, A.; Powell, W. and Waugh, R. (1997), Direct comparison of levels of genetic variation among barley accessions detected by RFLPs, AFLPs, SSRs and RAPDs. Theor. Appl. Genet., 95, 714-722.
Senior, M.L.; Murphy, J.P.; Goodman, M.M. and Stuber, C.W. (1998), Utility of SSRs for determining genetic similarities and relationships in maize using an agarose gel system. Crop Sci., 38, 1088-1098. Smith, J.S.C.; Chin, E.C.L.; Shu, H.; Smith, O.S.; Wall,
S.J.; Senior, M.L.; Mitchell, S.E.; Kresovich, S. and Ziegle, J. (1997), An evaluation of the utility of SSR loci as molecular markers in maize (Zea mays L.): comparisons with data from RFLPs and pedigree.
Theor. Appl. Genet., 95, 163-173.
Smith, J.S.C. and Smith, O.S. (1989), Comparison of heterosis among hybrids as a measure of relatedness with that to be expected on the basis of pedigree.
Maize Genet. Coop. Newsl., 63, 86-87.
Sun, G.L.; William, M.; Liu, J.; Kasha, K.J. and Pauls, K.P. (2001), Microsatellite and RAPD polymosphisms in Ontario corn hybridos are related to the commercial sources and maturity ratings.
Molecular Breeding, 7, 13-24.
Taramino, G. and Tingey, S. (1996), Simple sequence repeats for germplasm analysis and mapping in maize. Genome, 39, 277-287.
Tivang, J.G.; Nienhuis, J. and Smith, O.S. (1994), Estimation of sampling variance of molecular marker data using the bootstrap procedure. Theor. Appl. Genet., 89, 259-264.
Verbitskaya, T.G.; Sivolap, Y.M.; Guzhva, D.V. and Sokolov, V.M. (1999), Analysis of the relation between the genetic divergence of the DNA of corn lines and hybrid productivity. Russian Agricultural Sciences, 5, 28-33.
Vigouroux, Y.; Jaqueth, J.S.; Matsuoka, Y.; Smith, O.S.; Beavis, W.D.; Smith, J.S.C. and Doebley, J. (2002), Rate and pattern of mutation at microsatellite loci in maize. Mol. Biol. Evol., 19, 1251-1260. Vigouroux, Y.; Mitchel, S.; Matsuoka, Y.; Hamblin,
M.; Kresovich, S.; Smith, J.S.C.; Jaqueth, J.; Smith, O.S. and Doebley, J. (2005), An analyses of genetic diversity across the maize genome using microsatellites. Genetics, 169, 1617-1630.
Williams J.G.K.; Kubelik A.R.; Livak K.J.; Rafalski J.A. and Tingey. S.V. (1990), DNA polymorphisms amplified by arbitrary primers are useful as genetic markers. Nucleic Acids Research, 18, 6531-6535. Wu, M. (2000), Genetic diversity and its relationship to
hybrid performance and heterosis in maize as revealed by AFLPs and RAPDs. Maize Genet. Coop. Newsl., 74, 62-63.