Consistent Improvement
in the Nutritional
Status of Colombian
Children between
1965 and 1989l
Jo& 0. MORA,~
BELBN DE PAREDES,~ L&A
DE NAVARRO,~
& EDGAR RODR~GUEZ~
Three national anfhropomefric surveys carried out in Colombia in 19651966, 1977-1980, and 1986-1989 provide a reasonably standardized basis for comparing fhe nufritional status
of infants and young children in those years. That comparison, presented here together with appropriate socioeconomic data, indicates marked reduction of malnutrition paralleling strong socioeconomic gains.
E
nergy-protein malnutrition of infants and children, commonly reflected in physical growth retardation, is one of the most important public health problems of developing countries-because of its prevalence and because of its functional implications for the individual and soci- ety at large. A variety of developing country national nutrition surveys have been performed over the last three dec- ades to assess the magnitude of child- hood nutrition problems (I). However, repeated prevalence surveys using simi- lar statistically selected samples repre- sentative of the entire population are un- common, and so comparable data suitable for assessing trends over time and the re- lationship of such trends to socioeconomic development are not usually available.An exceptional situation exists in Co-
‘This article will also be published in Spanish in the Boletin de la Oficina Sanitaria Panamericana, Vol. 113, 1992.
‘Senior Associate, International Science and Tech- nology Institute, Washington, D.C., U.S.A. 3Fundaci6n Santa Fe de Bogotl, BogotB, Colombia. 41ndependent consultant, Santa Fe de Bogot6, Bo-
got& Colombia.
lombia, where the Ministry of Health has conducted national health surveys covering the periods 1965-1966 (2), 1977- 1980 (3), and 1986-1989 (4). These sur- veys included anthropometric measure- ments of country-wide samples of infant and young (preschool age) children. The three resulting sets of data, covering sim- ilar representative samples of the general population, are comparable enough to permit valid assessment of changes in the nutritional status of Colombian children over the 24-year interval between 1965 and 1989.
This article reports findings obtained by comparing the overall results of the studies’ anthropometric evaluations of young children. General demographic, socioeconomic, and health information (obtained from official government sta- tistics and other sources) are also pre- sented in order to show concomitant so- cial and economic development trends throughout the 24-year period. The rea- son for using a variety of social and eco- nomic indicators here is to document par- allel trends in these indicators-rather than to relate them to each other, make attributions, or explore causal relation- ships.
METHODS
The three country-wide surveys were conducted using samples representing virtually the entire population (nearly 98%), excluding only those people (less than 3% of the total) living in the un- derpopulated eastern plains and jungle areas. These samples were comprised of the members of randomly selected households from which family and in- dividual data were collected. Anthropo- metric measurements were taken from all children within specified age ranges. The numbers of children up to five years of age that were included in each survey are shown in Table 1.
Similar data collection methods, mea- surement techniques, and data quality control procedures were used in each of the three studies. Anthropometric mea- surements, taken by trained interviewers following standard procedures, included weight to the nearest 0.1 kg and length (up to two years of age) or height (after two years) to the nearest millimeter (5). Birth dates were verified whenever possible.
Similar analytic procedures were ap- plied to the three sets of data. Age in months, weight, and length or height were used to obtain three anthropometric in- dicators: weight-for-age, length or height- for-age, and weight-for-length or height;
Table 1. Sample sizes of children in the three surveys, by age group (Colombia, 1965-
1989).
Age
(in months)
Years of survey
1965-66 1977-80 1986-89
o-5 102 187 200
6-11 101 216 208
12-23 192 319 392
24-35 196 369 401
36-47 175 338 379
48-59 184 331 393
Total 950 1,760 1,973
and the observed values were compared to those proposed for international ref- erence by the World Health Organization (6). Prevalences of study subjects with low anthropometric indicator values were estimated according to WHO procedures (7), using a cutoff point two standard de- viations (-2.0 Z scores) below the ref- erence mean. The data presented also in- clude demographic, socioeconomic, and health indicators obtained from appro- priate sources.
RESULTS
Changing Childhood
Malnutrition
Prevalences
Tables 2, 3, and 4 show estimated prev- alences of malnutrition among the survey subjects O-59 months of age. These es- timates have been derived from the three aforementioned anthropometric indica- tors, on the basis of which comparisons between the three 1965-1989 surveys can be made. Figures 1 and 2 show trends in malnutrition prevalences among rural and urban subjects.
Global Malnutrition
Figure 1. Prevalences (%) of global Figure 2. Prevalences (%) of stunting (low malnutrition (low weight-for-age) among length or height-for-age) among Colombian Colombian children O-59 months of age, children O-59 months of age, grouped grouped according to urban and rural areas of according to urban and rural areas of residence, as indicated by data from the residence, as indicated by data from the national health surveys of 1965-1966, 1977- national health surveys of 1965-l 966, 1977- 1980, and 1986-1989. 1980, and 1986-1989.
”
196511961
t
19771198
Year
n
Rural 0 UrbanL
198611989
40
30
g z
F 20 K -e 0
IO
0
I-
-
196511966 197711980
Year
1986/1989
H Rural OUrban
Table 2. Prevalences of global malnutrition (low weight-for-age) detected by the three surveys among the children studied (Colombia, 1965- 1989).
Prevalences of low weight-for-age malnutrition (%)” Age group Mildb Moderate/severe’ Total
(months) 1965-66 1977-80 1986-89 1965-66 197740 1986-89 1965-66 1977-80 1986-89
o-5 0.6 2.6 0.4 0.8 0.4 0.0 1.4 3.0 0.4
6-11 10.1 12.5 6.3 7.3 1.7 2.6 17.4 14.2 8.9
12-24 17.5 18.1 10.8 7.1 5.8 5.4 24.6 23.9 16.2
25-35 15.8 13.5 8.5 10.4 2.0 2.2 26.2 15.5 10.7
36-47 22.8 16.9 6.1 4.2 1.8 0.4 27.0 18.7 6.5
48-59 16.6 17.7 10.8 2.8 1.4 1.8 19.4 19.1 12.6
o-59 15.5 14.4 7.9 5.6 2.4 2.2 21.1 16.8 10.1
d2.0 or more Z-scores below the reference mean. bBetween 2.0 and 2.9 Z-scores below the reference mean. c3.0 or more Z-scores below the reference mean.
Table 3. Prevalences of stunting (low length or height-for-age) detected by the three surveys among the children studied (Colombia, 1965-I 989).
Prevalences of stunting flow length or height-for-age) t%) Age group Mild" Moderate/severe' Total
(months) 1965-66 1977-80 1986-89 1965-66 1977-80 1986-89 1965-66 1977-80 1986-89 o-5 2.2 0.8 2.7 1.4 0.6 0.0 3.6 1.4 2.7 6-11 7.5 7.3 6.1 3.1 2.8 0.8 10.6 10.1 6.9 12-23 17.8 18.3 14.0 13.7 8.3 10.0 31.5 26.6 24.0 24-35 16.5 12.8 9.9 16.3 7.2 3.8 32.8 20.0 13.7 36-47 26.9 21.4 12.3 19.6 Il.4 5.0 46.5 32.8 17.3 48-59 26.7 23.0 16.7 18.1 8.9 6.8 44.8 31.9 23.5 o-59 18.2 15.1 Il.4 13.7 7.3 5.2 31.9 22.4 16.6
“2.0 or more Z-scores below the reference mean. %etween 2.0 and 2.9 Z-scores below the reference mean. ‘3.0 or more Z-scores below the reference mean.
Stunting
The survey data indicate a drop of about 30% in the prevalence of stunting (low length or height-for-age) among study children O-59 months old from the first survey to the second, and a drop of about 48% from the first survey to the third (Table 3). As in the case of global mal- nutrition, moderate to severe stunting dropped to a greater extent (by 62% com- pared with 37% for mild stunting), and changes in the prevalence of total and severe stunting were more consistent across age groups than those of mild stunting.
Wasting
All three surveys found the prevalence of wasting (acute malnutrition, low weight- for-length or height) to be relatively low among the respective O-59 month groups (Table 4). The data suggest,that this prevalence increased from 3.9% to 4.9% between the first two surveys, when there was a large decline in stunting, but dropped to 2.9% in the third, the per-
centage of moderate to severe cases found by the latter survey being only 0.5%. When the data are broken down by age group, the highest prevalences of wast- ing are found in the 12-23 month group;
Table 4. Prevalence5 of wasting (acute malnutrition, low weight-for-length or height) detected by the three surveys among the children studied (Colombia, 1965-I 989).
Prevalences of acute malnutrition (low weight-for-length or height) (%I" Age group Mildb ' Moderate/severe' Total
(months) 1965-66 1977-80 1986-89 1965-66 1977-80 1986-89 1965-66 1977-80 1986-89 o-5 I.6 4.0 1.0 I.5 0 0.5 3.1 4.0 I.5 6-11 3.9 5.6 2.4 3.7 3.1 I .o 7.6 8.7 3.4 12-23 6.7 7.9 4.3 0.7 1.9 0.8 7.4 9.8 5.1 24-35 2.8 4.1 3.5 1.0 0 0.2 3.8 4.1 3.7 36-47 I.6 0.8 0.8 0 0 0 I.6 0.8 0.8 48-59 0.6 2.4 2.0 0.3 0 0.3 0.9 2.4 2.3 o-59 3.1 4.1 2.4 0.8 0.8 0.5 3.9 4.9 29
but these do not exceed 10% for any of the survey periods shown in the table, the prevalence found in the last period (5.1%) being the lowest.
Geographic Patterns
Overall, the data show that malnutri- tion declined more in the rural areas, thus tending to close the preexisting urban- rural gap, whereas the decline in stunt- ing was proportionally greater in urban areas (Figures 1 and 2).
More generally, the malnutrition pic- ture tended to improve most strongly in the poorest regions of the country, so that former marked regional differences in the prevalence of malnutrition also tended to diminish (4). In 1965-1966 the percentages of study children O-59 months old who were below the third percentile of the WHO international reference standard of weight-for-age ranged by geographic region from 12.0% to 31.9%, and the percentages below the third per- centile of length or height-for-age ranged by geographic region from 17.2% to 39.3%.
However, by 1986-1989 the correspond- ing ranges had been sharply reduced, the low weight-for-age range being 12.4% to 14.7% and the low length or height-for- age range being 16.9% to 21.8%.
Changes in Social and Economic
Indicators
During the 24-year period spanned by the surveys, important positive changes occurred in a broad spectrum of national demographic, socioeconomic, and health indicators (8-25). Table 5 shows demo- graphic and socioeconomic (household) data derived from country-wide popula- tion censuses carried out in 1964, 1973, and 1985. While Colombia’s total popu- lation increased by about 69% between 1964 and 1985 (from 17.5 to 27.9 million), reaching nearly 33 million by 1990, the annual population growth rate declined from 3.2% to 1.7%. The age distribution changed accordingly; the share of the population accounted for by children (people under 15 years old) dropped from nearly 49% to 36%, and the shares ac-
Table 5. Selected demographic indicators and household conditions reported by the last three national censuses in Colombia (1964, 1973, and 1985).
Total population (millions) Annual population growth (%) Age distribution f%):
<I 5 years < 5 years < 1 year
Urban:rural population % illiterate (215 yrs) % crowded households
(24 persons per room)
% households with protected floors (wood, tile, etc.)
% households with electricity Urban
Rural
% households with drinking water supply Urban
Rural
1964 1973 1985 17.5 22.9 27.9
3.2 3.0 1.7 48.8 44.8 36.1 18.0 15.5 12.1 4.0 3.2 2.2 52~48 59:41 67:33 27.1 18.8 11.5
- 22 I3 - 65 84
- 58 78
- 87 95
- 15 41 61 70 87 89 24 28
counted for by those under five years old and under one year old fell from 18% to 12% and from 4% to 2%, respectively.
At the same time, the urban:rural ratio changed from 52:48 to 67133 in two dec- ades (the most recent estimate is 70:30), and the illiteracy rate among people 15 years or older dropped from 27% to less than 12% (see Table 5). Between 1973 and 1985 the percentage of households with four or more people per room declined from 22% to 13%, while the percentage with protected floors (generally wood or tile) rose from 65% to 84% and the per- centage with access to electricity in- creased from 58% to 78%, this latter im- provement being especially marked in
rural areas. Changes in sanitation were less pronounced, the percentage of households provided with piped water remaining es- sentially unchanged in the urban areas and increasing only slightly in rural zones.
Significant changes in certain other so- cioeconomic indicators that occurred be- tween 1950 and 1988 are shown in Table 6. The gross domestic product (GDP) grew at average annual rates of 6.5% between 1967 and 1974, 5.0% between 1974 and 1979, and 3.4% between 1980 and 1988, the average annual GDP growth over the 35-year period 1950-1985 being 4.9% (16). Correspondingly, per capita GDP grew at an annual average rate of 2.1% in 1950- 1972, 3.8% in 1972-1979, and 1.2% in 1980-1988, the average annual rate be- tween 1965 and 1988 being 2.4%. The total income share of that half of the ur- ban population with the lowest income increased from 16% in 1970 to 22% in 1985, while the total income share of that 10% of the urban population with the highest income dropped from 43% to 36% in the same period.
Women’s participation in the formal la-
Table 6. A variety of socioeconomic indicators in Colombia applying to the oeriod 1964- 1989.
Applicable period, except where indicated otherwise Indicator 196546 197740 1986-89 Gross domestic product
(% annual growth) 6.5 (1967-74) 5.0 (1974-79) 3.4 (1980-88) Per capita GDP
(% annual growth) 2.1 (1950-72) 3.8 (1972-79) 1.2 (1980-88) Income share (%) of 50%
of the population
with lowest income 15.9 (1970) - 21.8 (1985) Income share (%) of 10%
of the population
with highest income 43.4 (I 970) - 36.4 (1985) Adult women with
salaried jobs (%) 17.3 (1964) 26.1 45.0 (1985) Net primary school
enrollment (%) 57 (1965) 80 93 (1985) Primary school completion
rate (%) 15 36 57
% urban completion 41 53 62 % rural completion 3 11 18 Secondary school
enrollment (%) 17 (1965) 31 55 (1985) University enrollment (%) 3 7 14
bor force also increased, from 17% in 1964 to 26% in 1977-1980 and 45% in 1985. Net primary school enrollment rose from
57% in1965to93% in1985(virtdly 100% in the urban areas), and secondary school enrollment increased from 17% to 55% in the same period. Female enrollment rates in both primary and secondary school more than doubled, and completion rates improved significantly in both urban and rural areas. The male:female ratio of pri- mary and secondary school students reached 50:50 in 1986-1988, while that of university students changed from 65:35 in 1975 to 52:48 in 1985.
The Demographic and Health Surveys of 1978, 1986, and 1990 showed a signif-
icant increase in the educational level at- tained by women of reproductive age: Illiteracy among such women declined from 13.3% to 4.2%, while the percentage of women with at least secondary edu- cation rose from 33.7% to 54.5% (17).
Changes in general health indicators are shown in Table 7. Life expectancy at birth rose from 55 years in 1965-1966 to 69 years in 1989. The total fertility rate (live births per woman) declined pro- gressively from 7.0 in 1965 to 2.9 in 1989. The crude birth rate dropped from 45 per thousand population in 1964 to 26 in 1988, while the crude death rate fell from 14.0 per thousand in 1965 to 5.2 in 1988. In- fant mortality declined steadily-from 86
Table 7. Selected health indicators obtained during the period 1960-89 in Colombia.
Applicable period, except where indicated otherwise
Indicator 1965-66 1977-80 1986-89 Life expectancy at birth
(years)
Crude birth rate per thousand population
Crude death rate per thousand population Total fertility per woman Infant mortality (deaths per
thousand live births) Mortality (deaths per
thousand) among children l-4 years of age Mortality (deaths per
thousand live births) among children <5 years of age Mortality (deaths per
thousand) among children 5 - 14 years of age Maternal mortality (deaths per
100,000 deliveries)
Diarrhea1 disease mortality as: % of infant mortality % of l-4 year mortality Acute respiratory disease
mortality as: % of infant mortality % of l-4 year mortality
55 62 45 (1964) 30 14.0 (1965) 6.4
7.0 (1965) 4.3 86 64
14.5 (I 965) 7.0
148 (1960) 78
-
254 (1965) 160
-
1.1 (1970)
24.0 (1977) 23.2
15.2 15.0
69 (1989) 26 (1988) 5.2 (1988) 2.9 (1989) 39 (1989)
3.0 (I 988)
50 (1989)
0.5 (1988) 110 (1987) 11.4 (1988) 16.6 (1988)
11.2 (I 988) 12.1 (1988) Sources: References 8, 73- 17.
deaths per thousand live births in 1965- 1966 to 39 in 1989. (The most recent in- fant mortality estimate is as low as 27 deaths per thousand live births---/l’.) In general, regional and urban-rural differ- ences in rates of infant mortality have substantially diminished, while those as- sociated with maternal education, mater- nal age, birth order, and birth spacing have persisted.
The percentage of infant mortality at- tributed to diarrhea1 diseases fell from 24% in 1977 to 11.4% in 1988, while that attributed to acute respiratory infections dropped less sharply. The two-week prevalence of diarrhea among children O-5 years old dropped from 19% in 1986 to 12% in 1990, and the share of cases
treated with oral rehydration therapy reached 49% (31% being treated with pre- packaged ORS mixtures and 18% with mixtures made at home) (27). Maternal mortality also dropped, from 254 deaths per 100,000 deliveries in 1965 to 110 in 1987, as did overall mortality among women of reproductive age (from 2.6 to 1.2 per thousand women).
Mortality among preschoolers in the l- 4 year age group was 14.5 deaths per thousand in 1965, 7.0 in 1977-1980, and 3.0 in 1988; in a similar fashion, mortality among school-age children dropped from 1.1 per thousand in 1977 to 0.6 in 1984. Overall mortality (including infant mor- tality) among children under 5 declined from 148 deaths per thousand in 1960 to 50 in 1989 (8). In 1964, children under age 5 represented 17.6% of the popula-
tion and accounted for nearly 50% of all
deaths, while in 1985 they represented only 12% of the population and accounted for only 27% of all deaths.
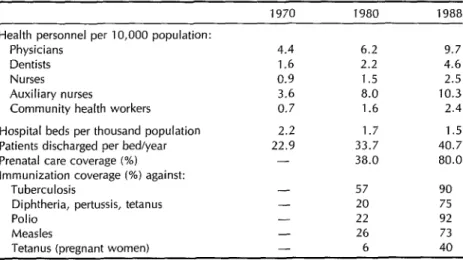
There was also a large increase in both the availability of health personnel and the coverage provided by health services (Table 8). More specifically, there were significant improvements in the availa- bility of physicians, dentists, nurses, aux- iliary nurses, and community health workers. Although the average number of hospital beds per thousand inhabitants declined, their utilization (as indicated by the number of patients discharged per bed per year) improved significantly. The
Table 8. Indicators of health resource availability, health care provided, and immunization coverage in Colombia, 1970-88.
Health personnel per 10,000 population: Physicians
Dentists Nurses Auxiliary nurses
Community health workers Hospital beds per thousand population Patients discharged per bed/year Prenatal care coverage (%) Immunization coverage (%) against:
Tuberculosis
Diphtheria, pertussis, tetanus Polio
Measles
Tetanus (pregnant women) Sources: References 8. JS- 17.
1970 1980 1988
4.4 6.2 9.7 1.6 2.2 4.6 0.9 1.5 2.5 3.6 8.0 10.3 0.7 1.6 2.4 2.2 1.7 1.5 22.9 33.7 40.7 - 38.0 80.0
- 57 90
- 20 75
- 22 92
- 26 73
proportion of pregnancies receiving pre- natal care from trained personnel in- creased from 38% in 1970 to 80% in 1990 (27). Regarding deliveries, the 1990 De- mographic and Health Survey (17) found that about 80% of the last deliveries re- ported by mothers in the national survey sample were attended by formally trained health personnel (71% by physicians) and that 76% of these deliveries occurred at health institutions.
DISCUSSION
As in other developing countries, childhood malnutrition has long been a major public health problem in Colom- bia. Partial studies carried out in the 1960s reported prevalences above 60% among children under five years of age; these estimates were based on the Gbmez clas- sification, which takes 90% of the stan- dard weight-for-age as a cutoff. The na- tional prevalence reported in 1965-1966 using this criterion was 55.8%, with mod- erate to severe malnutrition cases (those under 75% of the standard weight-for- age) reaching 15.7% (3).
When a more accepted and statistically meaningful cutoff point, established at two standard deviations below the mean of the reference population, was applied to the first national survey of 1965-1966, the prevalence of global malnutrition (low weight-for-age) among children under five years old was 21.1%, and the prevalence of stunting (low length or height-for-age indicating retarded linear growth) was an even higher 31.9% (3). On the average, between two and three out of every 10 children were clearly undernourished. As in most Latin American countries, acute malnutrition or wasting (as indicated by low weight-for-length or height) was rel- atively less common (28), its general prevalence being 3.9%, and it affected mostly children in the 6-23 month age
group, its prevalence among them being approximately 7.5%.
By 1977-1980, as indicated in Tables 2 and 3, the prevalences of global malnu- trition and stunting had declined by about 20% and 30%, respectively (3). The re- sults of the 1977-1980 survey indicate that one out of every six children under five years of age was generally malnourished (having low weight-for-age), and that one out of five was stunted (with low height or length-for-age). This declining trend in the prevalences of these forms of mal- nutrition continued after 1980. By 1989, only one out of 10 children exhibited global malnutrition, and only one out of six was stunted.
Overall, the prevalences of both global malnutrition and stunting were cut in half during the 1965-1989 period. This con- trasted with the prevalence of wasting (low weight-for-height or length), which was found by all three surveys to be rel- atively low. Despite changes in the over- all rates of malnutrition over time, the first two years of life remained the most critical period, one that carried the high- est risk of physical growth retardation (see Tables 2-4).
As the data indicate, major improve- ments in the childhood nutrition picture have accompanied a relatively rapid pro- cess of social and economic develop- ment. Among the developing countries, Colombia has been one of the most suc- cessful in raising its people’s standard of living. The economy has grown steadily and has become increasingly diversified over the past three decades, and the country has made the transition from a predominantly agricultural society to one that is highly urbanized.
Throughout the 1960s and 197Os, and to a lesser extent in the 198Os, economic growth was accompanied by substantial improvements in public expenditures for the social sector (29). Despite the eco- nomic crisis, public social expenditures
throughout the 1980s represented about experienced a rapid demographic tran- 8% of the total gross national product, sition (13-14), with dramatic declines in and expenditures for education, health, rates of fertility and population growth. and social security maintained their shares The fertility decline has been attributed (38%, 14%, and 39%, respectively) of to- to substantial improvement in women’s tal public social expenditures (26). education and access to the labor force,
Sizeable investments have been made increased urbanization, improved in- in the nation’s infrastructure-especially come, delayed marriage, and increased in electric power, communications (the availability and use of birth spacing number of telephone lines grew from methods (the prevalence of contraceptive 68,000 in 1965 to 3 million in 1985), and use reached 66% in 1990) (17). As a con- roads (the road network quadrupled in sequence, the population’s age structure the same period)-and social services were changed dramatically as the relative size developed throughout the country. of younger age groups shrank.
The number of homes and their phys- Levels of education, especially of women, ical condition also improved. The num- also registered substantial gains (25). Since ber of dwelling units increased from 1.6 1960, primary school enrollment has more million in 1950 (making an average of 6.6 than doubled, secondary school enroll- persons per unit) to 6.4 million in 1985 ment has sextupled, and university en- (bringing the average to 4.2 persons per rollment has increased fifteen-fold. The unit). By 1985-1987 about 92% of the illiteracy rate has fallen more than 55%, population (all urban residents and 76% and previous gender differences regard- of the rural dwellers) had access to safe ing literacy have disappeared. Not only water (8). The 1990 Demographic and has female access to the educational sys- Health Survey (17) found that 99% of the tern increased, but women’s formal par- urban households had electricity, 95% had ticipation in the labor force has risen by a piped water supply, and 89% were con- nearly 50% (22).
netted to a sewage system; the respective Food production and availability have proportions for rural households were usually been sufficient to meet estimated 71%, 43%, and 17%. needs (22). Indeed, annual increases in
Significant changes in income distri- food production have surpassed declin- bution also occurred. Colombia is one of ing rates of population growth, register- the few Latin American countries that has ing average rates of 4.5% in 1965-1980 managed to improve an initially very un- and 2.4% in 1980-1988. This has pro- equal distribution of income. The GIN1 duced a steady increase in per capita food coefficient, a measure of inequality which availability (9), with the per capita dietary in theory may range from 0 (perfect energy and protein supplies rising from equality) to 1 (complete inequality), fell 2,174 calories and 52 grams of protein per steadily from 0.57 in 1964 to 0.45 in 1988 day in 1965 to 2,561 calories and 57 grams (20). The incidence of poverty fell by 2.9 of protein in 1988 (at which point the percentage points a year between 1971 daily calorie supply was at 110% of that and 1978 (9), a period when the real wages required) (8).
specific mortality, and the role of infec- tious diseases in childhood morbidity and mortality (8, 11, 15). Today far more Co- lombians have access to health services, safe drinking water, and other basic ser- vices than was the case previously.
It is well known that improvements in education, health, and nutrition tend to reinforce each other. However, the social changes that have occurred in Colombian society over the last few decades are not merely the consequence of a relatively fast rate of economic growth. Successive governments have given relatively high priority to social improvements, as dem- onstrated by substantial budgetary allo- cations to education, training, health, housing construction, and recreation. The social sector’s proportional share of the total national budget rose from 31% around 1965 to nearly 50% by 1980. De- spite current economic adjustment poli- cies, at present some 26.8% of all public investments are devoted to the social in- frastructure-9.9% to water and sewer- age, 7.0% to education, and 9.9% to health and nutrition (II). It should be noted, however, that the health sector’s share of national budgetary resources decreased from 10% in the 1970s to only 4.4% in 1987 (JO), and that overall per capita health expenditures declined from about 8% of GNP to about 7% in the period from the 1970s to the late 1980s.
Colombia created a national health sys- tem in 1975. Since then the coverage pro- vided by primary health care services has increased steadily, as has the number of physical facilities (rural health centers and posts). By 1980, 87% of the population had access to a health center or post and 71% had access to a hospital-access to these facilities being defined as having them reachable from home in two hours using the normal mode of transportation. Recent estimates indicate that public health services are readily available to about 60% of the population, with an ad-
ditional 30% of the population being served by the Social Security System and private health care services. It is also worth noting that unprecedented levels of vac- cination have been attained: 90% against tuberculosis; 75% against diphtheria, pertussis, and tetanus; 92% against polio; and 73% against measles. In addition, 40% of all pregnant women are being vacci- nated against tetanus (8).
Regarding nutrition, Colombia has a
long tradition of nutrition and primary health care development, and increasing priority and resources have been allo- cated to nutrition-related programs. A number of nutrition improvement initi- atives have been implemented-includ- ing the integrated applied nutrition pro- grams in the 1960s and early 1970s that
later evolved toward a National Food and Nutrition Plan (21), the Integrated Rural Development Program that has always
enjoyed sustained political backing and central government support, and the functional surveillance system set up in the late 1980s to monitor the country’s food and nutrition situation and to guide development of policies and programs.
CONCLUDING
REMARKS
The foregoing account has sought to show the consistent improvement in the nutritional status of Colombian children over the past three decades that has par- alleled positive changes in social and eco- nomic development indicators. It is not possible, within the scope of this presen- tation, to attribute these positive trends to particular global or sectoral factors, policies, or programs. Additional time se- ries studies may shed some light on this matter. Meanwhile, it should be noted that the consistently positive general trend appears to have slowed down during the first half of the 198Os, over the course of the economic crisis affecting most devel- oping countries, particularly in Latin
America. Fortunately, however, Colom- bia has been less affected than many Latin American countries, and economic indi- cators have recently shown some recu- peration. Overall, the country’s eco- nomic growth during the 1980s reached 24.7%, the highest in the region, as com- pared to an overall regional average of
10.7%.
It should also be noted that despite significant improvement in children’s nu- tritional status, various types of malnu- trition (including protein-energy malnu- trition, iron deficiency anemia, and marginal vitamin A deficiency in some areas) still pose serious nutrition prob- lems affecting important segments of the Colombian population (3, 22, 23). As of 1989, it was estimated that over 400,000 children under five years old were suf- fering from protein-energy malnutrition (as indicated by low weight-for-age), about 681,000 were stunted (most likely as a result of chronic deprivation and mal- nutrition), and close to 120,000 were wasted (acutely malnourished). There- fore, despite the progress to date, it seems apparent that only the ongoing concern and political commitment of govern- ments, political leaders, policy makers, and the public at large regarding equi- table social and economic development, promotion and acceleration of required concurrent changes to the social struc- ture, and improved public access to ed- ucation, health care, nutrition, and social services can ensure that sustained eco- nomic growth will be accompanied by a continued nutritional improvement ulti- mately leading to the virtual eradication of malnutrition.
REFERENCES
2. Colombia, Ministerio de Salud, Asocia- ci6n Colombiana de Facultades de Med- icina (ASCOFAME). lnvesfigacidn National de Morbilidad: evidencia clinica. Bogota: In- stituto National de Salud; 1967.
3. Mora JO. Sifuacidn nufricional de la poblacidn colombiana en 1977-80: Volume 1, resultados anfropomefricos y de laboratorio, comparacidn con 1965166. BogotB: Ministerio de Salud, Institute National de Salud, Asociacibn Colombiana de Facultades de Medicina; 1982.
4. Castro de Navarro L, Acosta F. Encuesta National sobre Conocimientos, Attitudes y Prdcticas en Salud, 1986-1989: situacibn nutritional y patrones de alimentacibn en menores de 5 arias. Bogota: Ministerio de Salud, Institute National de Salud; 1990. 5. Jelliffe DB. The assessment of the nutritional
sfafus
of
the community, wifk special referenceto field surveys in developing nations of the world. Geneva: World Health Organiza- tion; 1966. (WHO Monograph Series, no 53).
6. World Health Organization. A growth chart
for international use in maternal and child health
care: guidelines for prima y health care person- nel. Geneva: 1978. (World Health Orga- nization nonserial publication).
7. Waterlow JC, Buzina R, Keller W, Lane JM, Nickaman NZ, Tanner JM. The pre- sentation and use of height and weight data for comparing the nutritional status of groups of children under 10 years. Bull WHO. 1977;55:489-498.
8. UNICEF. The state of the world’s children, 1991. New York: Oxford University Press; 1991.
9. World Bank. World development report 1990. New York: Oxford University Press; 1990. 10. Pan American Health Organization. Health conditions in the Americas, 1990 edition. Washington, DC: 1990.
11. Fedesarrollo, Instituto SER de Investiga- cion. Situation social de Colombia. Co- yuntura social. 1989;1:5-102.
12. Food and Agriculture Organization (FAO). The Fifth World Food Survey, 1985. Rome: FAO; 1987.
13. Ordoriez M. La fecundidad en Colombia, 1985: 1. United Nations. Update of fke nutrition sit- niveles diferencihes y determinanfes. Bogot&
uafion: recent trends in nufrifion in 33 coun- PROFAMILIA-Departamento National de
fries. Geneva: 1989. (A report compiled Estadistica (DANE); 1990.
World fertility survey. London, 1980. (Sci- entific reports, no 15).
15. PatiRo CA, Caicedo de Cardozo E, Ranjel M. Pobreza y desarrollo en Colombia: su im- pacto sobre la infancia y la mujer. Bogotd: UNICEF, Departamento National de Planificacibn, Instituto Colombiano de Bienestar Familiar; 1988.
16. Fedesarrollo, Institute SER de Investiga- cion. I: Gasto public0 social. Coyuntura social. 1989;1:11-15.
17. Colombia, Profamilia, Asociacion Pro- Bienestar de la Familia Colombiana. En- cuesta de prevalencia, demografta y salud, 1990. Bogota: Institute for Resource Develop- ment/Macro International; 1991. 18. Anderson M. Comparison of anthropo-
metric measures of nutritional status in preschool children in five developing coun- tries. Am J Clin Nutr. 1979;32:233945.
19. World Bank. Colombia: economic develop-
ment and
policy under changing conditions. Washington, DC: 1984. (World Bank country study).20. London0 JL. Distribution national de1 in- greso en 1988: Una mirada en perspectiva. Coyuntura social. 1989;1:103-111. 21. Uribe C. Colombia’s food and nutrition
plan, PAN. Food Policy. 1986;12(1):47-70. 22. Mora JO. Nutritional status of the Colom- bian population: results of the 1977-80 national survey. Int J Vitam Nutr Res. 1985;27:19-32.
23. Mora JO, Rodriguez E. Situacio’n nufri- cional
de
la poblacion colombiana, 1977-80: volumen II, anemias nufricionales. Bogota: Ministerio de Salud, Instituto National de Salud, Asociacion Colombiana de Facul- tades de Medicina; 1985.444
Child Health Phase II
In July 1991, the Pan American Health Organization, in partnership with the United States Agency for International Development (USAID), launched Child Health Phase II, an accelerated immuniza- tion program in the Americas for the period 1991-1995, with the sign- ing of a US$20 million agreement with USAID. The purpose of the program is to complete the eradication of polio in the Western Hemi- sphere, to eliminate measles in the Caribbean, to make substantial progress toward the elimination of both measles and neonatal tetanus throughout the Americas, and to increase coverage with the other three El’1 vaccines. The expected cost of the effort over five years is some US$lOO million, to be contributed by donor countries, develop- ment agencies, and international and private organizations.